

On June 13, 2019, the Binance Coin price reached a high of 44,843 satoshis. A gradual increase ensued, which intensified on June 22. On June 26, the BNB price reached a low of 25,781 satoshis. After a failed attempt at initiating an upward move, the price decreased and reached a similar low on July 10.
 Will BNB begin an upward move? In this article, we are going to analyze the BNB price in different time-frames alongside technical indicators in order to answer this question.
For our previous analysis click here.
Will BNB begin an upward move? In this article, we are going to analyze the BNB price in different time-frames alongside technical indicators in order to answer this question.
For our previous analysis click here.
BNB Price: Trends and Highlights for July 12
- BNB/BTC is trading inside a descending wedge.
- The RSI has generated bullish divergence.
- The BNB price just broke out from a symmetrical triangle.
- The breakout transpired with very significant volume.
BNB Price in a Descending Wedge
Let’s begin with the daily time-frame. We can see that since June 13, the BNB price has been trading inside the descending wedge outlined below. The descending wedge is a bullish pattern, making price breakouts more likely.
One such attempt was made on July 2, but it ultimately proved unsuccessful.
The price is approaching the end of the wedge, which is projected to be on July 19.
At the time of writing, it was in the midst of initiating another breakout attempt.
According to the RSI, this one will be successful
The descending wedge is a bullish pattern, making price breakouts more likely.
One such attempt was made on July 2, but it ultimately proved unsuccessful.
The price is approaching the end of the wedge, which is projected to be on July 19.
At the time of writing, it was in the midst of initiating another breakout attempt.
According to the RSI, this one will be successful
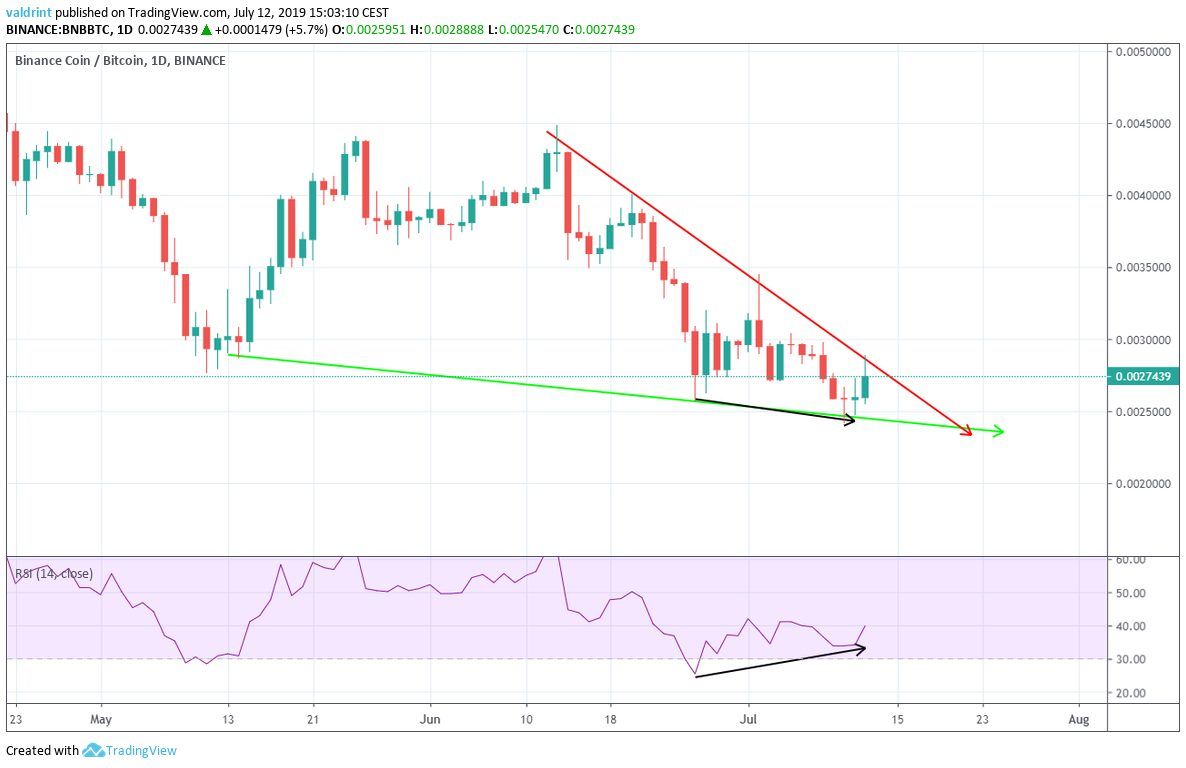 Since reaching a low on July 26, it has been generating significant bullish divergence.
The fact that it is occurring inside a bullish pattern further affirms its validity.
Now, let’s take a look at a shorter-term time-frame to see when this move might begin.
Since reaching a low on July 26, it has been generating significant bullish divergence.
The fact that it is occurring inside a bullish pattern further affirms its validity.
Now, let’s take a look at a shorter-term time-frame to see when this move might begin.
Symmetrical Triangle
A look at the 30-minute time-frame shows that the price has been trading inside a symmetrical triangle since July 8.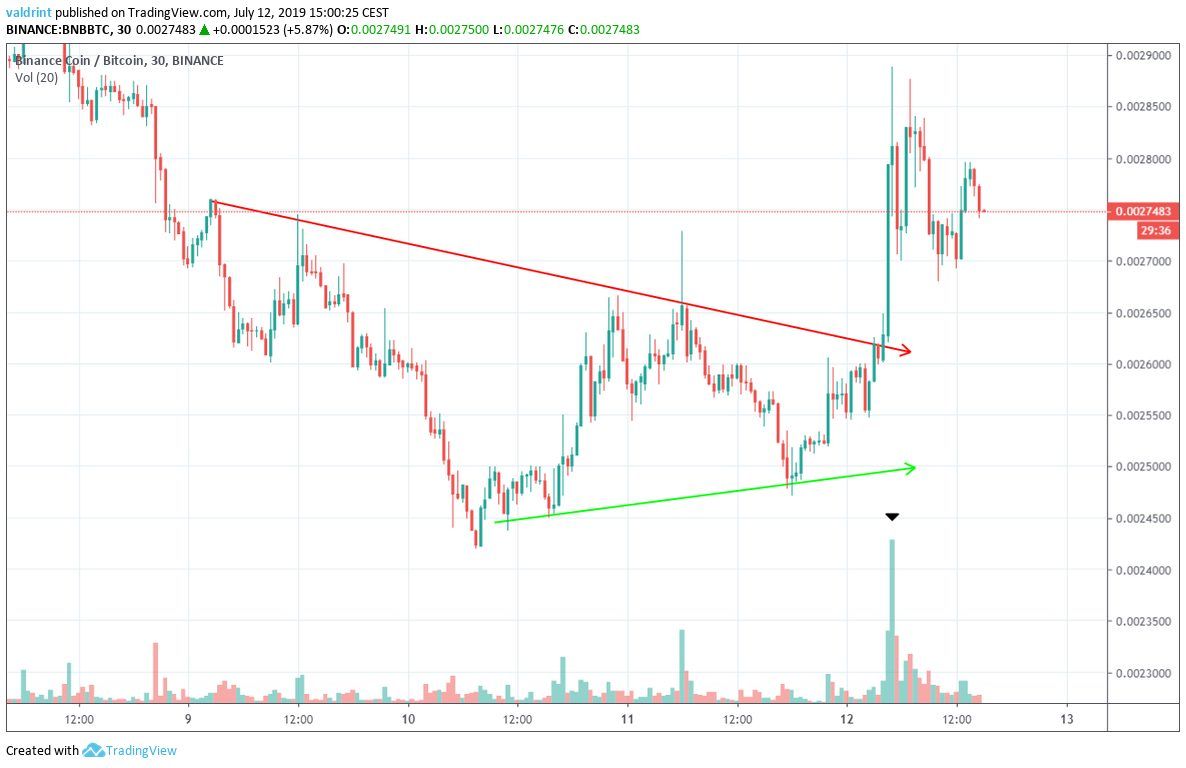 On July 12, BNB began an upward move and broke out from the triangle.
The breakout transpired with very significant volume, confirming its validity.
Therefore, it is likely that the potential upward move that will cause the price to break out from the descending wedge has already begun.
An interesting development to point out is the level at which the rally ended.
On July 12, BNB began an upward move and broke out from the triangle.
The breakout transpired with very significant volume, confirming its validity.
Therefore, it is likely that the potential upward move that will cause the price to break out from the descending wedge has already begun.
An interesting development to point out is the level at which the rally ended.
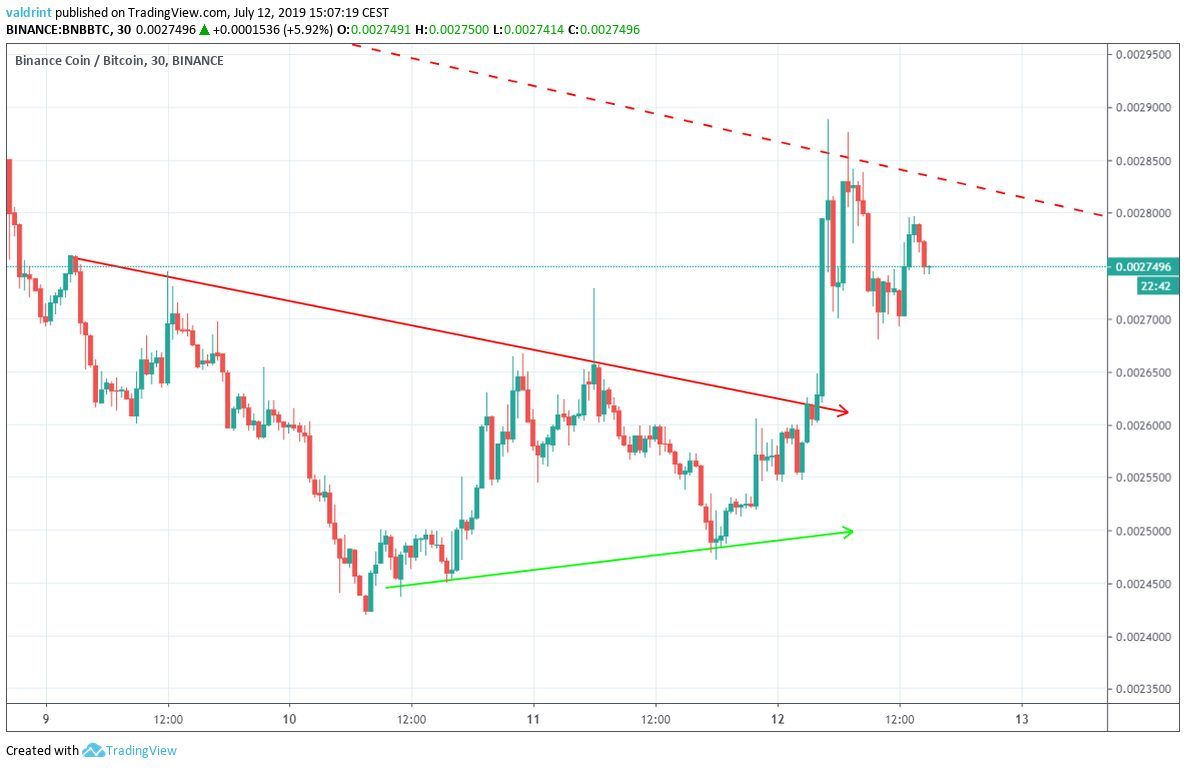 The dashed line outlined above is the resistance line of the long-term wedge.
Even though the BNB price reached the line, it was unsuccessful in breaking out above it.
According to our analysis, it will eventually be successful in doing so.
The dashed line outlined above is the resistance line of the long-term wedge.
Even though the BNB price reached the line, it was unsuccessful in breaking out above it.
According to our analysis, it will eventually be successful in doing so.
Summary
The BNB price has been trading inside a descending wedge since July 11. Technical indicators suggest that the BNB price will soon break out from the wedge. A look at very short-term time-frames indicates that this move may have already begun. Do you think that Binance Coin will break out from the wedge? Let us know in the comments below.Disclaimer: This article is not trading advice and should not be construed as such. Always consult a trained financial professional before investing in cryptocurrencies, as the market is particularly volatile. Images are courtesy of Shutterstock, TradingView.
Top crypto platforms in the US
Disclaimer
In line with the Trust Project guidelines, this price analysis article is for informational purposes only and should not be considered financial or investment advice. BeInCrypto is committed to accurate, unbiased reporting, but market conditions are subject to change without notice. Always conduct your own research and consult with a professional before making any financial decisions. Please note that our Terms and Conditions, Privacy Policy, and Disclaimers have been updated.

Valdrin Tahiri
Valdrin discovered cryptocurrencies while he was getting his MSc in Financial Markets from the Barcelona School of Economics. Shortly after graduating, he began writing for several different cryptocurrency related websites as a freelancer before eventually taking on the role of BeInCrypto's Senior Analyst.
(I do not have a discord and will not contact you first there. Beware of scammers)
READ FULL BIO
Sponsored
Sponsored