

The price of Binance Coin (BNB) has been steadily increasing throughout 2019. The increase intensified in March and the price made a high of 48,134 satoshis during the next month.

Binance Coin Price: Trends and Highlights for June 28
- The BNB price is trading inside a major support area at 28,000 satoshis.
- It is trading below both the 100- and 200-day moving averages (MA)
- The long-term moving averages are very close to making a bearish cross.
- The price has possibly made a head and shoulders pattern.
- There is support near 20,000 satoshis.
Potential Support for the BNB Price
The price of BNB on Binance is analyzed at daily intervals alongside the 100- and 200-period moving averages
On May 7, the price decreased below the 100-period MA. It made a low of 27,645 satoshis on May 11.
An upward move ensued shortly after.
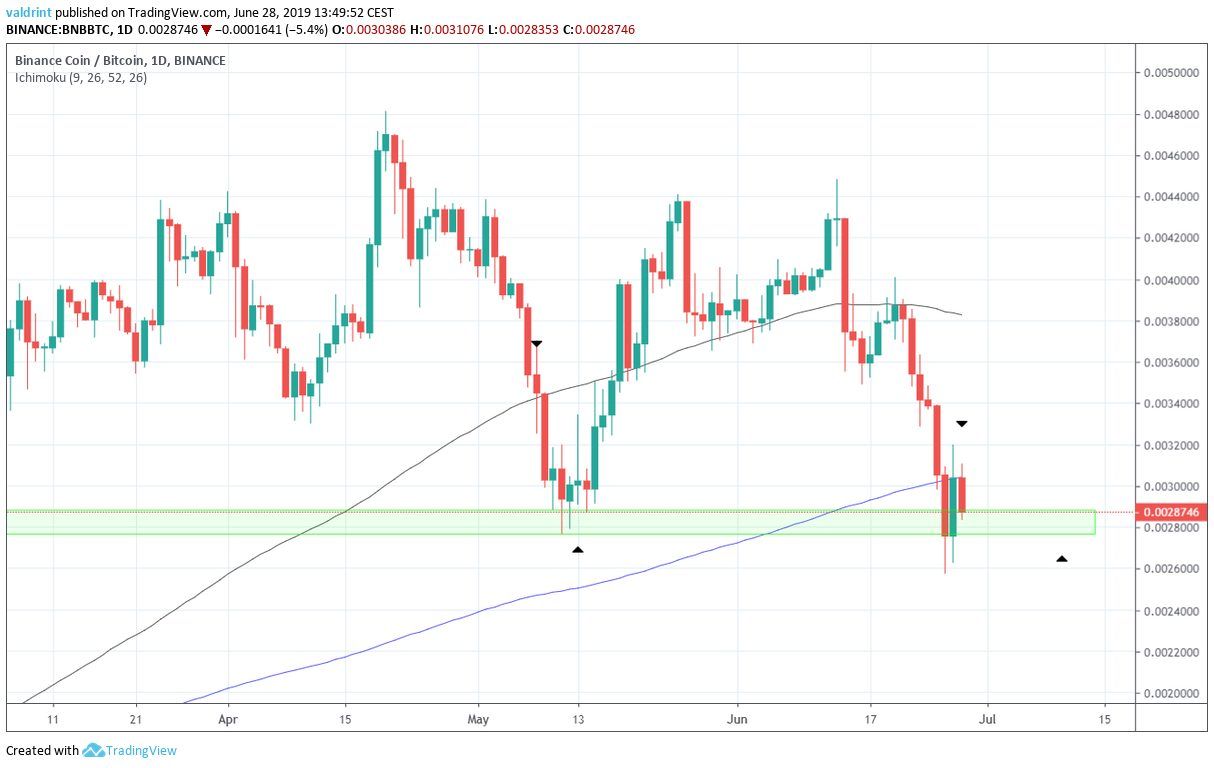 The BNB price moved below the 200-period MA on June 26. Similarly, it reached the support area near 28,000 satoshis shortly after.
Will the price act in a comparable way again?
The BNB price moved below the 200-period MA on June 26. Similarly, it reached the support area near 28,000 satoshis shortly after.
Will the price act in a comparable way again?
Head and Shoulders
A look at the daily time-frame shows that the BNB price has been following a descending support line, close to the major support area at 28,000 satoshis.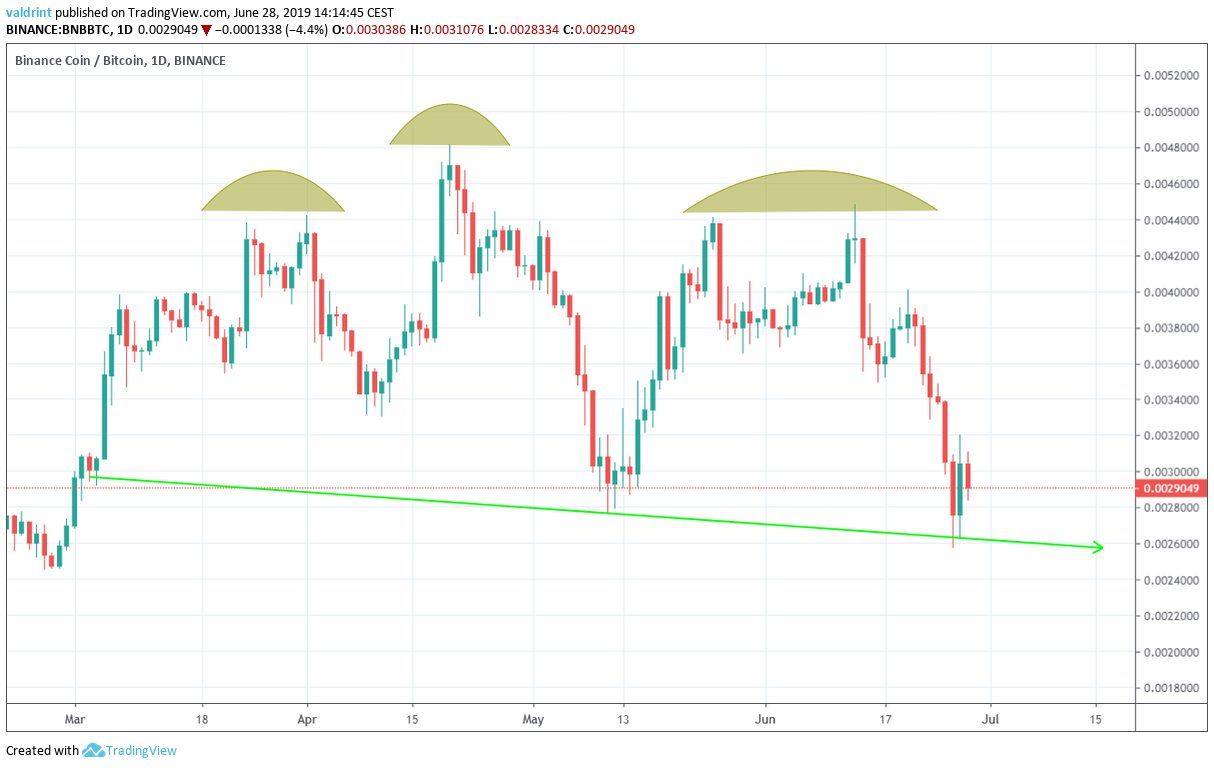 At the time of writing, the Binance Coin price was trading very close to the support line, having recently touched it for the third time.
As for the resistance, the highs reached above 44,000 satoshis resemble a head and shoulders (H&S), which is considered a bearish reversal pattern.
First, we have the highs near 43,800 satoshis on Mar 24 and 30. These combine to create the left shoulder of the pattern. Afterward, there is a high of 48,134 satoshis on Apr 20, which is the head. Coincidentally, this is the all-time high price reached. Finally, the highs near 44,000 satoshis reached on May 25 and June 13 combine to create the right shoulder. The descending support line acts as the neckline of the pattern.
The long-term moving averages support the possibility that the price has created an H&S pattern.
At the time of writing, the Binance Coin price was trading very close to the support line, having recently touched it for the third time.
As for the resistance, the highs reached above 44,000 satoshis resemble a head and shoulders (H&S), which is considered a bearish reversal pattern.
First, we have the highs near 43,800 satoshis on Mar 24 and 30. These combine to create the left shoulder of the pattern. Afterward, there is a high of 48,134 satoshis on Apr 20, which is the head. Coincidentally, this is the all-time high price reached. Finally, the highs near 44,000 satoshis reached on May 25 and June 13 combine to create the right shoulder. The descending support line acts as the neckline of the pattern.
The long-term moving averages support the possibility that the price has created an H&S pattern.
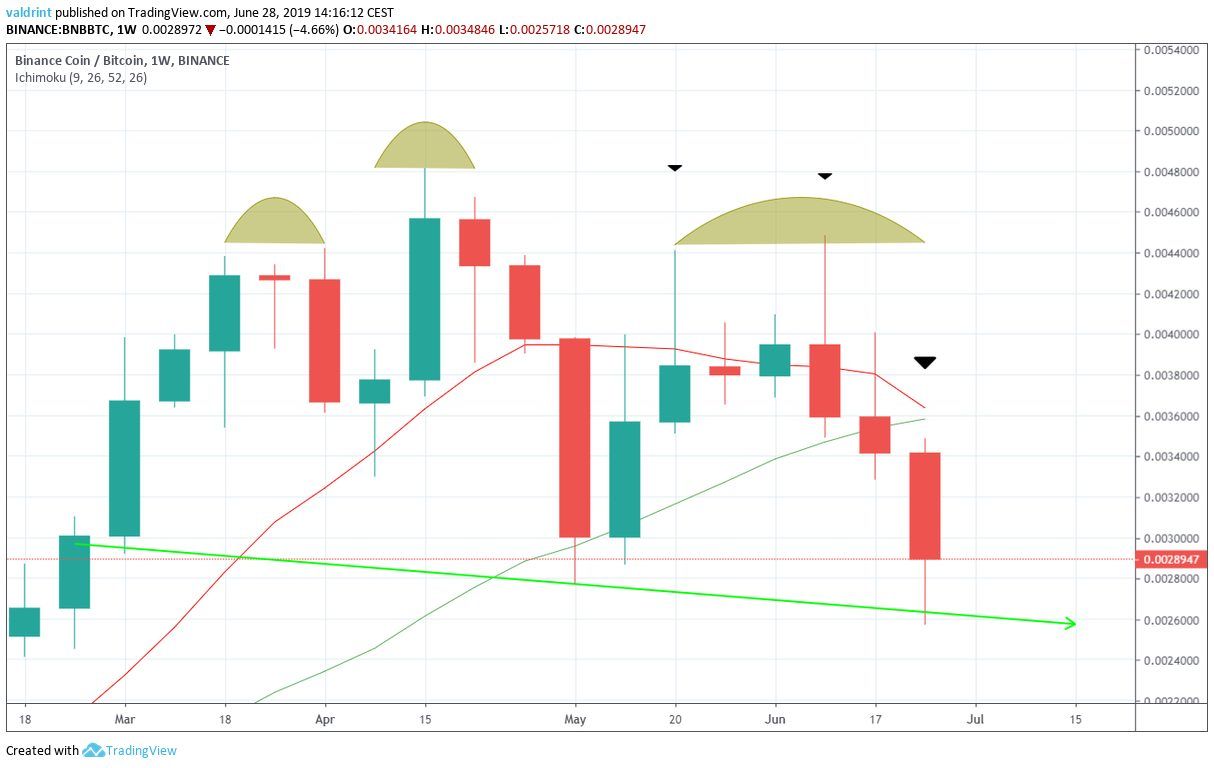 The recent decrease caused the BNB price to drop below both the 10- and the 20-week moving averages.
At the time of writing, they were very close to making a bearish cross. A cross between these long-term MAs could likely indicate that the price is now in a downtrend.
This would further validate the possibility that we are in an H&S pattern, and a breakdown from the neckline will soon commence.
If that does occur, where will the price find support?
The recent decrease caused the BNB price to drop below both the 10- and the 20-week moving averages.
At the time of writing, they were very close to making a bearish cross. A cross between these long-term MAs could likely indicate that the price is now in a downtrend.
This would further validate the possibility that we are in an H&S pattern, and a breakdown from the neckline will soon commence.
If that does occur, where will the price find support?
Possible Support
In order to answer that, we have used the Fibonacci retracement tool from the beginning of the upward move in December 2018 to the high reached on Apr 20, 2019.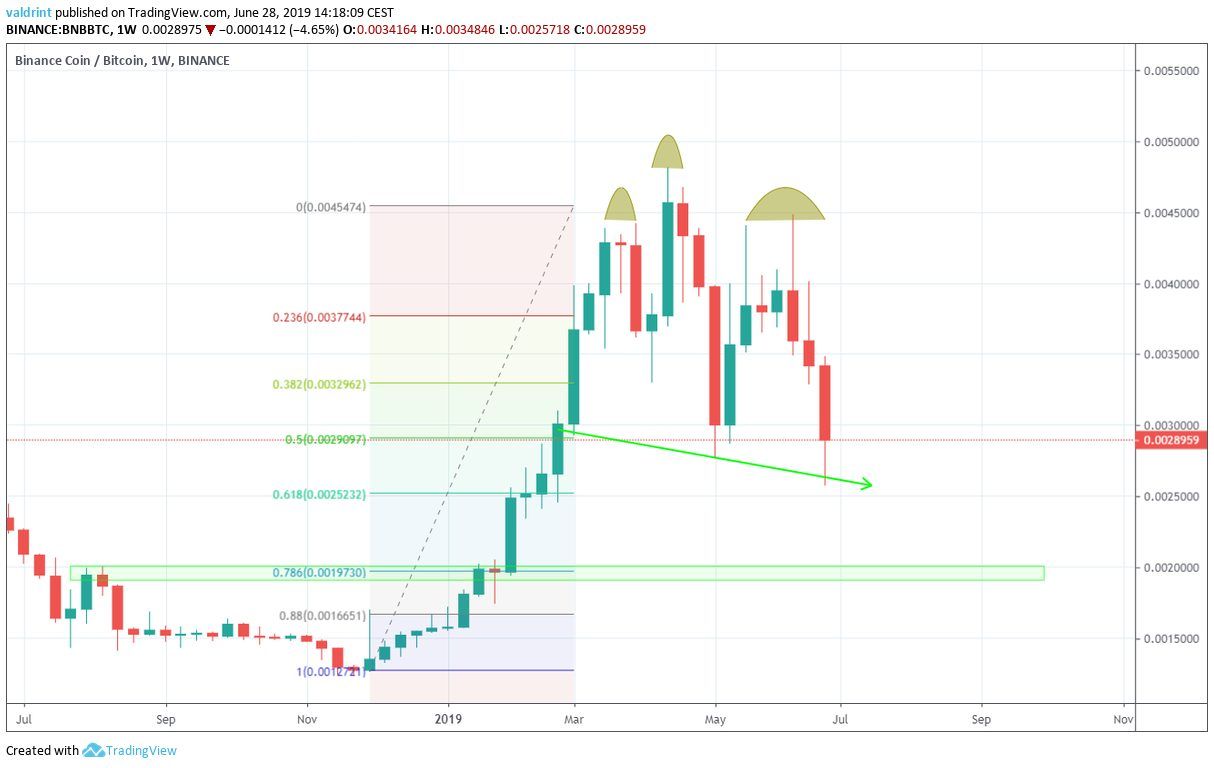 The closest support area is found near 20,000 satoshis. It previously acted as resistance in Aug 2018 and Jan 2019.
Furthermore, it coincides with the 0.786 fib level of the entire upward move.
The closest support area is found near 20,000 satoshis. It previously acted as resistance in Aug 2018 and Jan 2019.
Furthermore, it coincides with the 0.786 fib level of the entire upward move.
Summary
BNB reached an all-time high price on Apr 20. Since then, it has been decreasing, following a descending support line. Furthermore, it has possibly created a head and shoulders, which is considered a bearish reversal pattern. An analysis of moving averages supports the possibility that the price will soon break down from the H&S. Do you think the BNB price will break down? Let us know in the comments below.Disclaimer: This article is not trading advice and should not be construed as such. Always consult a trained financial professional before investing in cryptocurrencies, as the market is particularly volatile. Images are courtesy of Shutterstock, TradingView.
Disclaimer
In line with the Trust Project guidelines, this price analysis article is for informational purposes only and should not be considered financial or investment advice. BeInCrypto is committed to accurate, unbiased reporting, but market conditions are subject to change without notice. Always conduct your own research and consult with a professional before making any financial decisions. Please note that our Terms and Conditions, Privacy Policy, and Disclaimers have been updated.

Valdrin Tahiri
Valdrin discovered cryptocurrencies while he was getting his MSc in Financial Markets from the Barcelona School of Economics. Shortly after graduating, he began writing for several different cryptocurrency related websites as a freelancer before eventually taking on the role of BeInCrypto's Senior Analyst.
(I do not have a discord and will not contact you first there. Beware of scammers)
READ FULL BIO
Sponsored
Sponsored