
Binance Coin (BNB) has broken out from an important resistance level and validated it as support afterward.
Some technical indicators, however, suggest that a bearish reversal could transpire soon.
BNB Makes a Double-Top
The BNB price has been gradually increasing since March 13. The rally stalled near the end of July when the price reached the $21.50 area and was rejected. On Aug 3, BNB was finally successful in breaking out above the $21.50 area and validated it as support afterward. If the price continues increasing, the next resistance area would be found at $25.50. However, BNB has created what resembles a double-top, which is normally considered a bearish reversal pattern. The pattern is combined with a considerable bearish divergence in both the RSI and the MACD, even though the latter has begun to move upwards. Therefore, it is possible that the price will revisit the $21.50 area to test support once more.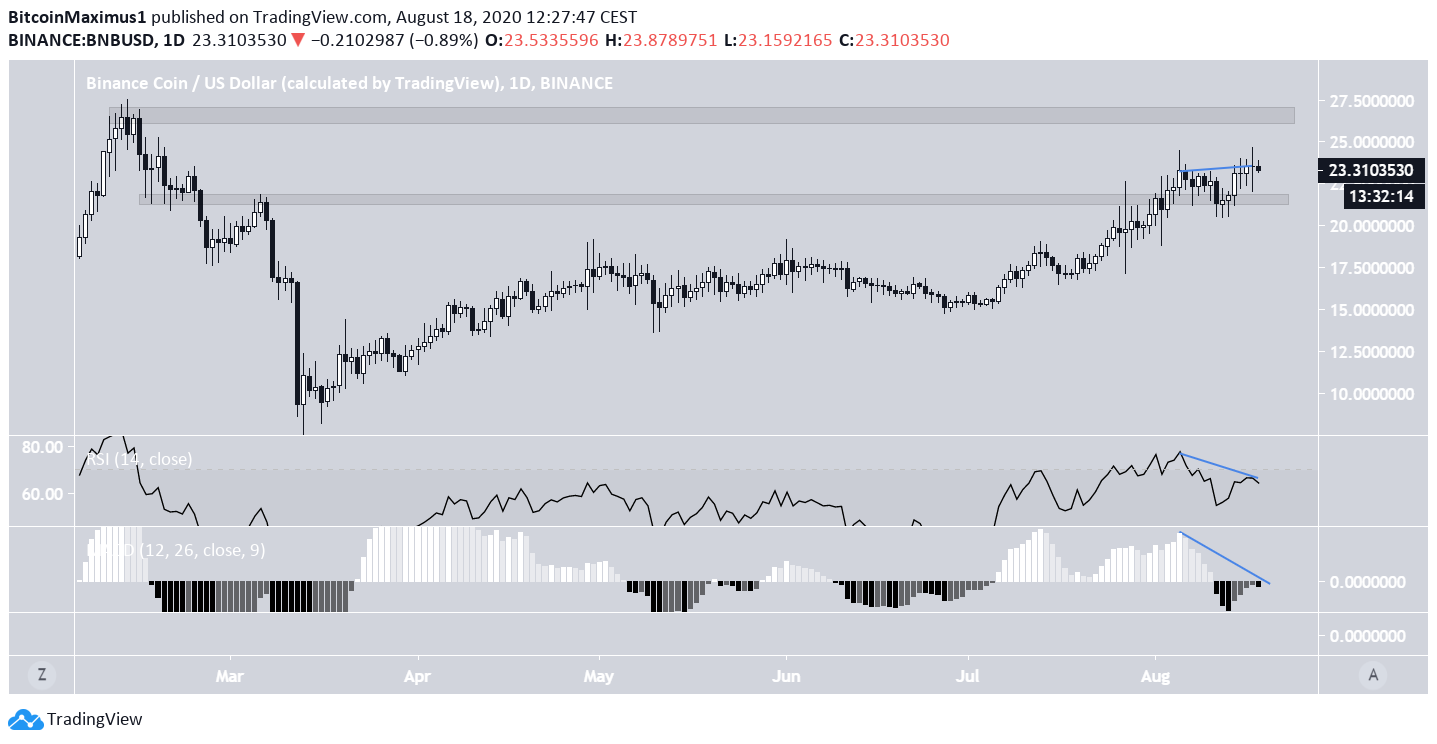
Short-Term Weakness
The short-term chart reveals some additional weaknesses. First, we can see a deviation above the $23.50 area which could not be sustained, since BNB has fallen back below the resistance area. Second, there is a pronounced bearish divergence in both the RSI and the MACD. This indicates that the price is likely to move downward towards $22.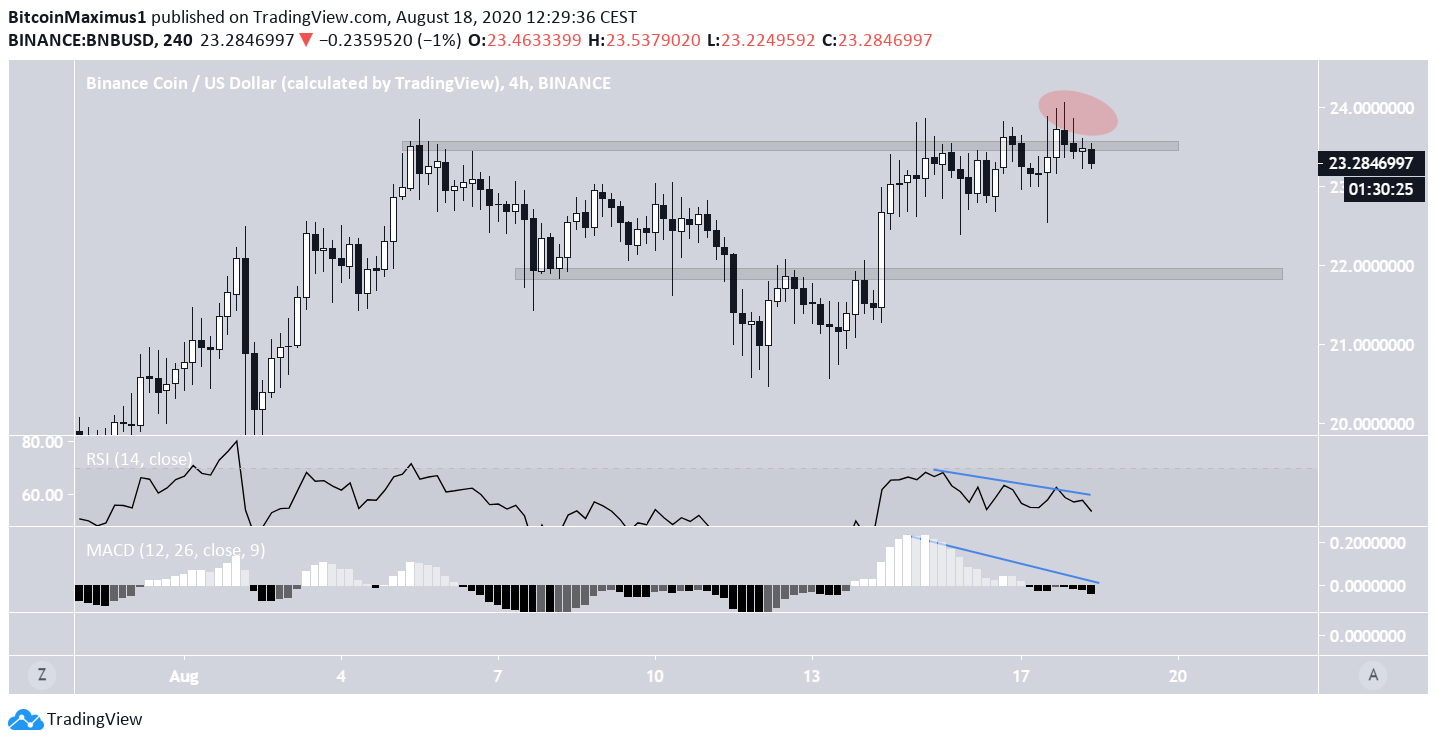
Wave Count
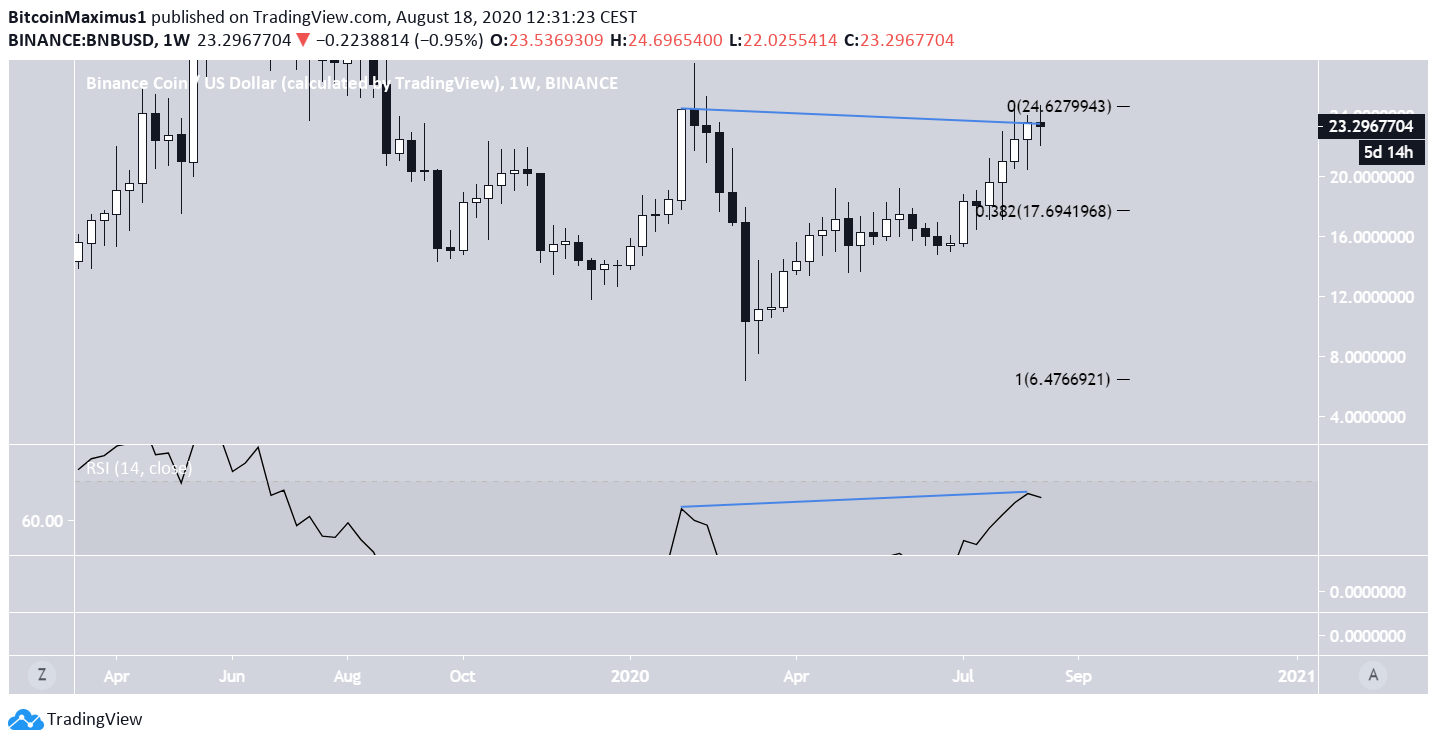
As for the wave count, it is possible that the price began a five-wave formation on June 29, which ended with a high of $23.83 on Aug 5. If the count is correct, the price is now near the top of a B wave, after which a decrease is expected to transpire. The multiple divergences support this possibility. The low of the C wave could be reached near $19.30, the 0.5 Fib level of the entire upward move, and the previously mentioned support area. Since the 1.382 Fib time level of the upward move lands on Aug 20, the C wave low should be reached after this date.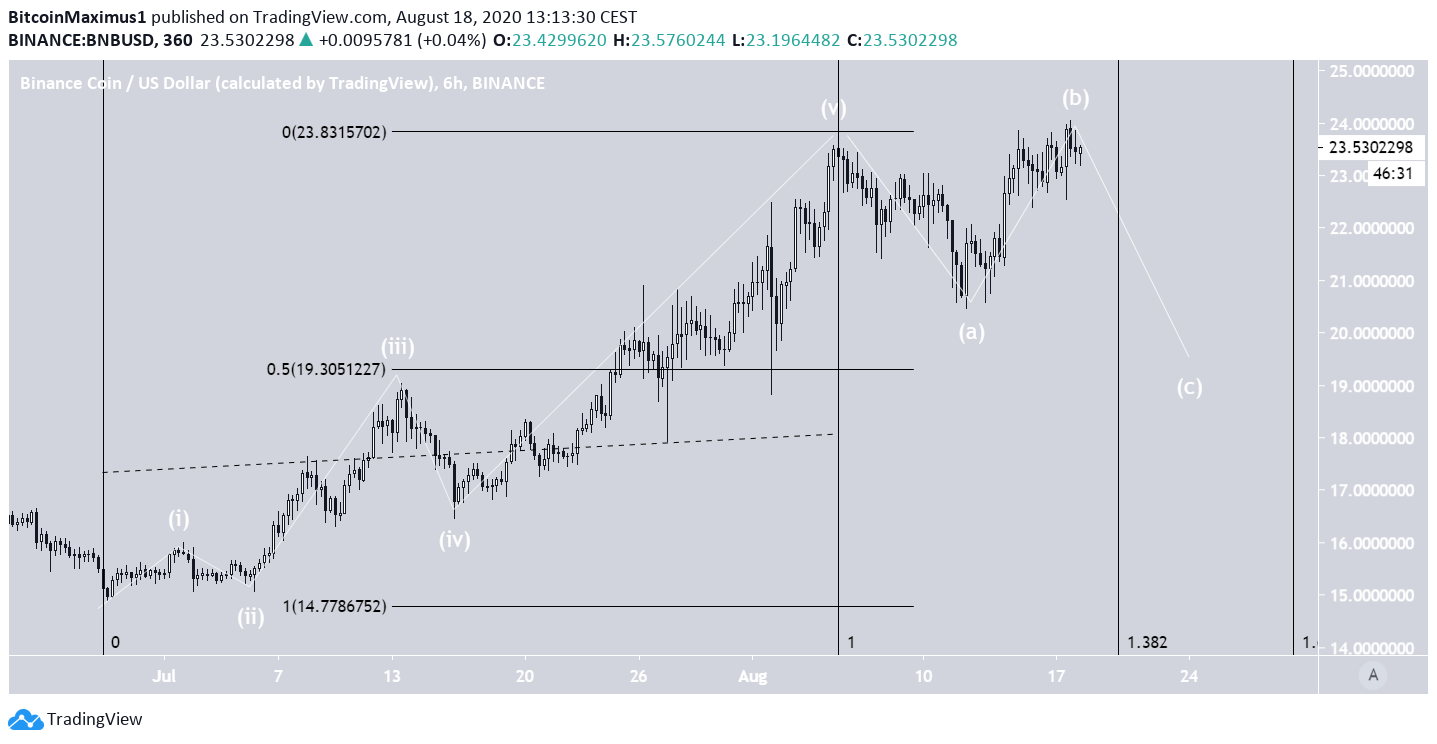
Disclaimer
In line with the Trust Project guidelines, this price analysis article is for informational purposes only and should not be considered financial or investment advice. BeInCrypto is committed to accurate, unbiased reporting, but market conditions are subject to change without notice. Always conduct your own research and consult with a professional before making any financial decisions. Please note that our Terms and Conditions, Privacy Policy, and Disclaimers have been updated.

Valdrin Tahiri
Valdrin discovered cryptocurrencies while he was getting his MSc in Financial Markets from the Barcelona School of Economics. Shortly after graduating, he began writing for several different cryptocurrency related websites as a freelancer before eventually taking on the role of BeInCrypto's Senior Analyst.
(I do not have a discord and will not contact you first there. Beware of scammers)
READ FULL BIO
Sponsored
Sponsored