


Binance Coin (BNB) has already recouped the majority of its losses from the Sept 2 decrease.
However, BNB has reached an important resistance area which threatens to knock the price back down.
BNB Deviation Above Range High
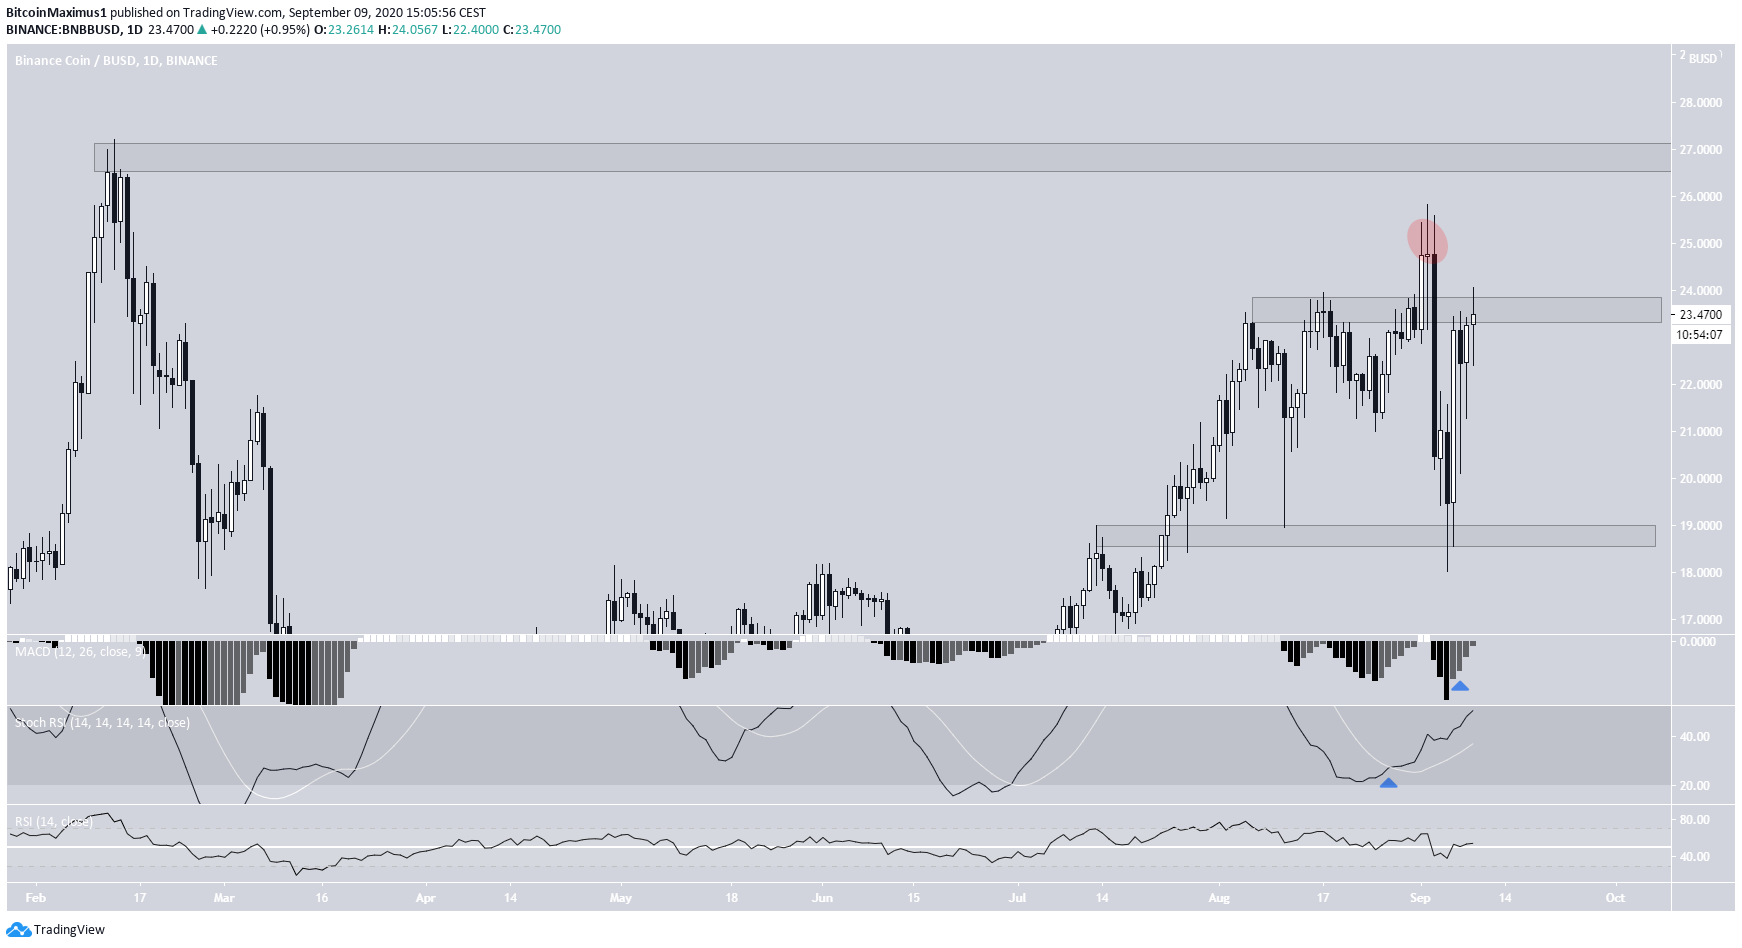
On Sept 1, the BNB price broke out above the $23.50 resistance area to reach a high of $25.81. However, the price dropped sharply afterward, making the previous movement a deviation above the resistance (shown in the red circle below).
The price found support at $18.80 and initiated a bounce that is still ongoing that has taken the price back to the $24 resistance. If successful in breaking out, BNB would likely move towards the next resistance area at $27.
While the price action indicates that another rejection is more likely, technical indicators have begun to turn bullish. There is a bullish cross in the stochastic RSI, and both the MACD and RSI are increasing. Therefore, the outlook from the daily time-frame is uncertain.
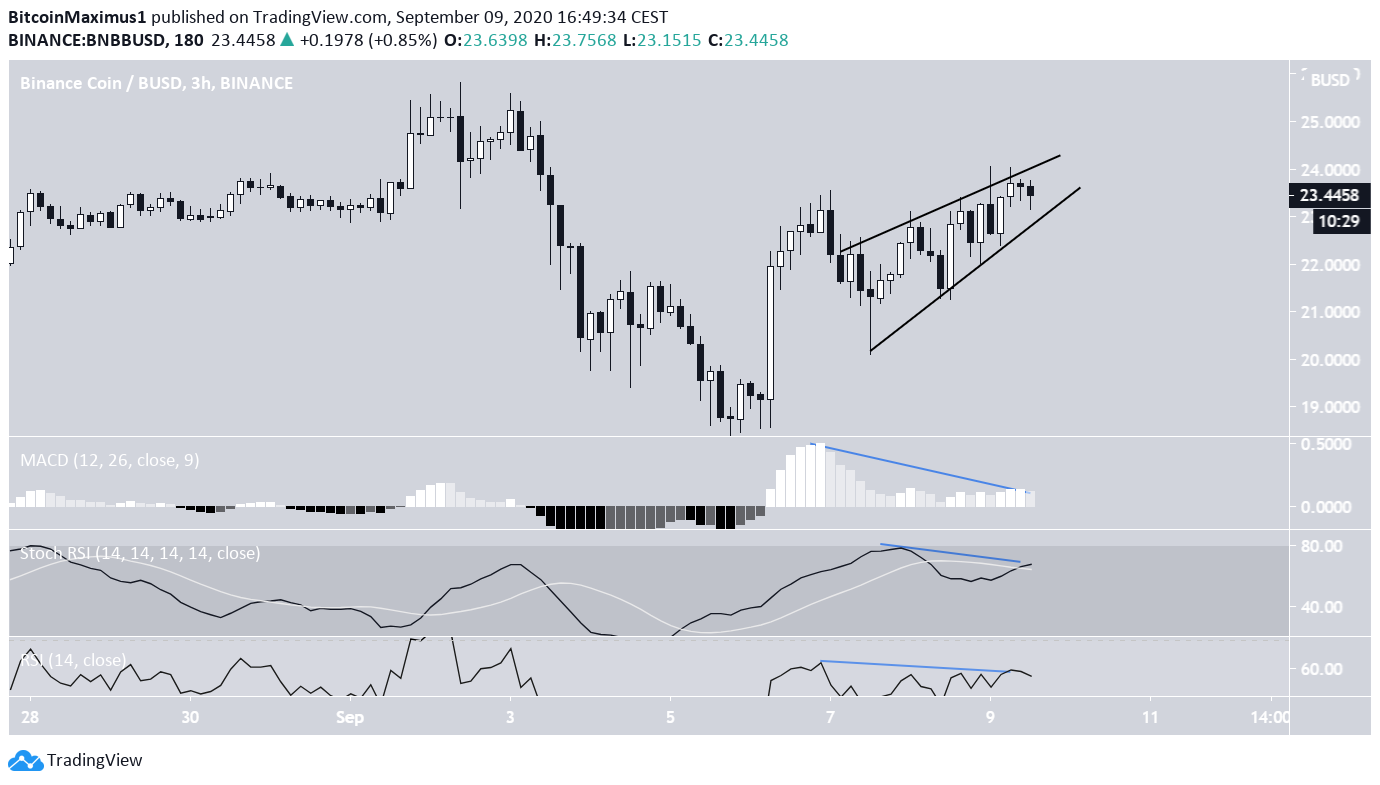
The short-term chart is clearer, indicating that a decrease is more likely. Besides bearish divergences in the RSI, MACD, and Stochastic RSI, the price has created what seems like an ascending wedge, which is normally considered a bearish reversal pattern.
BNB is expected to break down from the wedge, and head towards the $20.80-$18.80 range.
Wave Count
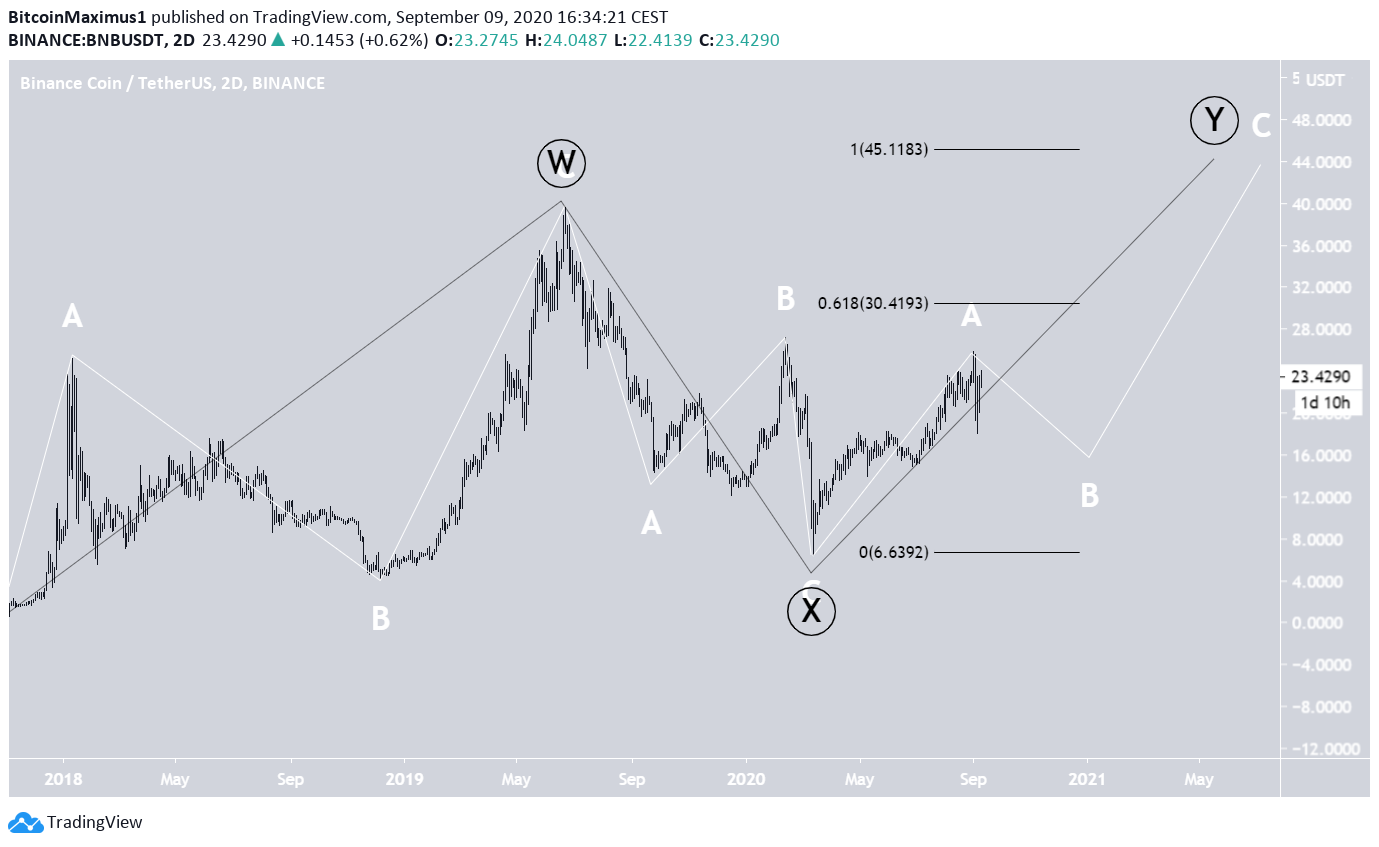
Due to the considerable overlap and lack of a five-wave structure, the long-term wave count for BNB suggests that the price is completing some type of complex W-X-Y correction (in black below).
Based on the length of the W wave, we can determine a possible high of either $30.41 or $45.11 for the top of wave Y—the latter being more likely.
If the count is correct, the price has completed sub-wave A (White) and is due for a short correction before resuming its upward movement.
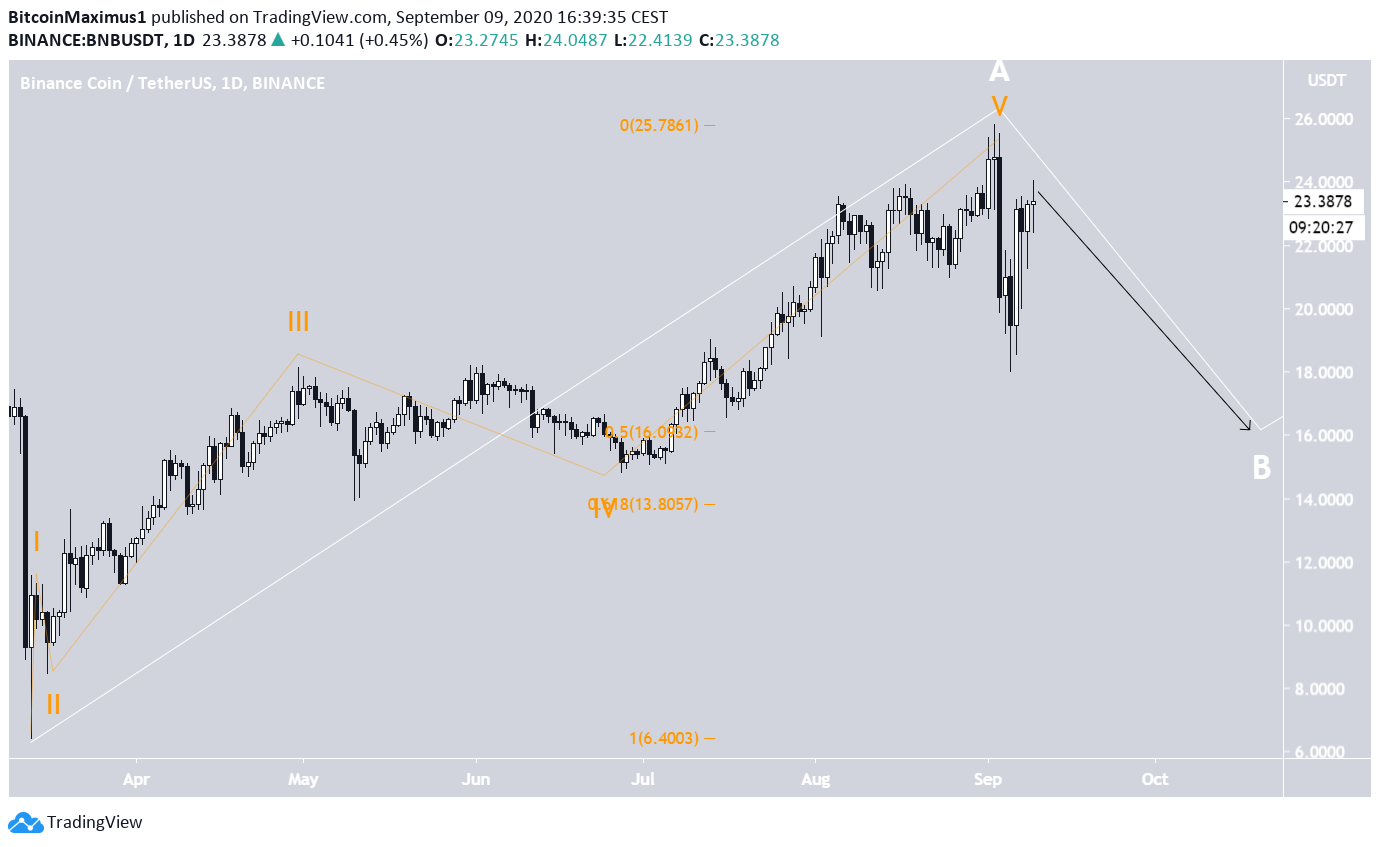
A closer look reveals that the price has completed a five-wave impulsive formation (orange), which created wave A.
A correction could take the price towards $16, after which the upward trend is expected to resume.
BNB/BTC
Cryptocurrency trader @PostyXBT outlined a BNB chart, which shows that the price is struggling to break out above a resistance area and a long-term moving average (MA).
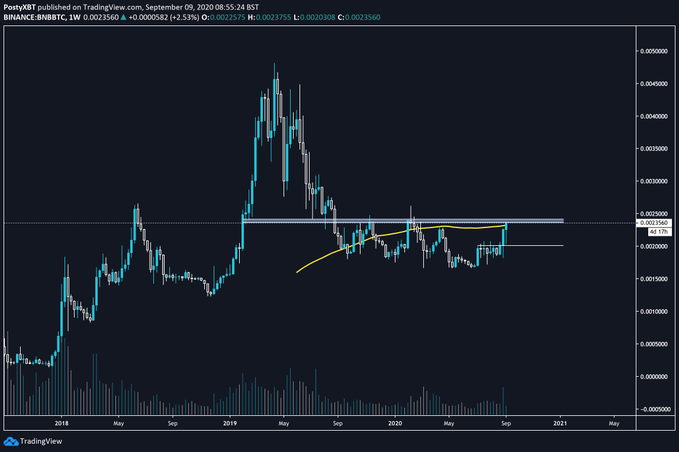
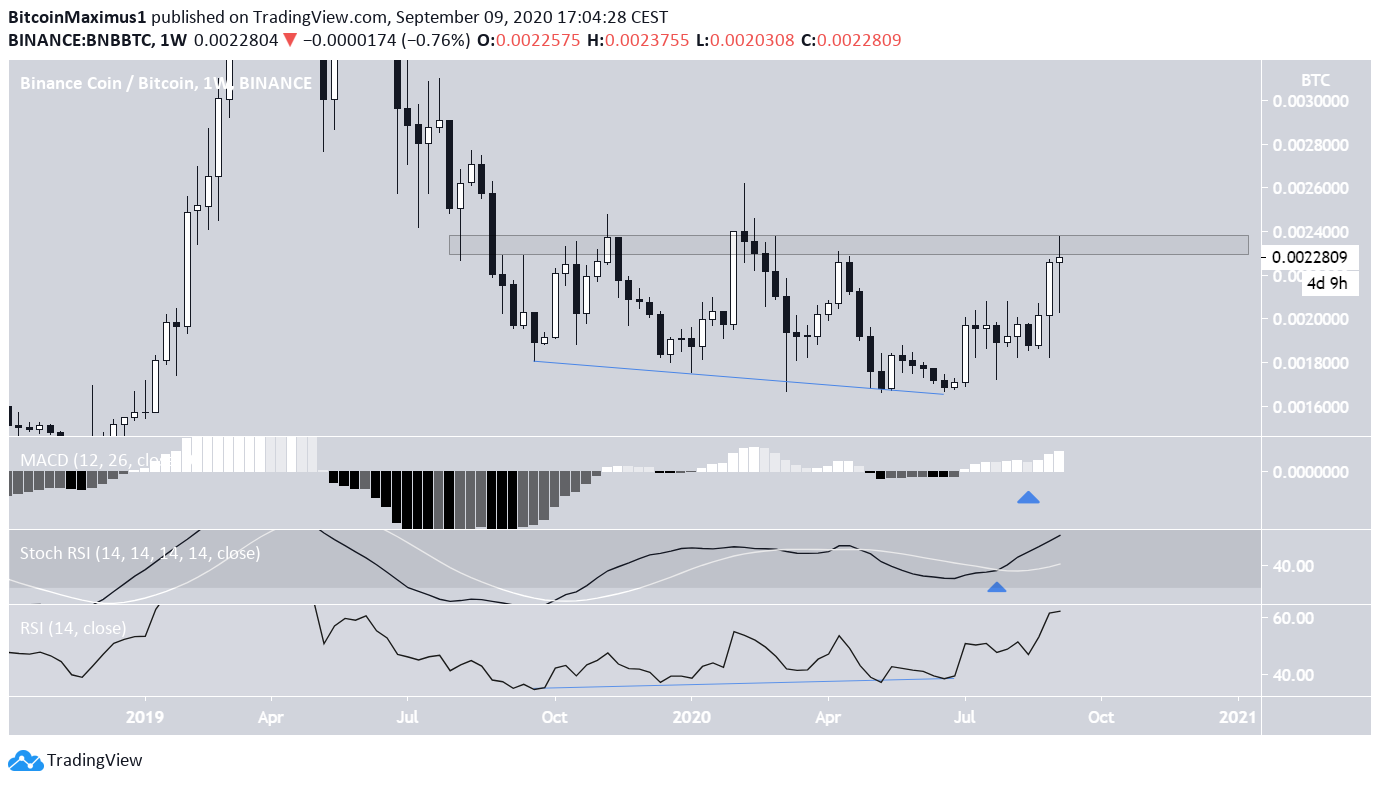
The aforementioned resistance area is found at ₿0.00235. The area has rejected the price four times since October 2019. A resistance area gets weaker each time it is tested, so the price is expected to finally break out.
Furthermore, technical indicators are bullish. The RSI has generated a yearlong bullish divergence, the stochastic RSI has made a bullish cross, and the MACD has already crossed into positive territory.
If the price breaks out, the next resistance area would be found at ₿0.003.
For BeInCrypto’s latest Bitcoin (BTC) analysis, click here!


