
Binance Coin (BNB) has regained its footing after a considerable decrease to support and looks ready to initiate a short-term rally.
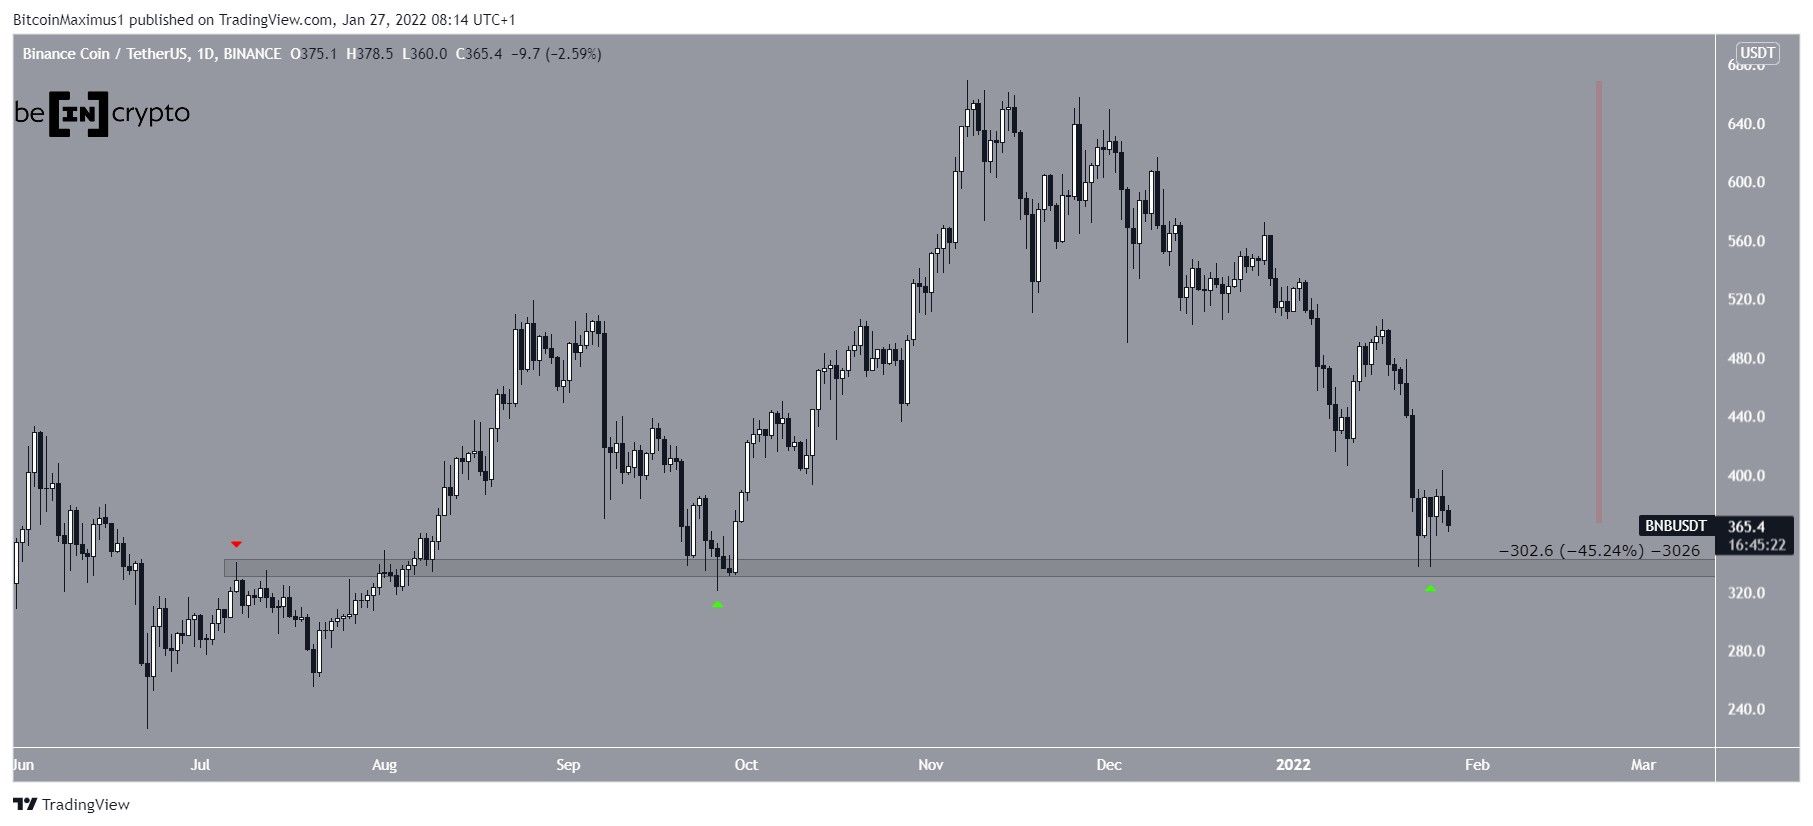
On May 10, BNB reached an all-time high price of $692 before falling sharply. After a long period of consolidation, it approached these levels once more but only managed to reach $669 on Nov 7. It has been falling since then and has decreased by 45%.
The downward move led to a local low of $336 on Jan 24. The low served to validate the $335 area as support. Previously, the area had acted as resistance in July 2021 (red icon) before turning to support in September (green icon). Therefore, it’s possible that the level will be able to boost the price up from here again.
Future BNB movement
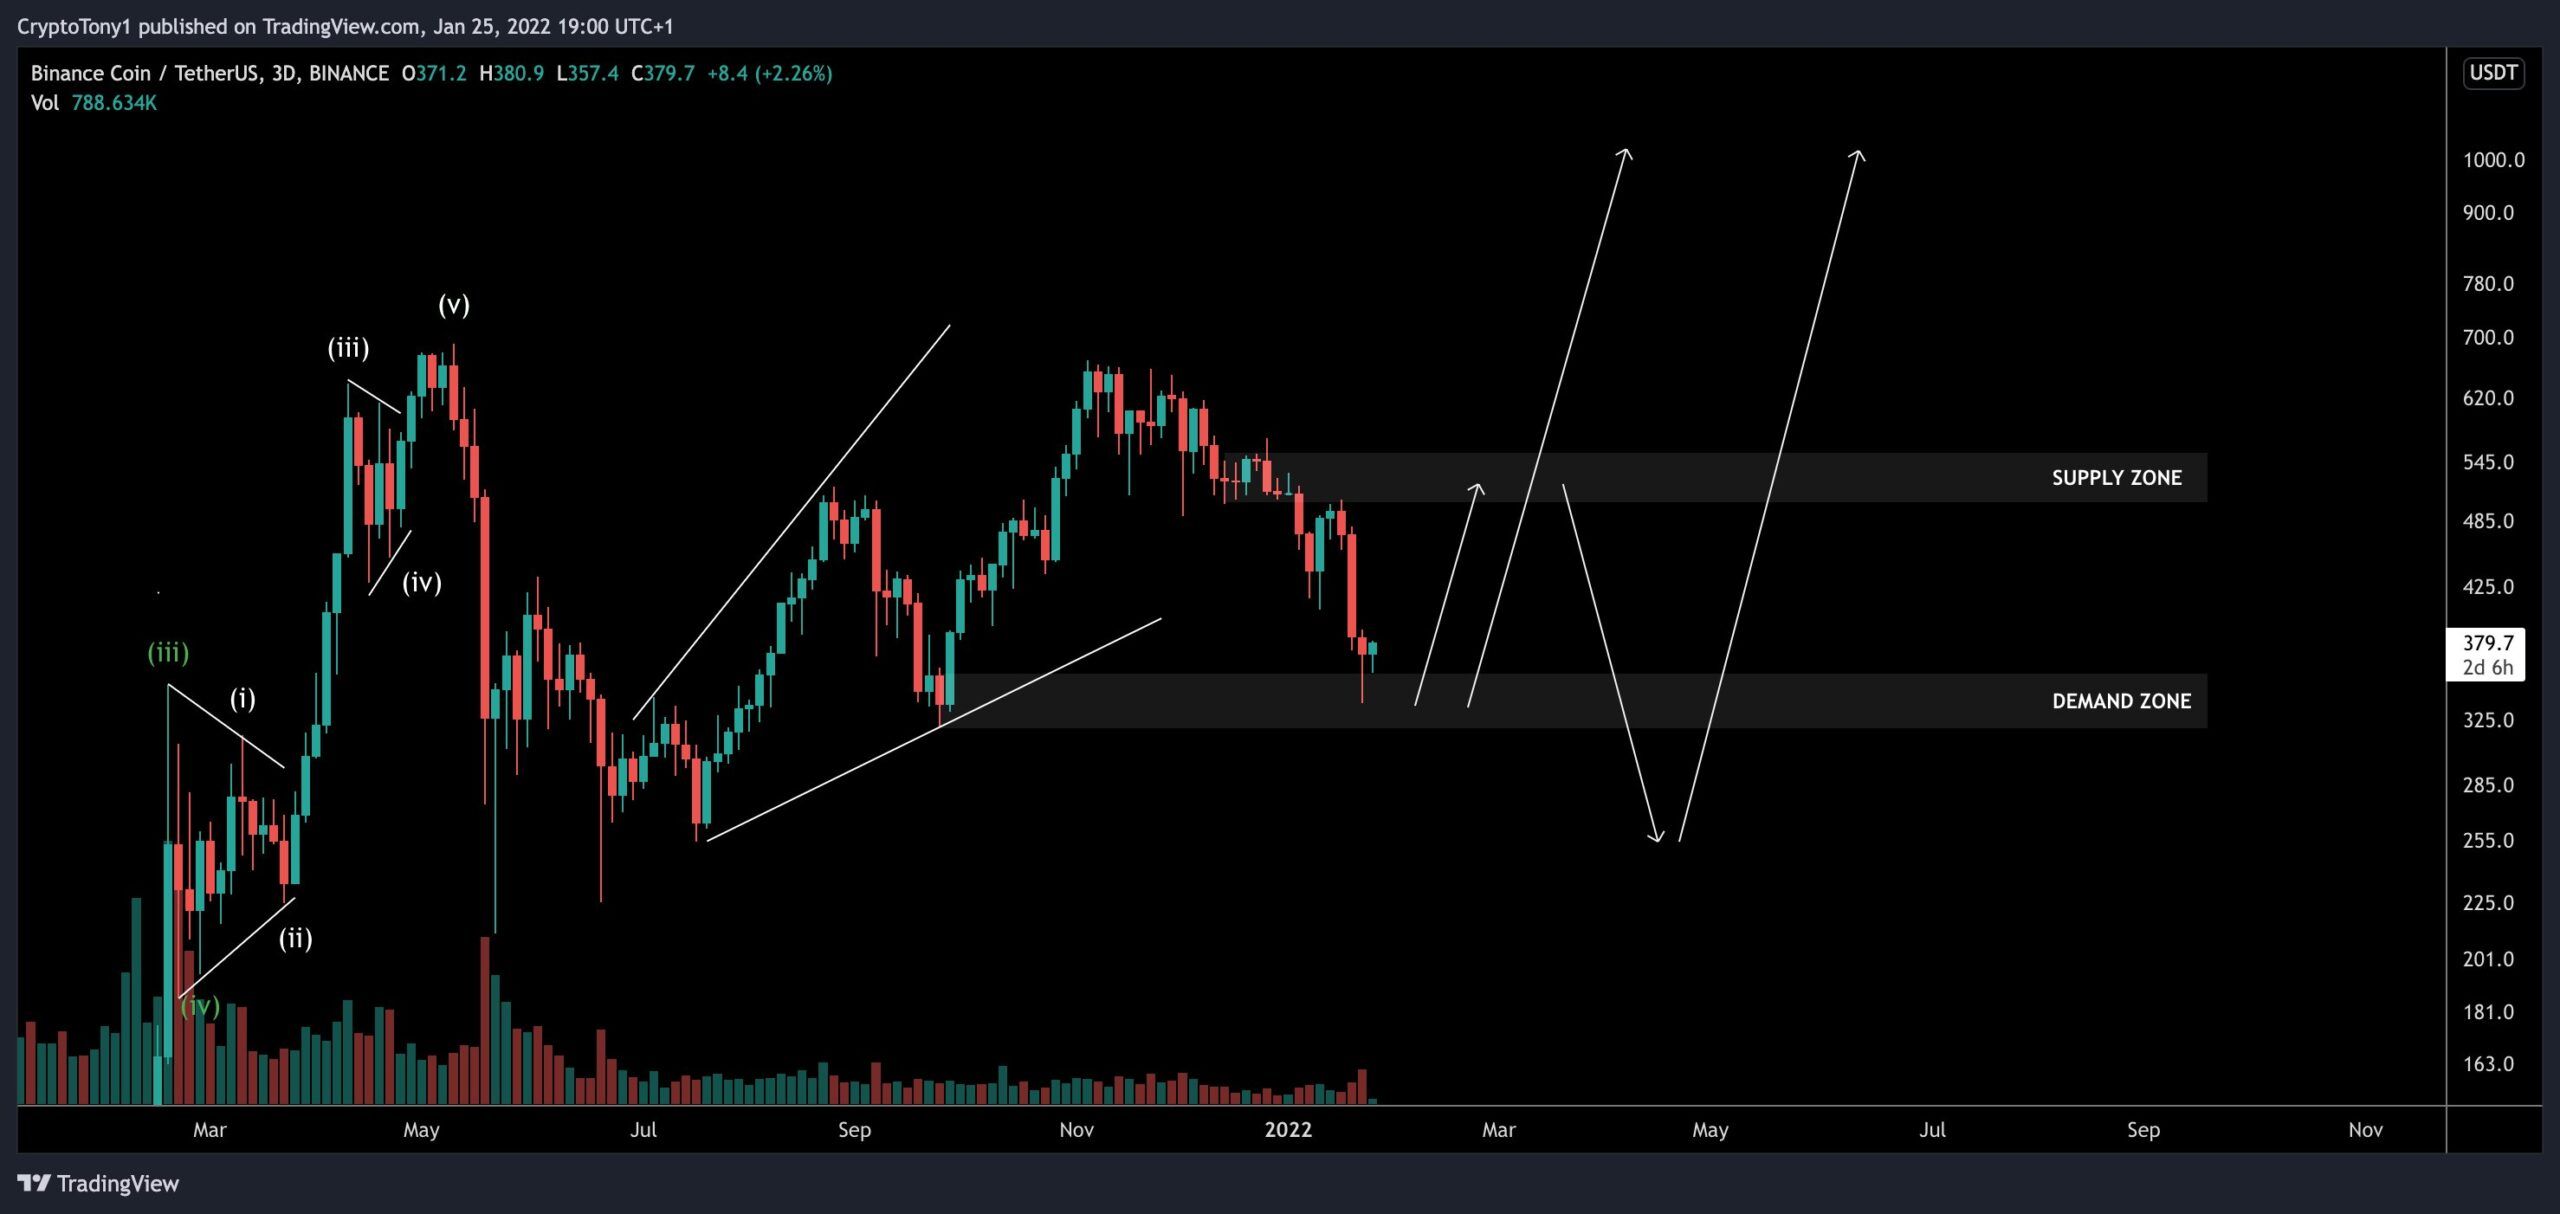
Cryptocurrency trader @CryptoTony_ tweeted a BNB chart, stating that it could potentially rebound at the $325 horizontal support area.
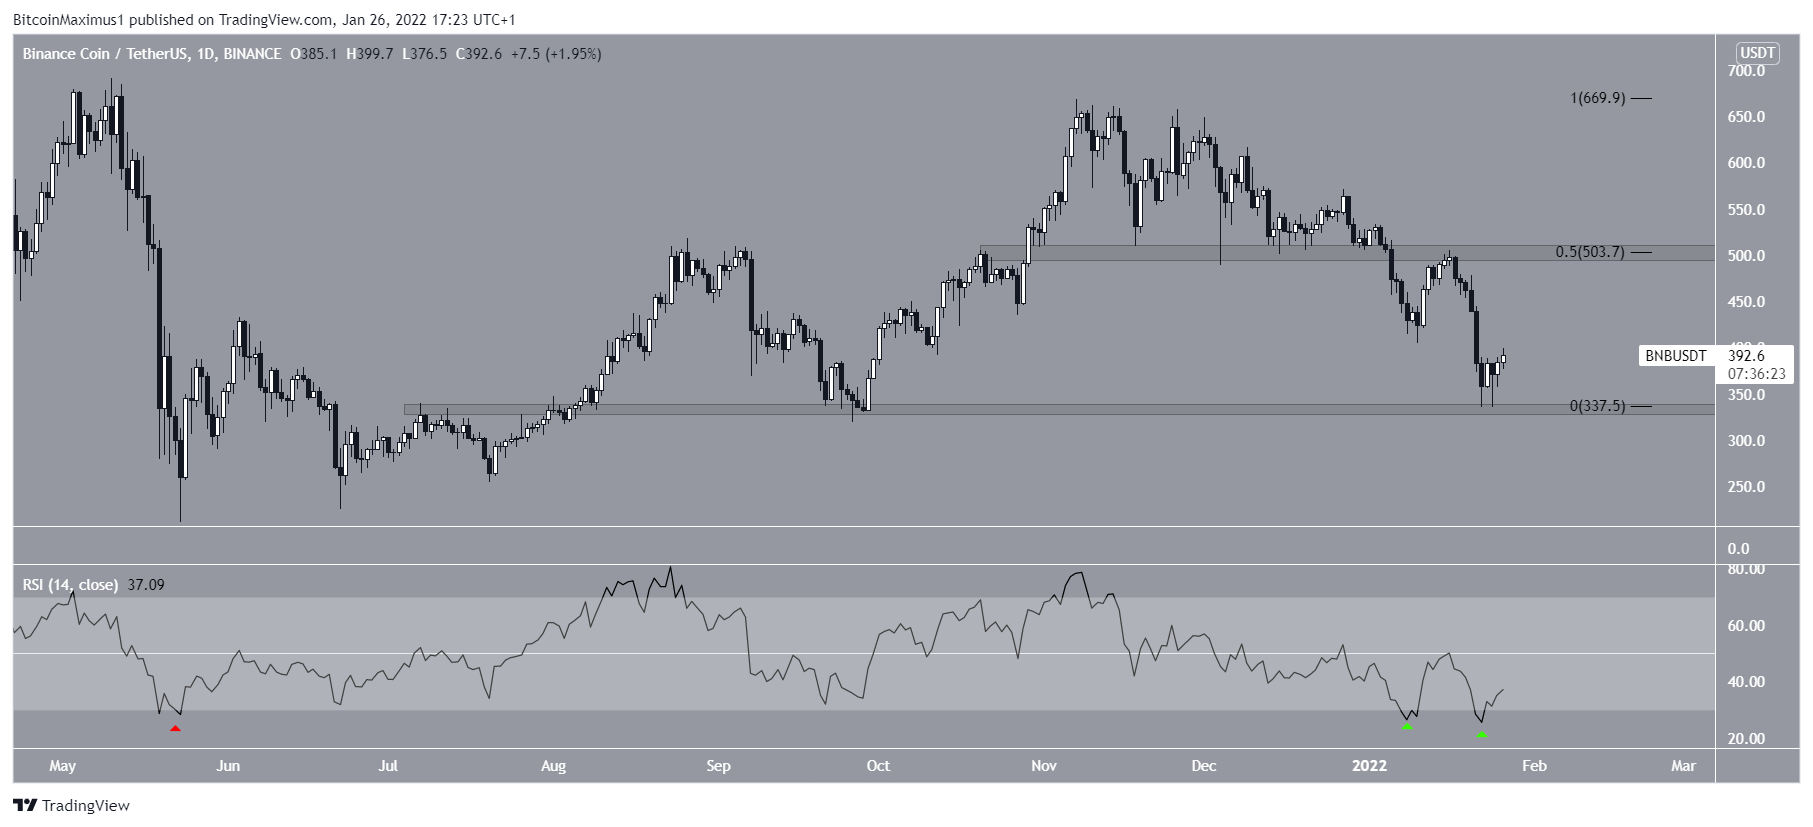
Technical indicators in the daily time frame do not yet confirm that a bullish reversal will transpire. However, the daily RSI is showing extremely oversold readings of 20. The RSI is a momentum indicator and values below 30 are often considered a sign of an oversold market.
The reading is even lower than that during the July 2021 bottom (red icon), which preceded a considerable upward move.
If BNB is able to move upwards from here, the closest resistance area would be found near $503. This is the 0.5 Fib retracement resistance level and a horizontal resistance area.
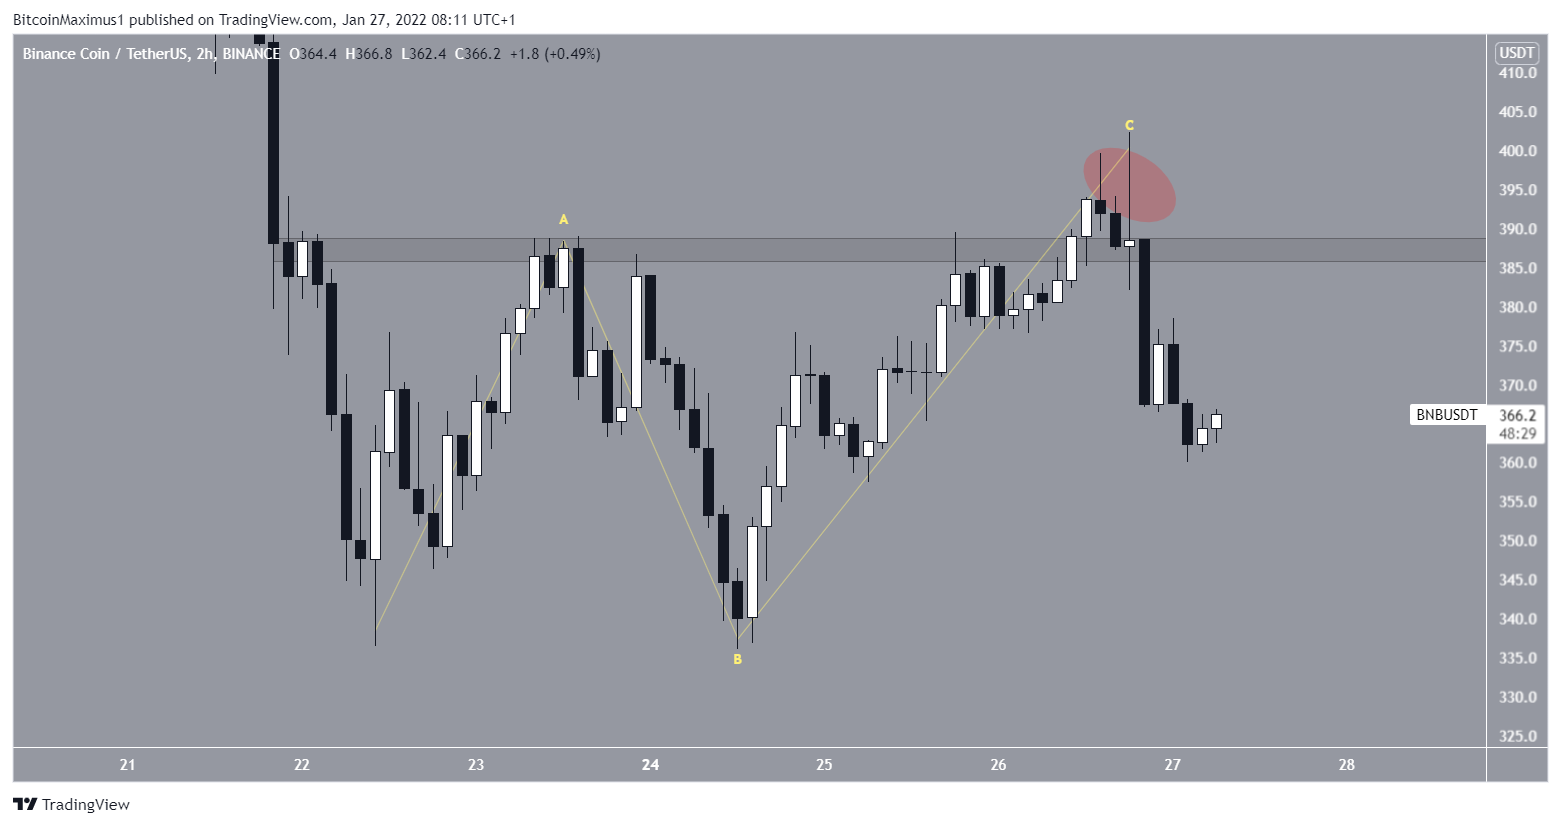
The two-hour chart shows that BNB recently deviated above the $387 resistance area (red circle) before falling back below it.
The trend since Jan 22 looks like an A-B-C corrective structure. Therefore, this time frame supports the possibility that the trend is still bearish.
Wave count analysis
The wave count is not entirely clear, but there are two main possibilities for what could happen from here.
The first suggests that the price movement since the July 2021 lows was part of a leading diagonal. In this case, the ongoing decrease since November 2021 is only a correction, and BNB will eventually move towards new highs.
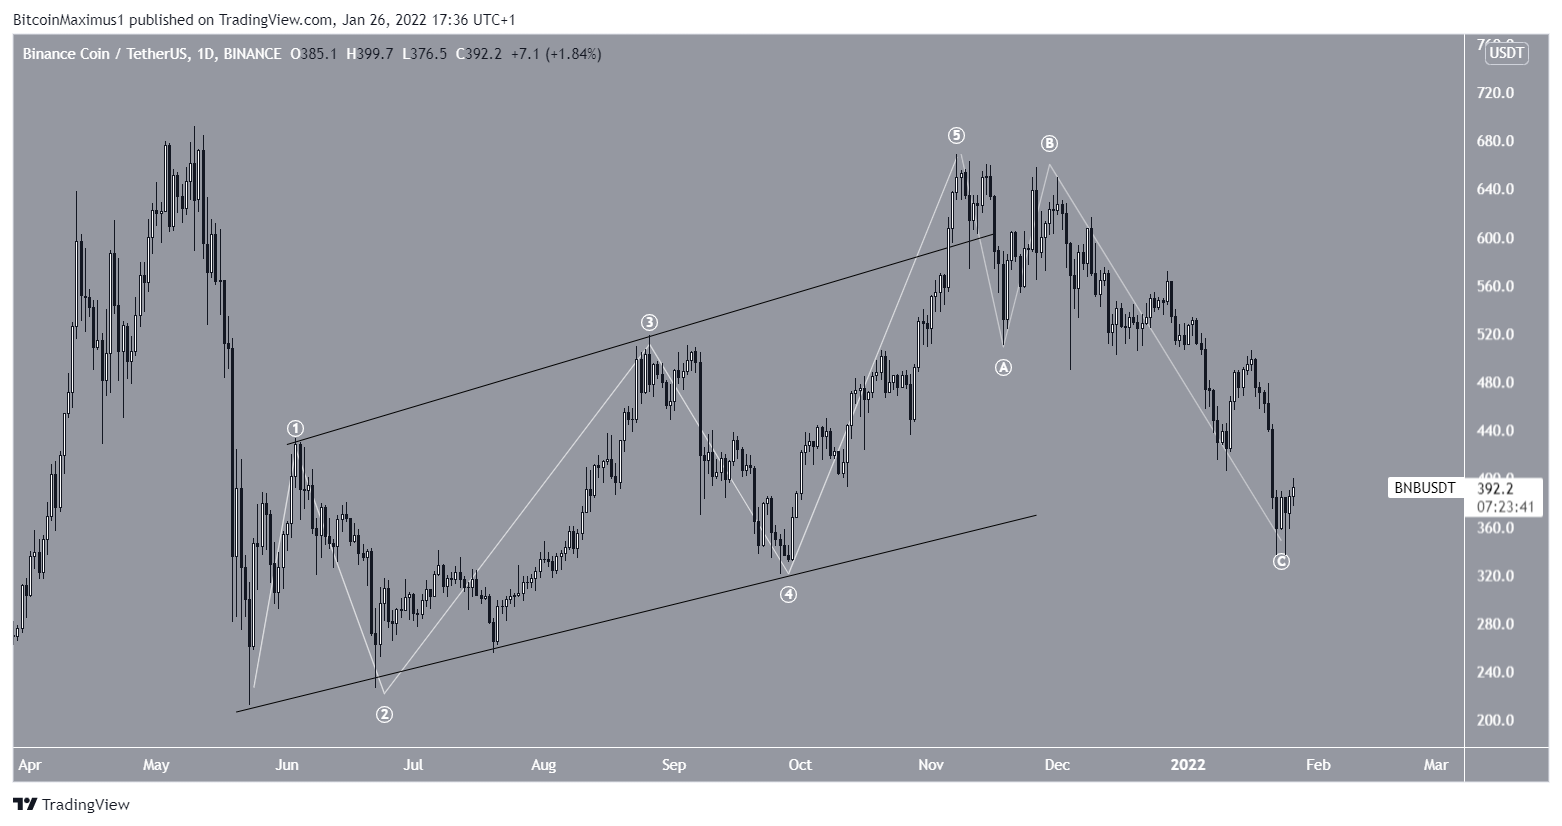
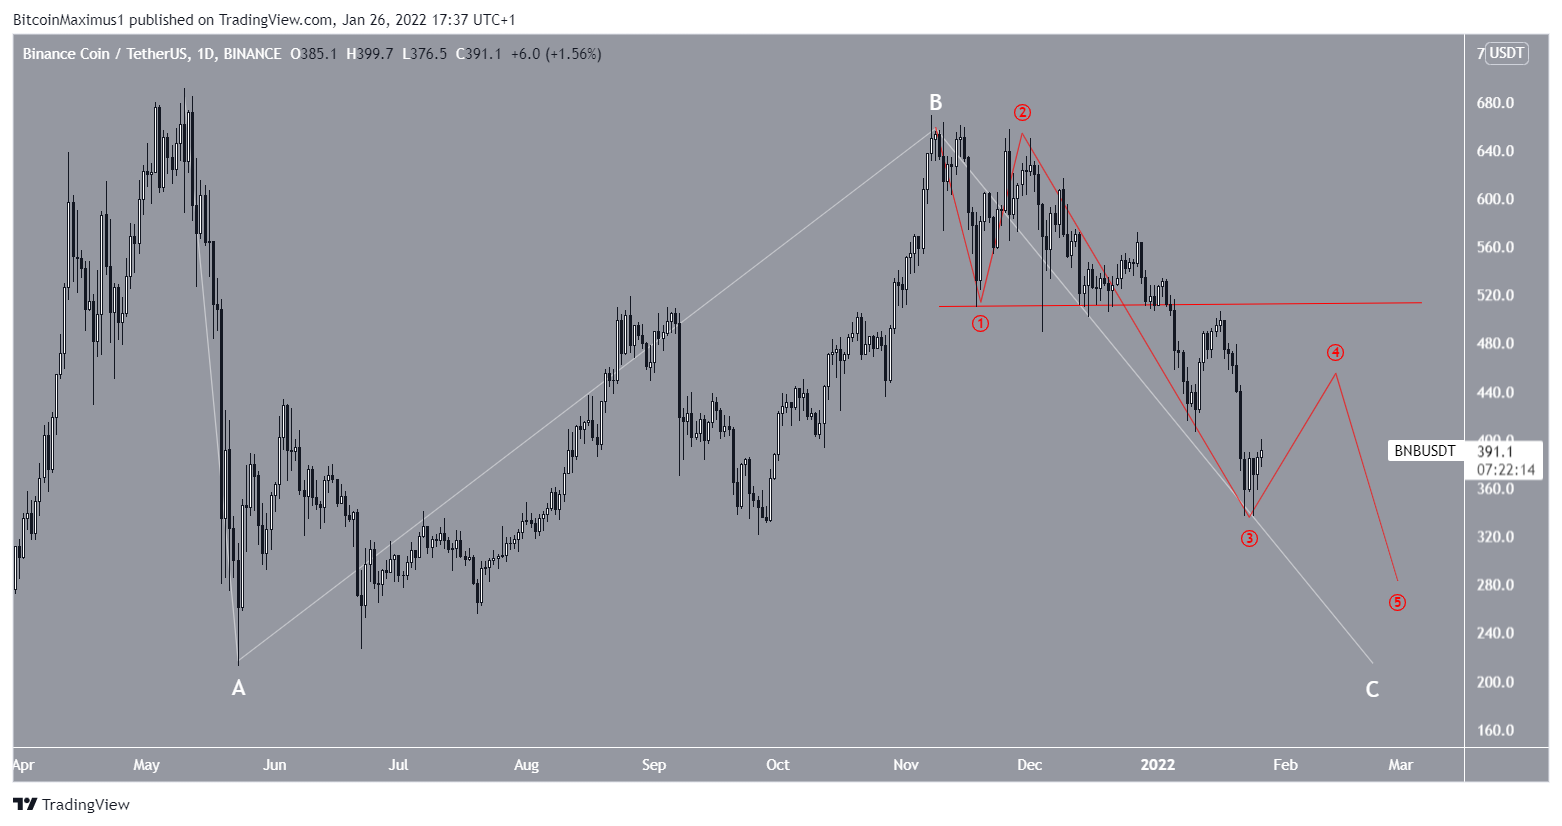
The second count suggests that the entire BNB decrease since April is part of a large A-B-C correction (white). In this scenario, BNB is completing sub-wave four (red) of a five-wave downward move, and after a bounce, it could continue falling back towards $200.
A move above the sub-wave 1 low (red line) at $510 would invalidate this particular wave count.
Since both counts indicate that a short-term increase is likely, the shape of the upward move should help in determining which of the counts will transpire.
For BeInCrypto’s latest Bitcoin (BTC) analysis, click here!
