
The Binance Coin (BNB) price has been decreasing at an accelerated rate since May 5. This decrease has caused the price to break down from the support line of its long-term range.
While a decrease from such a long-term support level often indicates that the price will continue going down, BNB has been showing signs that the breakdown might not have been legitimate. This was also noted by cryptocurrency trader @Stop_huntXBT, who tweeted a BNB chart in which it shows the price having fallen below an important support level. However, he has outlined an upward movement in the future for the BNB price.
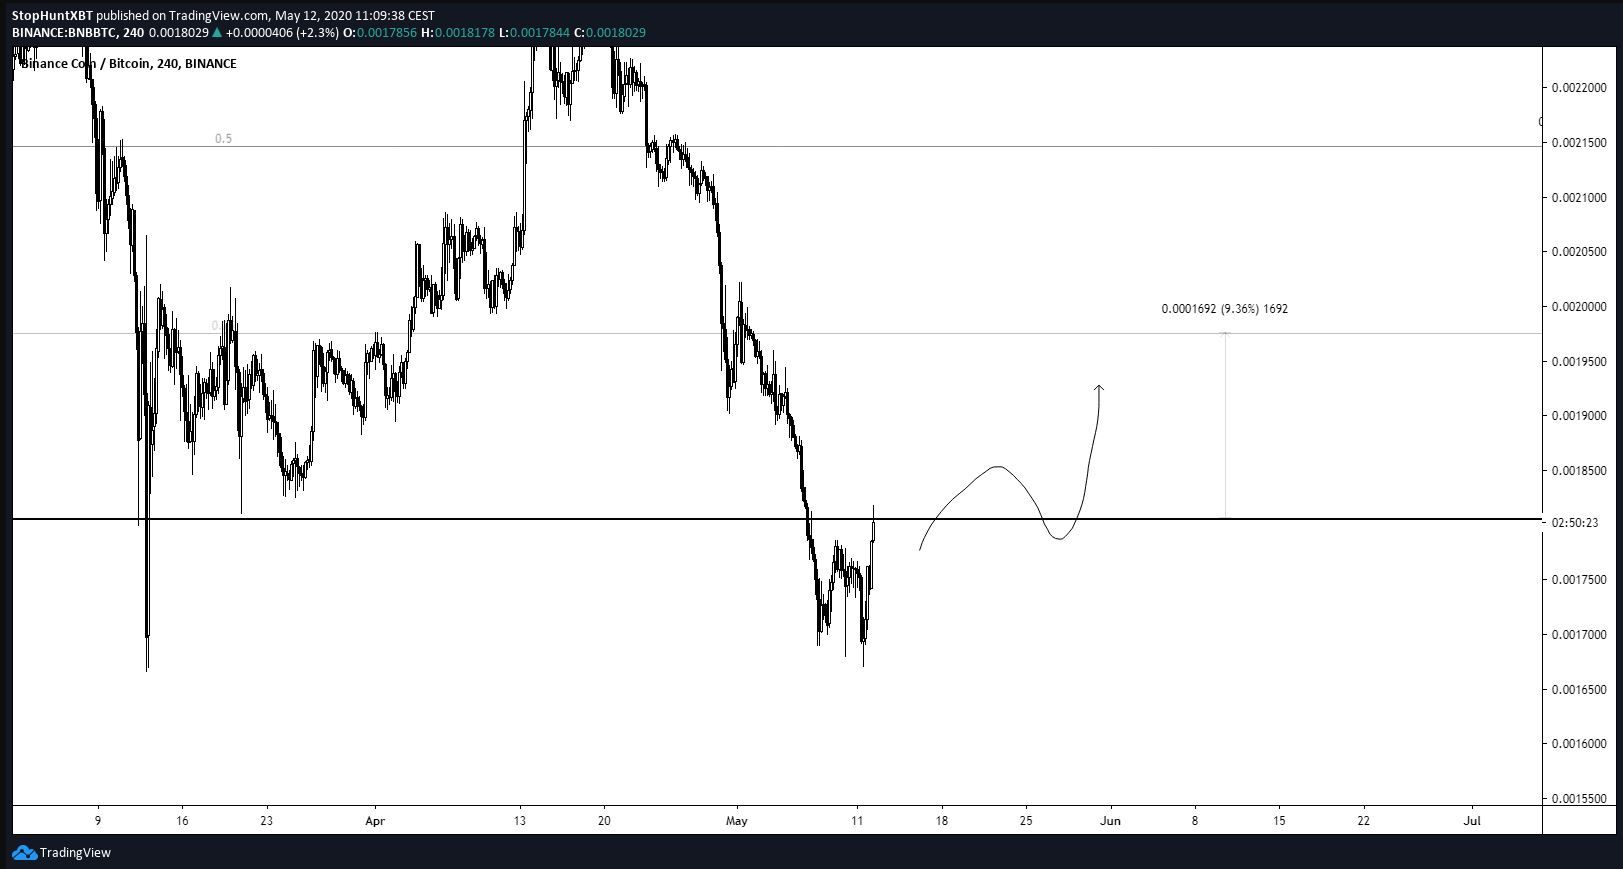
He stated that he would be interested in initiating a long if the price closes back inside the range, which would mean a close above 18,500 satoshis.
Give me a good 4H close inside the range and a retest of former range low and I’ll try.
In this article, we will take a closer look at the BNB chart and determine if the price will actually reclaim it.
Support Breakdown
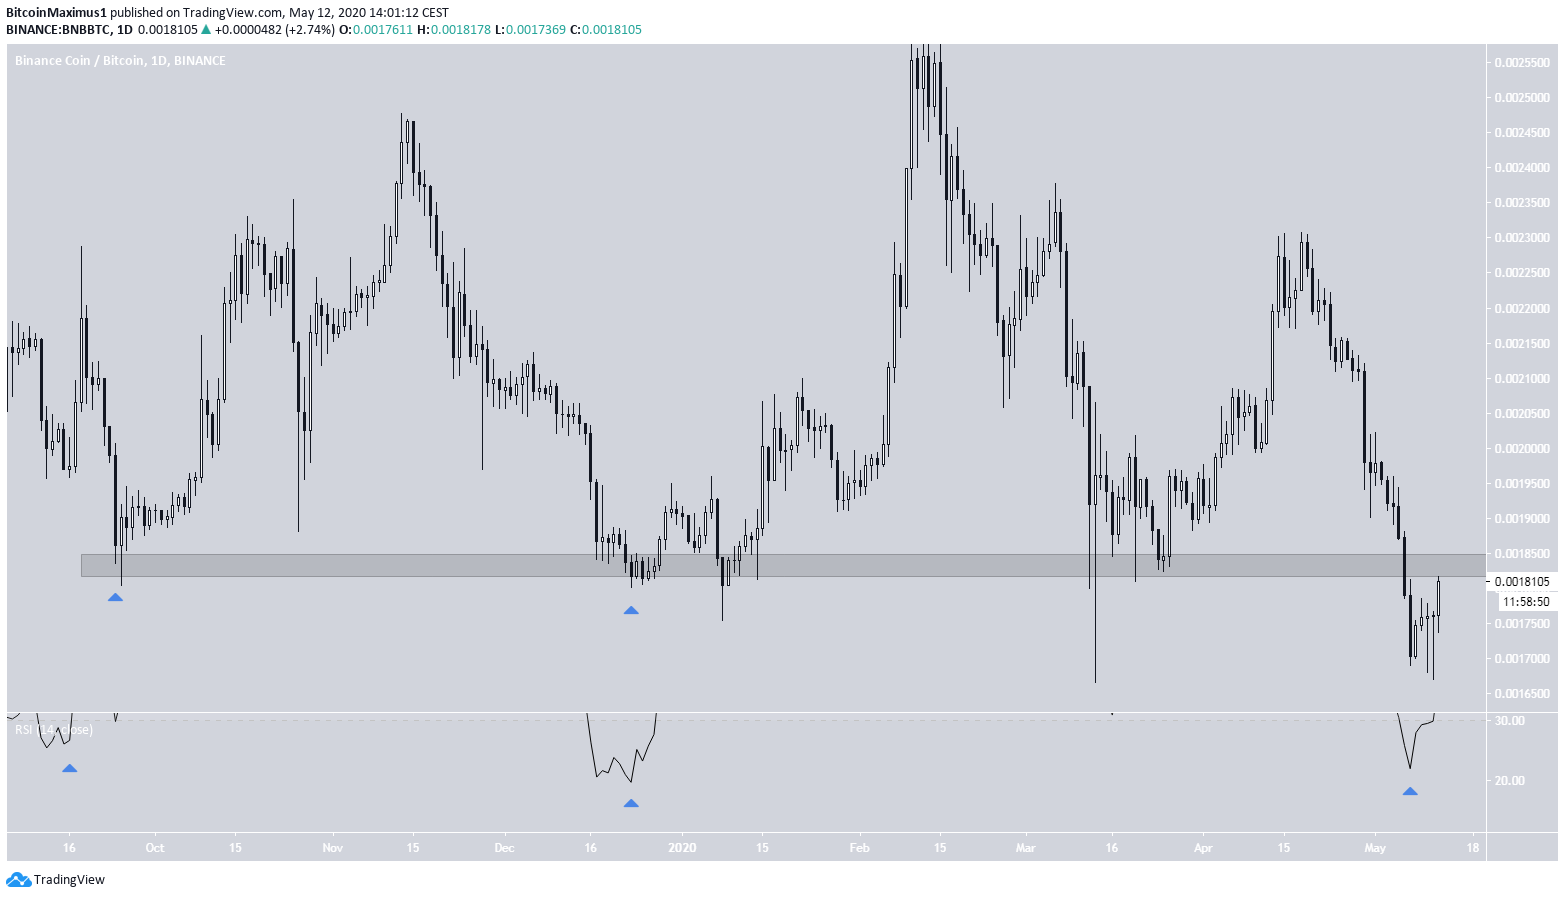
Since September 2019, the BNB price has been trading above the 18,500 satoshi support level and has initiated upward moves every time it reached this level.
However, the price broke down from this support on May 9 and is currently in the process of moving upwards towards this area once more. Whether the price reclaims this level or is rejected will likely determine the direction of the future trend.
The daily RSI is extremely oversold but has not generated bullish divergence yet. During the two previous times the RSI was this oversold, the price initiated an upward move. But the price had yet to break down below this support level, so it is not certain that the same movement will transpire now.
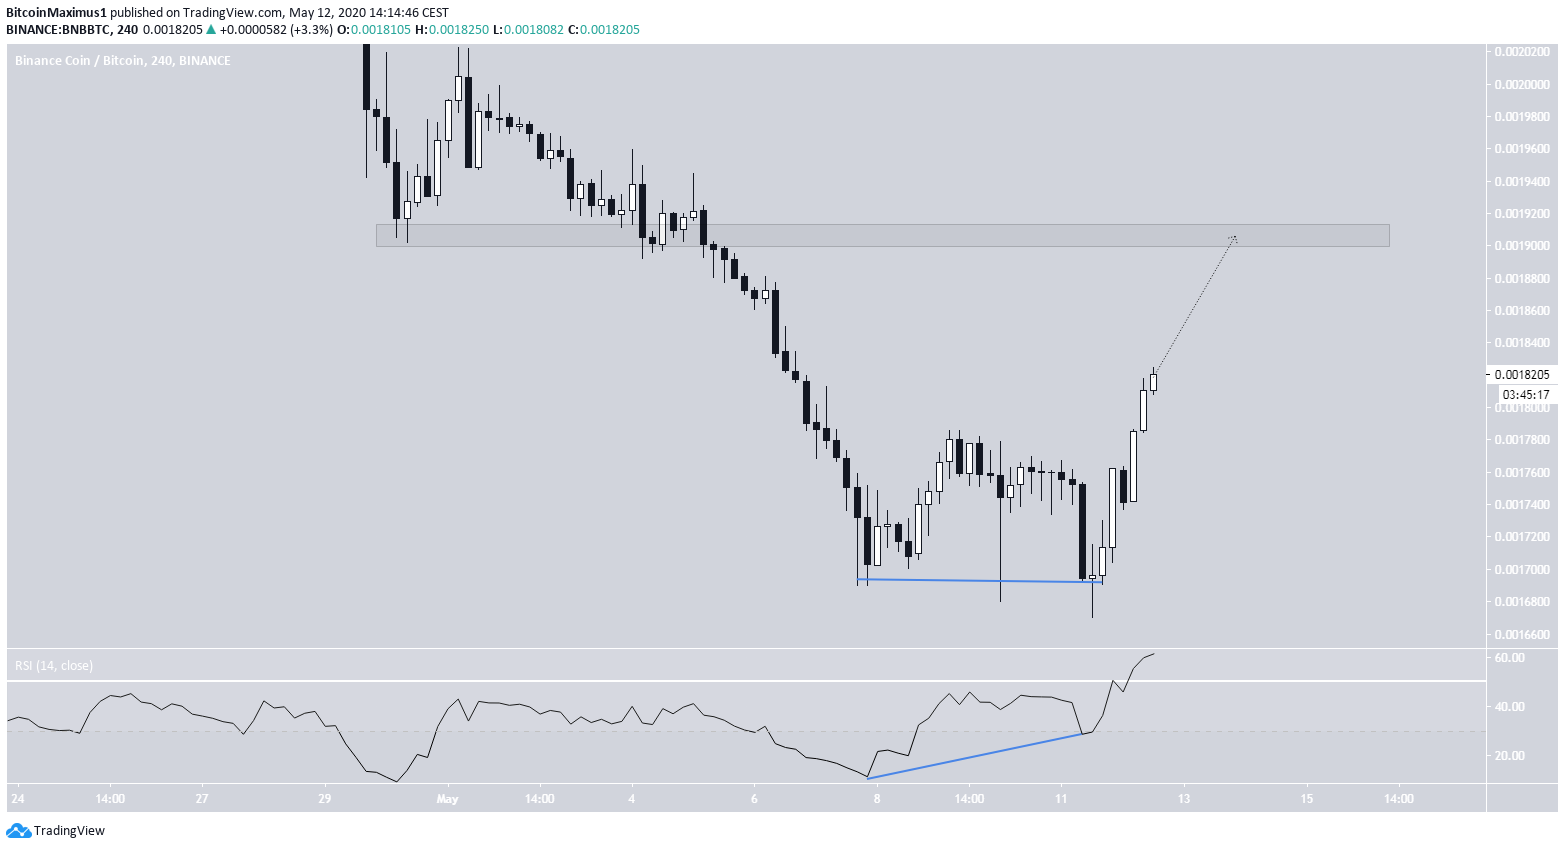
However, the short-term chart provides a bullish outlook. BNB has created a double bottom, which has been combined with bullish divergence in the RSI. Furthermore, the RSI has moved above 50, and the price has moved above the high between the two bottoms, confirming the creation of the pattern.
Long-Term Movement
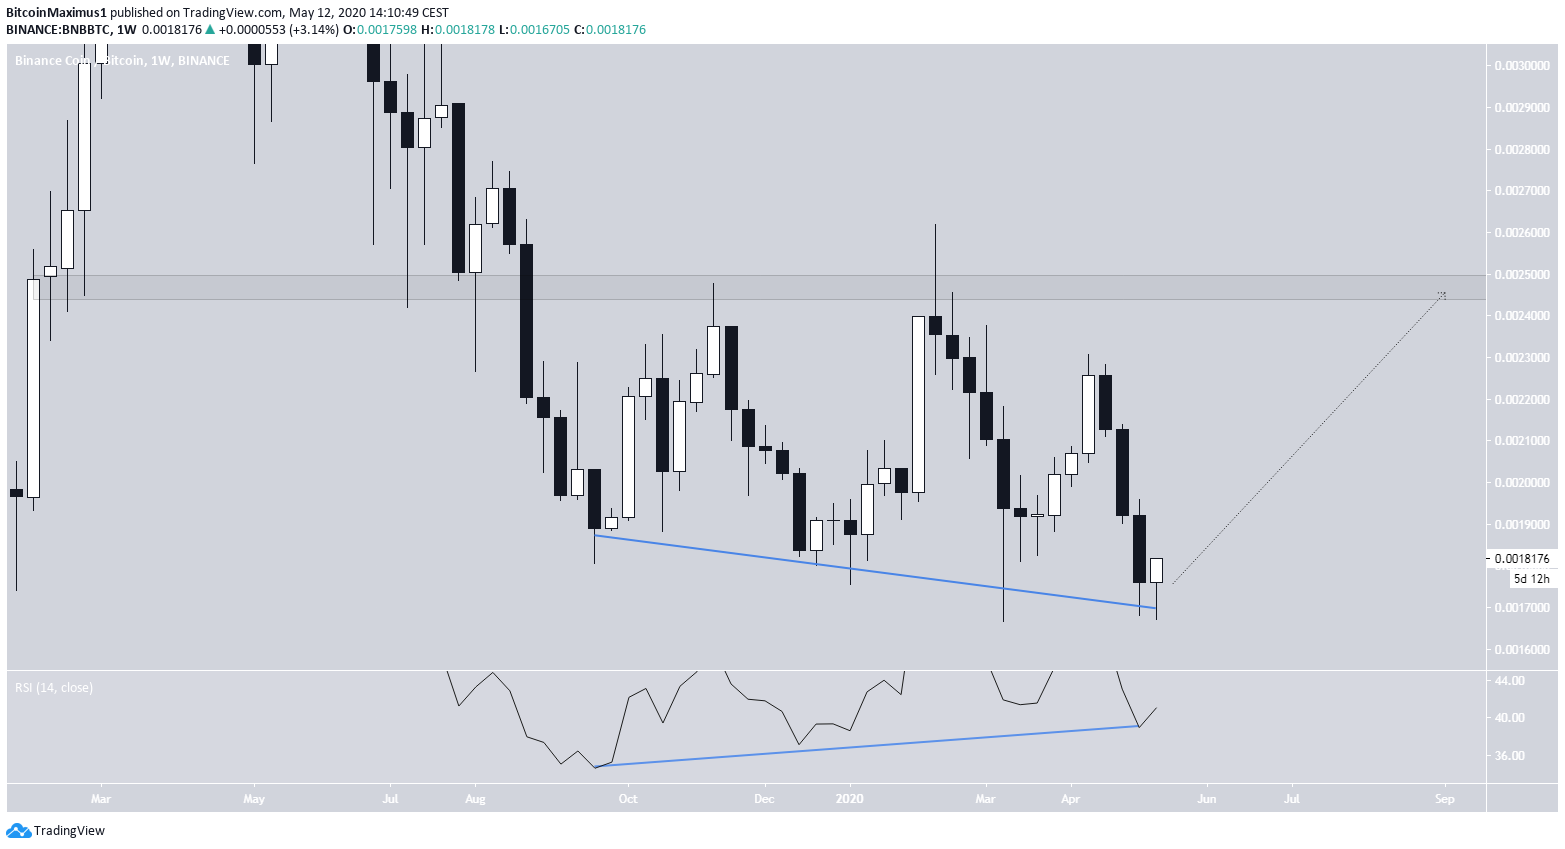
The weekly chart also aligns with the short-term one, indicating that the price is likely to reclaim the range it has just broken down from. While the price has created four lower lows, they all have been combined with bullish divergence in the weekly RSI.
Bullish divergence in such a high time-frame is uncommon and very often indicates a reversal. This belief is further solidified by the presence of several long lower wicks that signify buying pressure.
If the price reclaims this area as expected, it could move all the way to 25,000 satoshis, which is the closest resistance area.
To conclude, even though the BNB price has broken down below a significant support level, the long-term chart suggests that BNB could soon reclaim it and move upwards. Furthermore, the price has created a double bottom pattern, further solidifying the possibility that it will begin the upward move we have outlined.
