

The Binance Coin (BNB) price recently broke out above a descending resistance line in place since November 14, 2019.
A breakout above a long-term resistance line is often a sign that the price could begin an upward move. This was outlined by PoxyXBT, a well-known trader who tweeted out a BNB price chart while stating that, after the retest of the resistance line, the market outlook for BNB has turned bullish.
$BNB
— Posty (@PostyXBT) January 6, 2020
And that's why I don't force trades…
Anyway, BNB is starting to look pretty bullish again.
Nice retest of the level 👀 pic.twitter.com/0UcR0d7pzQ
Double Bottom for Binance Coin
The BNB price has been on a downward trend since April 19, 2019, when the price reached an all-time high of 48,134 satoshis. On September 25, the price fell to a low of 18,050 satoshis and began an upward move that was unsuccessful. Afterwards, the price decreased and made a double bottom on December 21. Besides being a bullish reversal pattern, the double bottom was combined with bullish divergence in the three-day RSI, which was recording oversold values. The three-day RSI has never recorded bullish divergence until now. However, it was oversold in the beginning of December 2018, prior to initiating an upward move of 260 percent and reaching the aforementioned all-time high. However, the price is not at a significant support area, the closest one being at 15,000 satoshis. All things considered, the long-term outlook for BNB suggests that a bullish reversal might begin soon.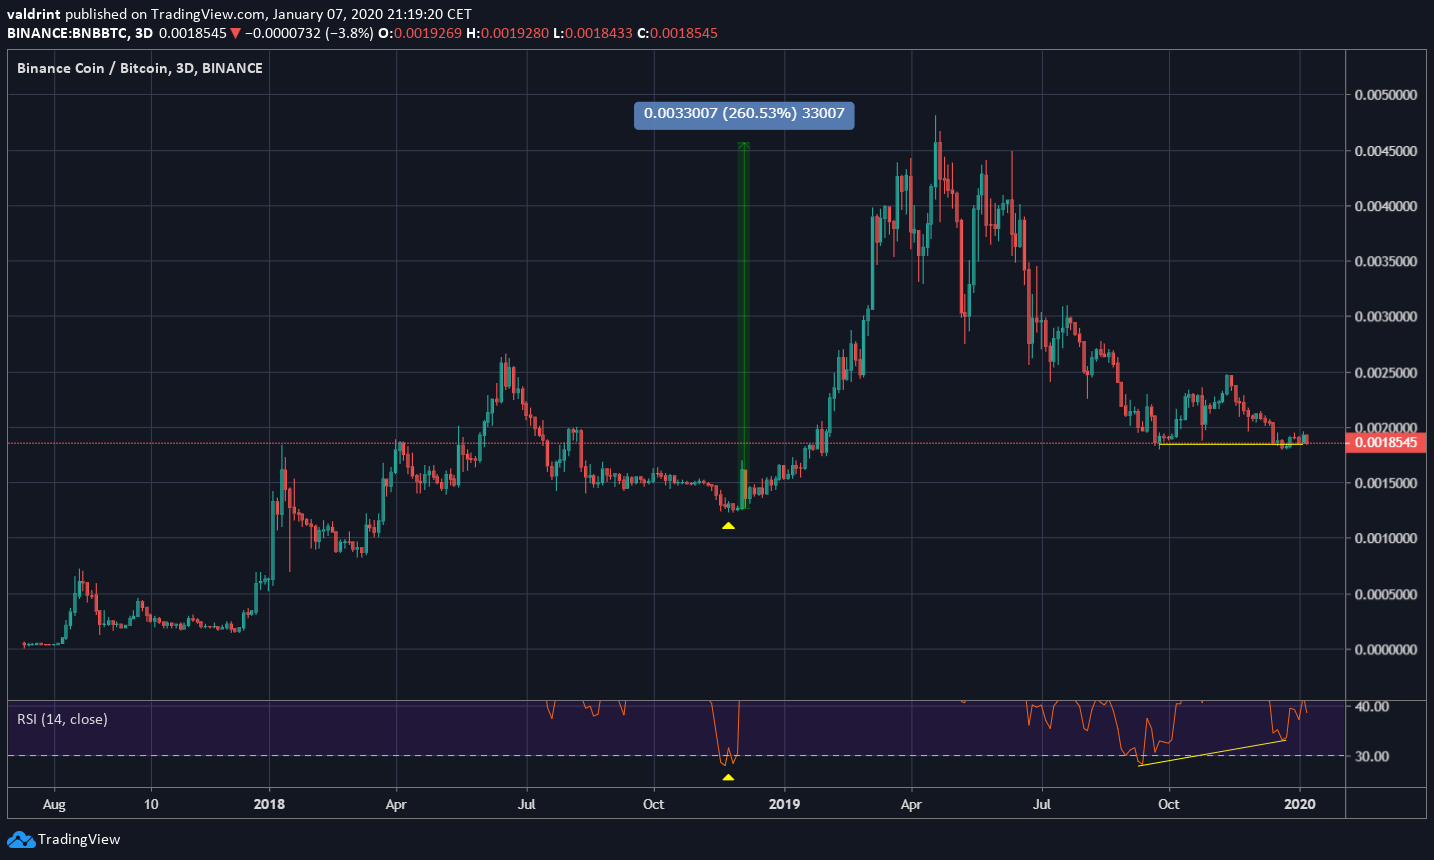
Current Breakout
The BNB price broke out above a descending resistance line on December 29. However, the price failed to even retest the previous support level of 20,000 satoshis. Rather, the price created two long upper wicks at 19,500 satoshis and is currently in the process of creating a daily bearish engulfing candlestick. In addition, the price is trading below the 50- and 100-day moving averages (MAs), which have made a bearish cross and are offering very close resistance to the price. The daily outlook is bearish and negates some of the positive signs from the long-term outlook. What seemed like a double bottom looks more like a full retracement after a failed upward move, which is a bearish development.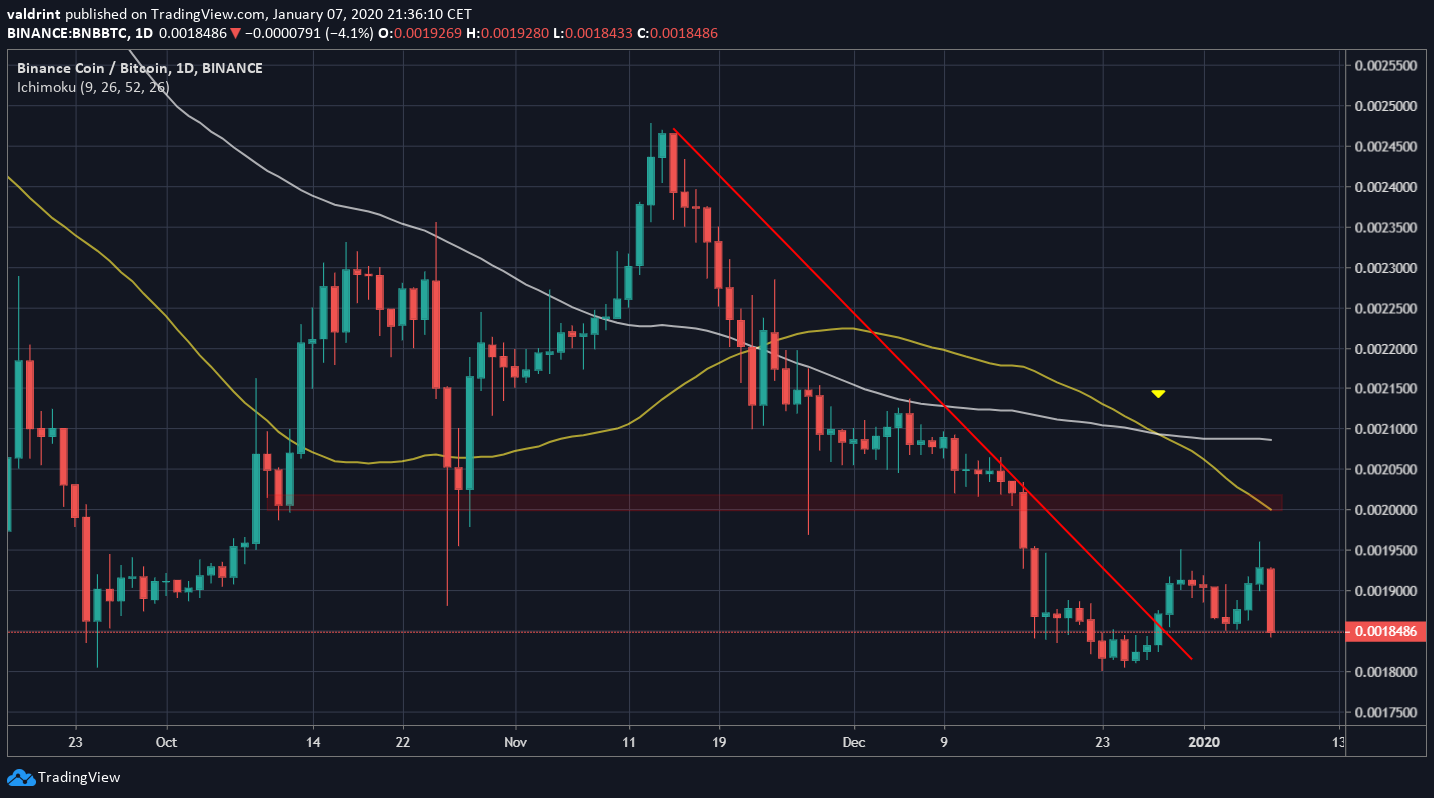 The short-term bearishness is even more pronounced in lower time-frames. The double top with long upper wicks was combined with bearish divergence in the RSI. A price close below the red line would confirm the pattern and indicate that the BNB price is heading lower.
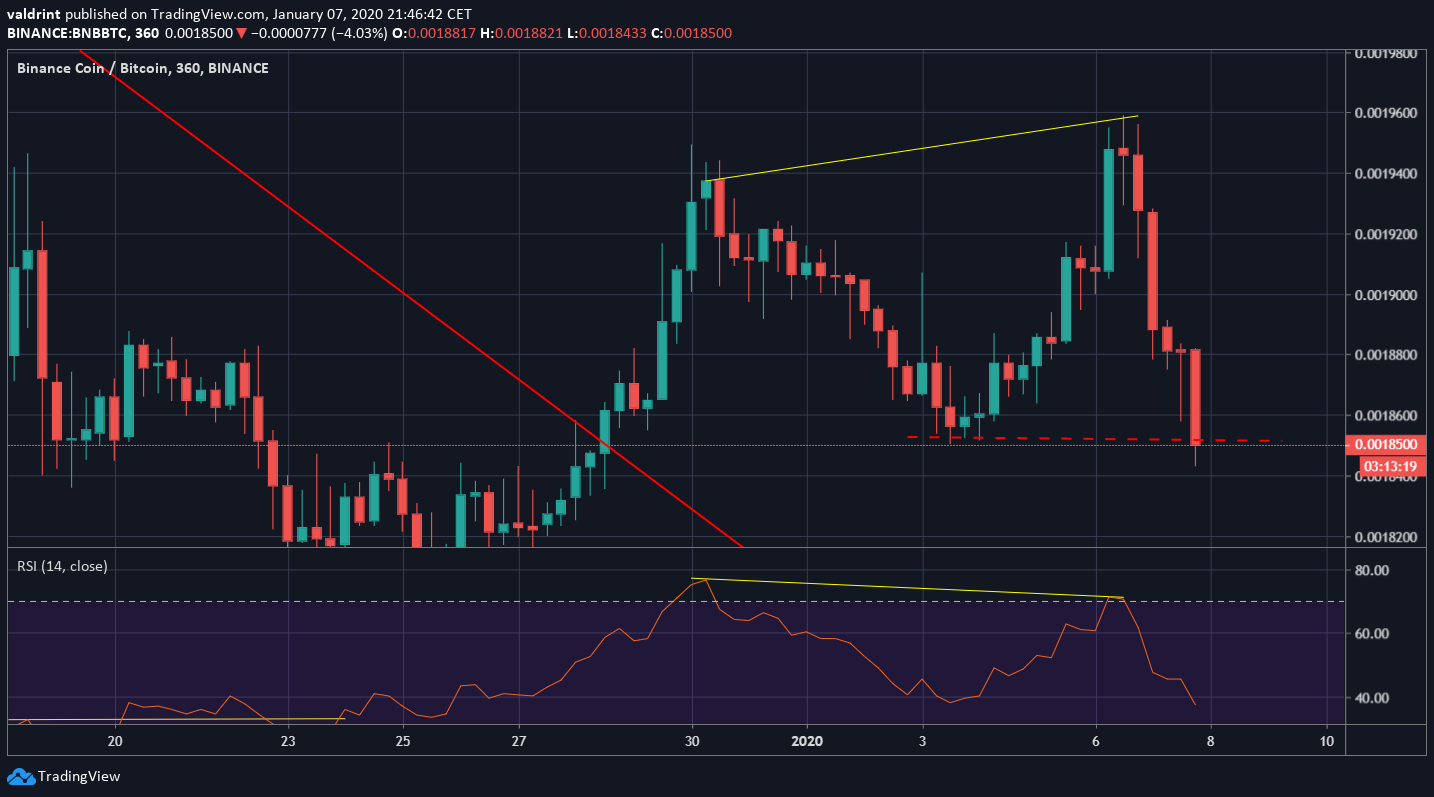
 To conclude, the long-term outlook for BNB reveals a possible reversal, but lower time-frames suggest that the price will likely fail to initiate one. The 18,000 satoshi support level can be used as a gauge for the future outlook, since the bullish possibility remains intact as long as the price is trading above this level. Therefore, this makes it a very suitable level to place a stop loss. A price decrease below it would likely cause the price to reach 15,000 satoshis.
Top crypto platforms in the US
Disclaimer
In line with the Trust Project guidelines, this price analysis article is for informational purposes only and should not be considered financial or investment advice. BeInCrypto is committed to accurate, unbiased reporting, but market conditions are subject to change without notice. Always conduct your own research and consult with a professional before making any financial decisions. Please note that our Terms and Conditions, Privacy Policy, and Disclaimers have been updated.

Valdrin Tahiri
Valdrin discovered cryptocurrencies while he was getting his MSc in Financial Markets from the Barcelona School of Economics. Shortly after graduating, he began writing for several different cryptocurrency related websites as a freelancer before eventually taking on the role of BeInCrypto's Senior Analyst.
(I do not have a discord and will not contact you first there. Beware of scammers)
READ FULL BIO
Sponsored
Sponsored