The Binance Coin (BNB) price has broken out from a long-term resistance area. If the price successfully moves above $24, it is likely to accelerate its rate of increase.
Breakout From Long-Term Resistance
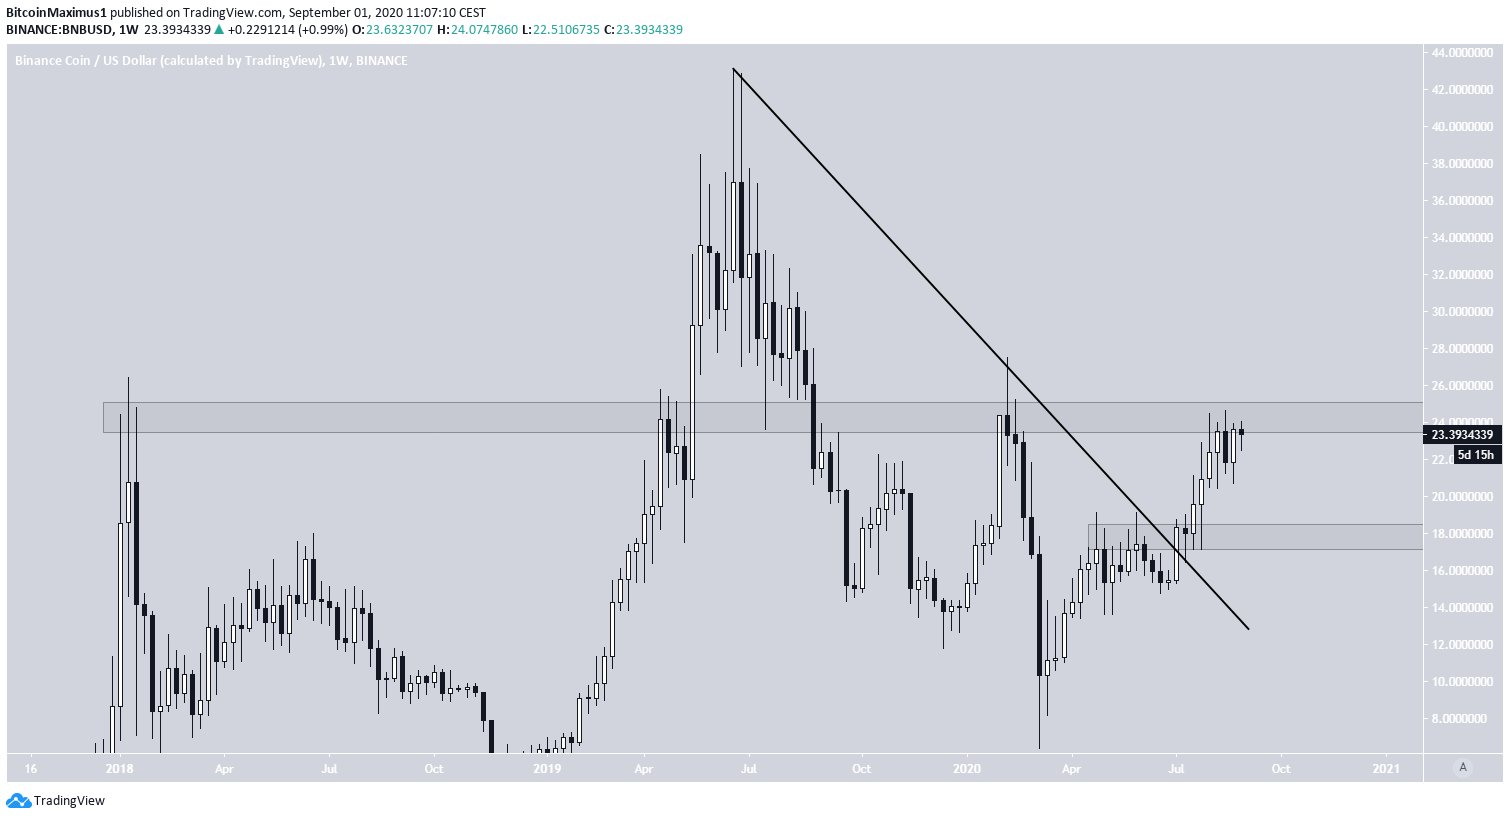
The BNB price had been following a descending resistance line since June 2019, when the price reached a high of $41.15. The price has been increasing since but has just reached the $24 area, which historically acted as resistance.
A breakout above this level could take the price towards the previous highs near $41.15. Conversely, the closest support area is found all the way at $18.
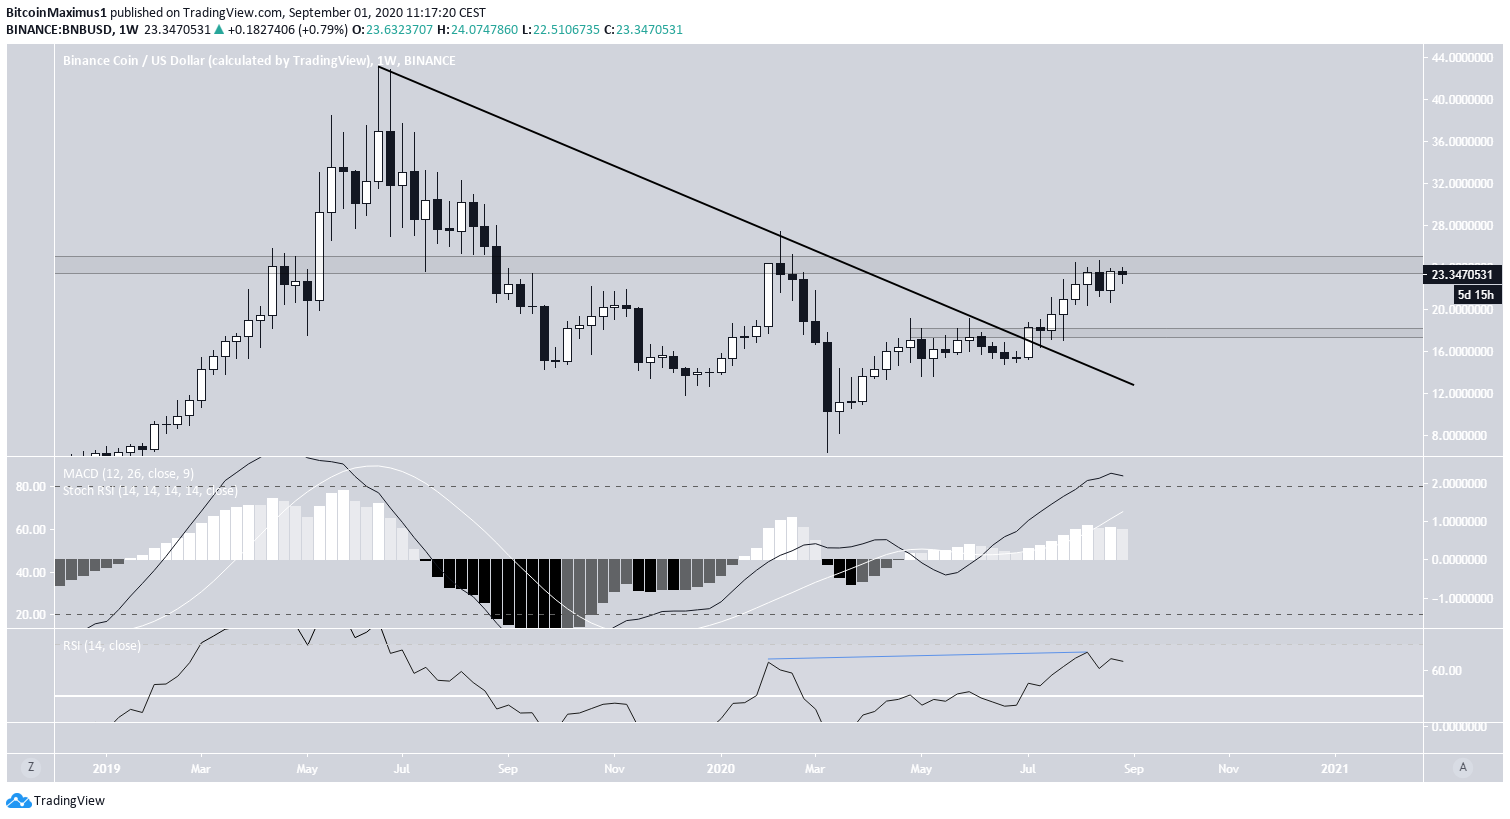
Technical indicators are cautiously bullish. While the RSI is above 50 and increasing, it has formed a slightly hidden bearish divergence. Similarly, the Stochastic RSI is increasing but has reached overbought levels.
The MACD has begun to fall but rejected a bearish reversal signal.
In addition, the price is trading inside a long-term resistance area. Therefore, we cannot state with certainty that it will break out before retracing towards support.
BNB’s Daily Time-Frame is Bullish
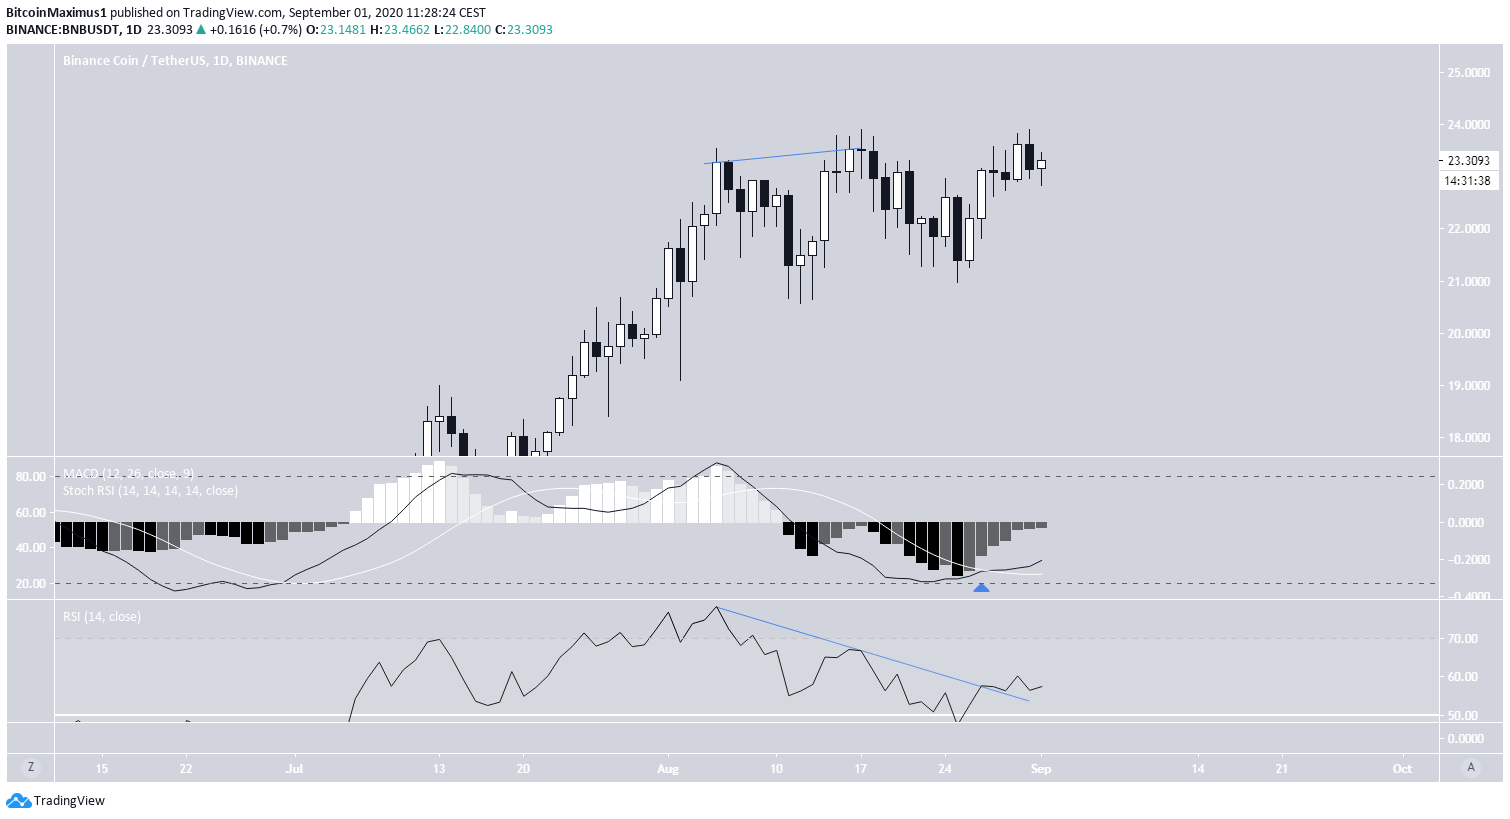
The daily time-frame shows a double top pattern that was completed throughout August 2 – 20. The double top was combined with bearish divergence on the RSI. After the ensuing drop, the price initiated another upward move that is still ongoing.
Since then, the RSI has broken its bearish divergence trend-line and the MACD has given a bullish reversal signal. Furthermore, the stochastic RSI has made a bullish cross.
All these are signs that the price is likely to move upwards and break through the previous $24 resistance area.
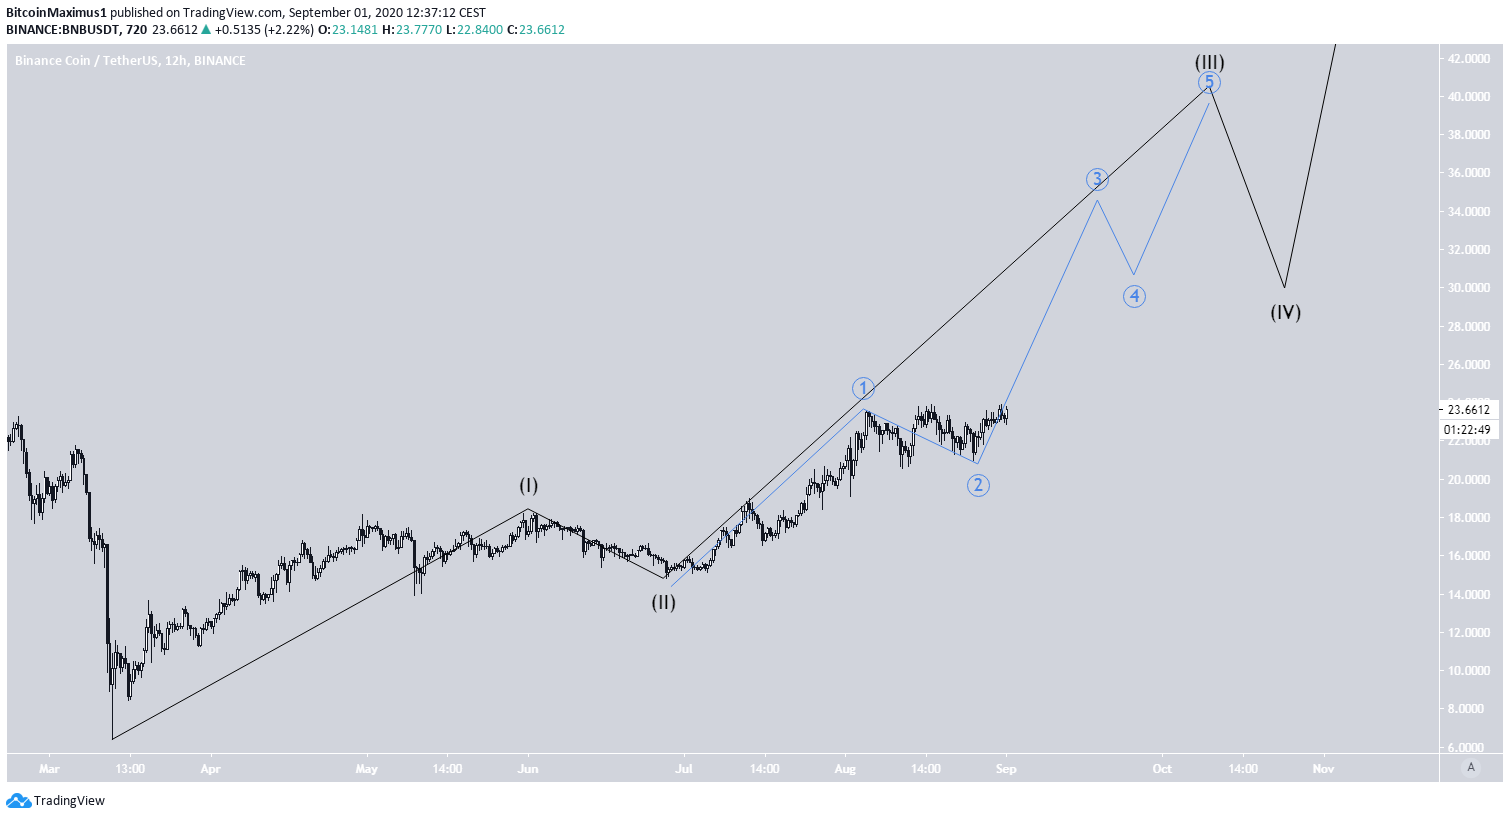
Beginning on March 13, the BNB price has likely begun a five-wave impulsive formation to the upside (shown in black below), in which it is currently in the third wave. The third wave has extended, developing in five sub-waves (in blue below).
The entire formation should take the price towards the June 2019 highs near $40.
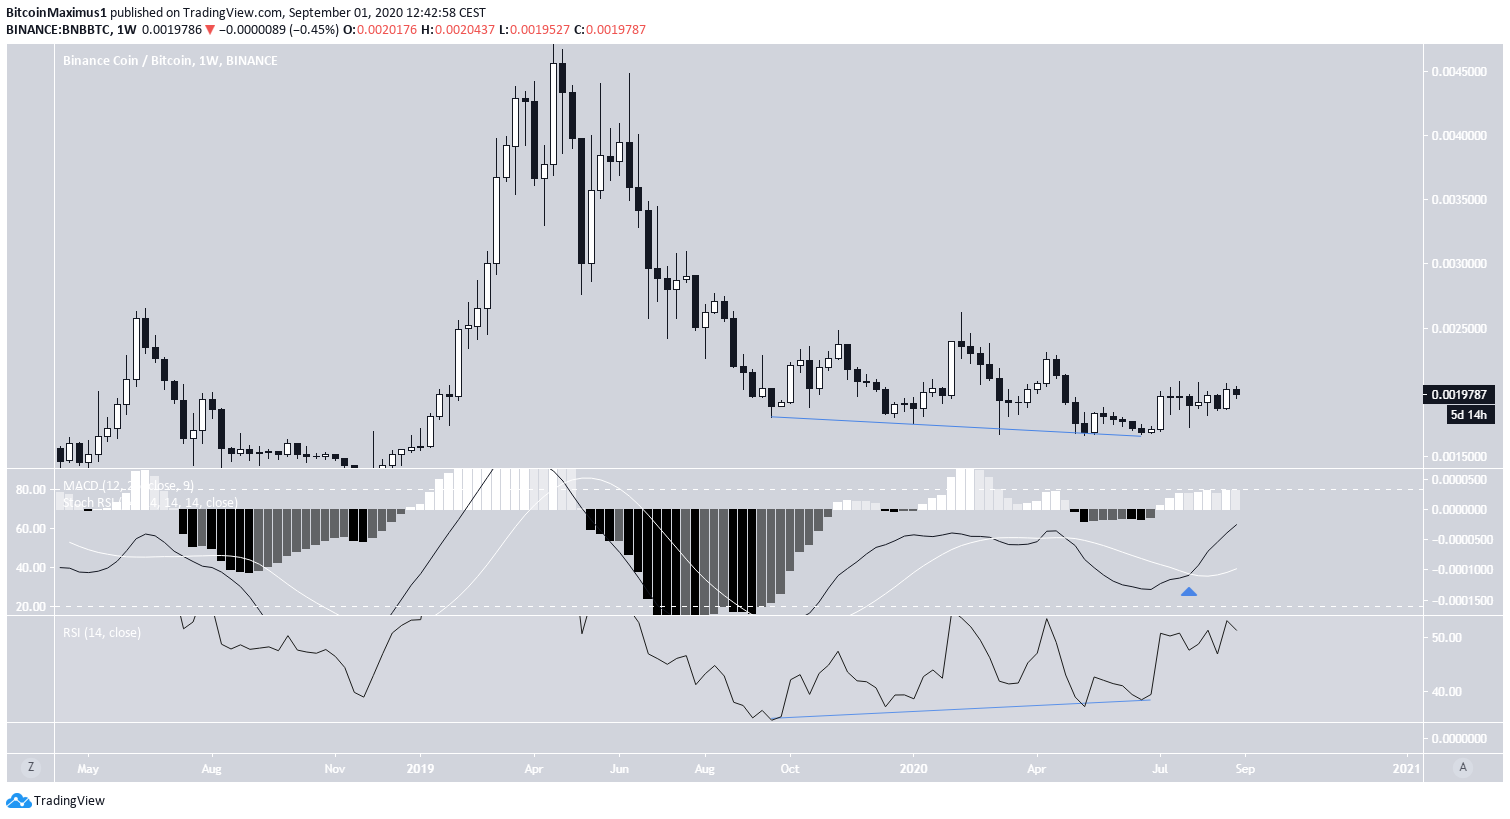
BNB/BTC
Cryptocurrency trader @CryptoMichNL stated that the BNB price looks good for continuation, giving a target of ₿0.0023 for the upcoming move.
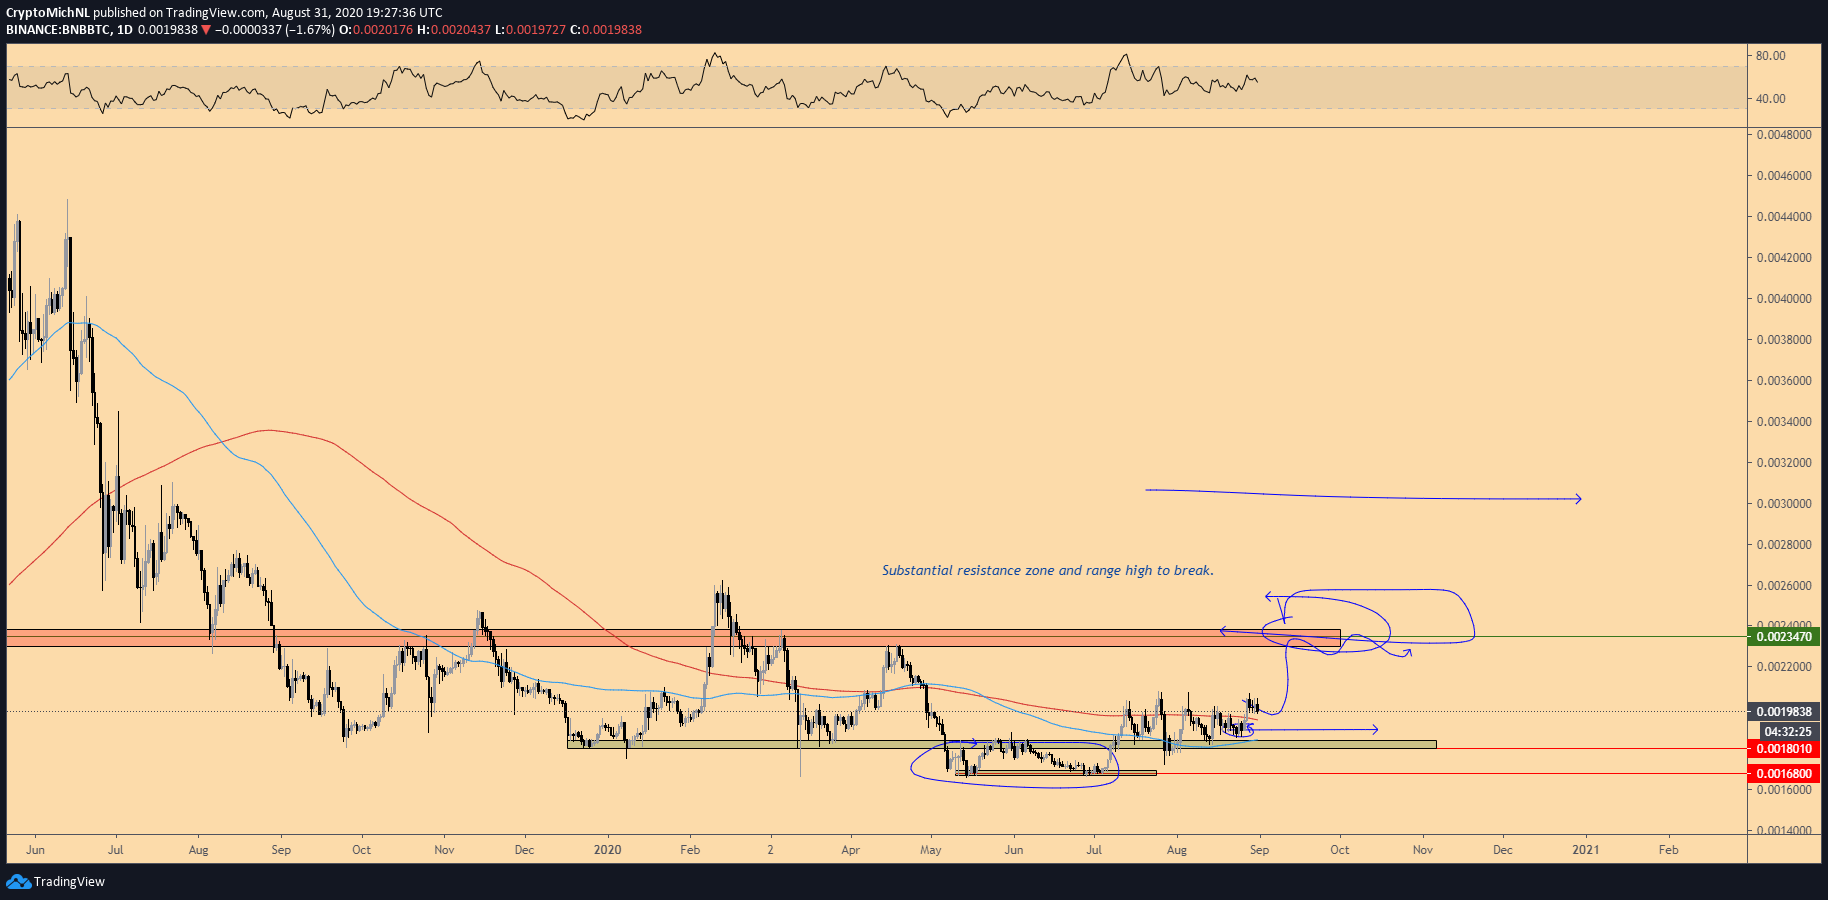
Indeed, the weekly chart for BNB/BTC shows significant bullish divergence in both the weekly RSI and the MACD. Furthermore, the Stochastic RSI has made a bullish cross.
These are all signs that the price is likely to move towards the next resistance areas at ₿0.0023 and possibly ₿0.0035.