


On Apr 23, 2019, the price made high of $5.46 and €4.84. A sharp drop ensued and on Apr 26 the price made lows of $4.4 and €4.07.
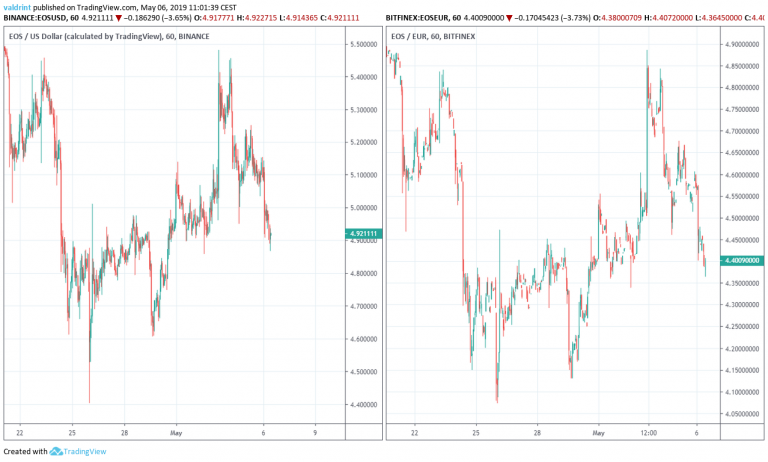
It has been increasing since, reaching highs above $5.4 and €4.8 on May 4.
Where will it go next?
Let’s find out!
EOS: Trends And Highlights For May 2, 2019
- The price has been increasing since Apr 26.
- It is trading inside an ascending triangle.
- It is trading inside a longer-term ascending channel.
- The moving averages have made a bullish cross.
- There is resistance near $5.1 and €4.6.
Tracing the Current Trading Pattern
The price of EOS/USD on Binance was analyzed at one-hour intervals from Apr 20 to May 2 to trace the current trading pattern. We do not include euros in this section because only one trading pair is needed to accomplish this. Both EOS/USD and EOS/EUR are discussed in the final section.
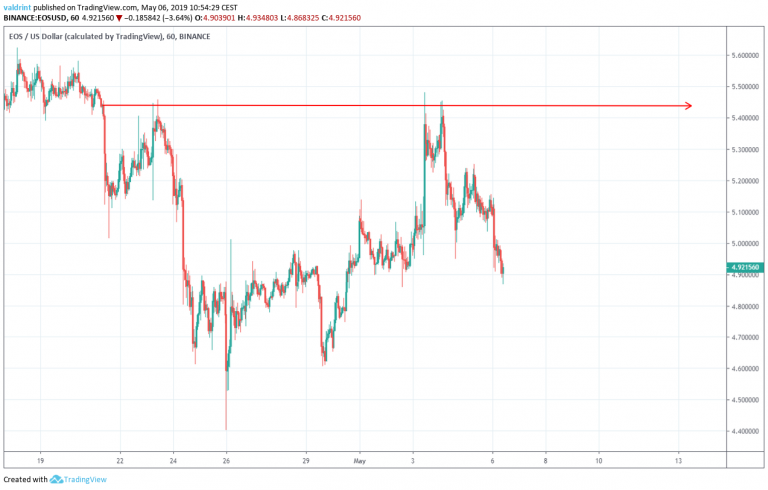
On Apr 23, the price made a high of $5.45. A sharp drop was followed by a gradual increase. The price has reached the same level three times.
Tracing these highs gives us a horizontal resistance line:
On Apr 26, the price made a low of $4.40. A gradual increase ensued and the price reached several higher lows.
Tracing these lows gives us an ascending support line.
The support and resistance lines combine to create an ascending triangle:
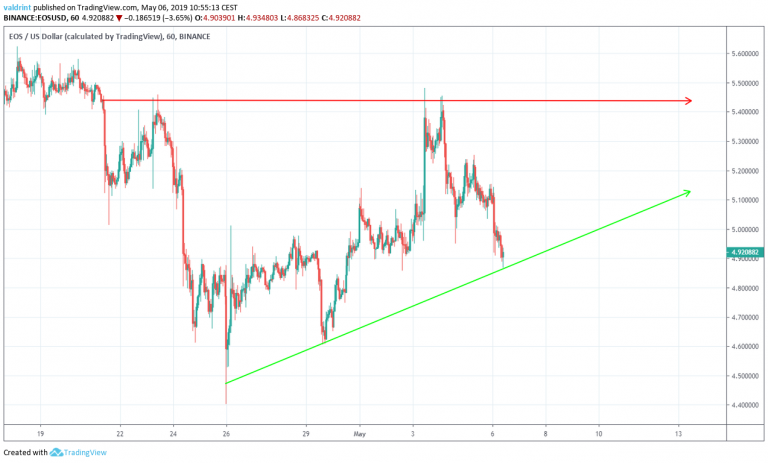
It is likely that the price will continue to trade inside the confines of this triangle until a decisive move occurs.
In order to figure out where will it go next, a look at technical indicators in a longer time-frame is required.
Technical Indicators
In this section, we incorporate moving averages (MAs) into this section of the analysis. The 100-(black) and 200-day (blue) MAs are traced in the graph below:
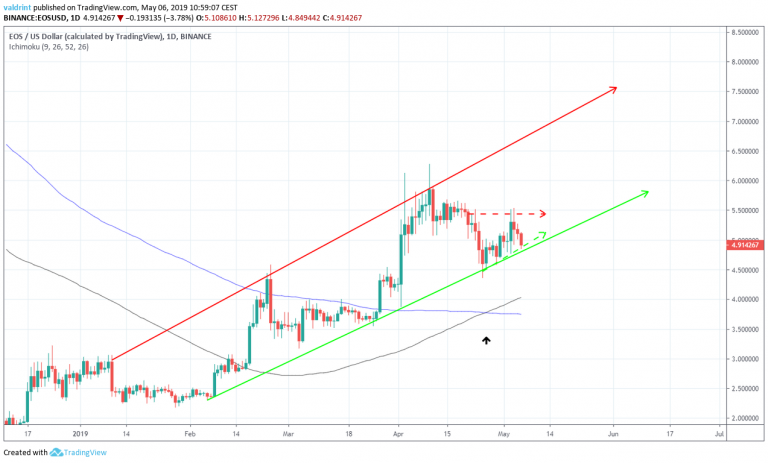
The price has been trading inside an ascending channel since January 10th. It is currently trading very close to the support line of the channel.
A breakdown from the triangle outlined in the previous section would mean that the price would also mean a break down from the longer-term ascending channel outline in the graph above.
However, on Apr 27, the 100-day MA crossed above the 200-day one. This is known as a bullish cross and often indicates that the price has begun an uptrend. Thus, a breakdown below the support line of these two trading patterns appears unlikely.
On the contrary, the MAs suggest that the price will increase towards the resistance line of the triangle.
Future Movement
In this section, we incorporate resistance areas into the analysis to determine possible future price levels in the case price breaks down from the triangle.
One support area is shown for EOS/EUR (first graph) and another for EOS/USD (second graph) below:

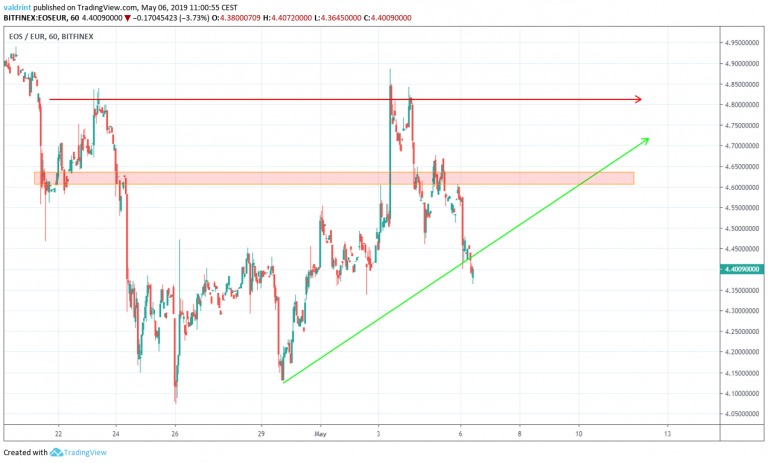
The closest resistance area is found near $5.1 and €4.6 We believe that it is likely that the price will reach this area.
Summary of Analysis
Based on our analysis, it is likely that the price will increase towards the resistance line of the triangle. Before it gets there, it should find resistance in the area outlined above.
Do you think the price of EOS will reach the resistance area? Let us know your thoughts in the comments below!


