
The year 2020 has brought considerable increases to a number of well- and lesser-known cryptocurrencies. Bitcoin (BTC) reached a new all-time high on Dec. 1, while several smaller altcoins reached their all-time highs in August.
The year 2020 has been a very compelling year for traders who are active in the cryptocurrency world. It began with relatively stable movement in the form of a gradual increase. This served to create a bullish bias, since BTC made several attempts at moving above the 2019 highs at $13,880.
However, this was not a sign of things to come, since everything changed in the beginning of March. Potentially fueled by negative news from the fallout due to the coronavirus pandemic, BTC crashed considerably alongside the rest of the market.
The image below shows the price of the S&P 500 (orange), BTC (green) and oil (blue) in March, a month in which their values evaporated by 37 per cent, 54 per cent and 57 per cent, respectively.
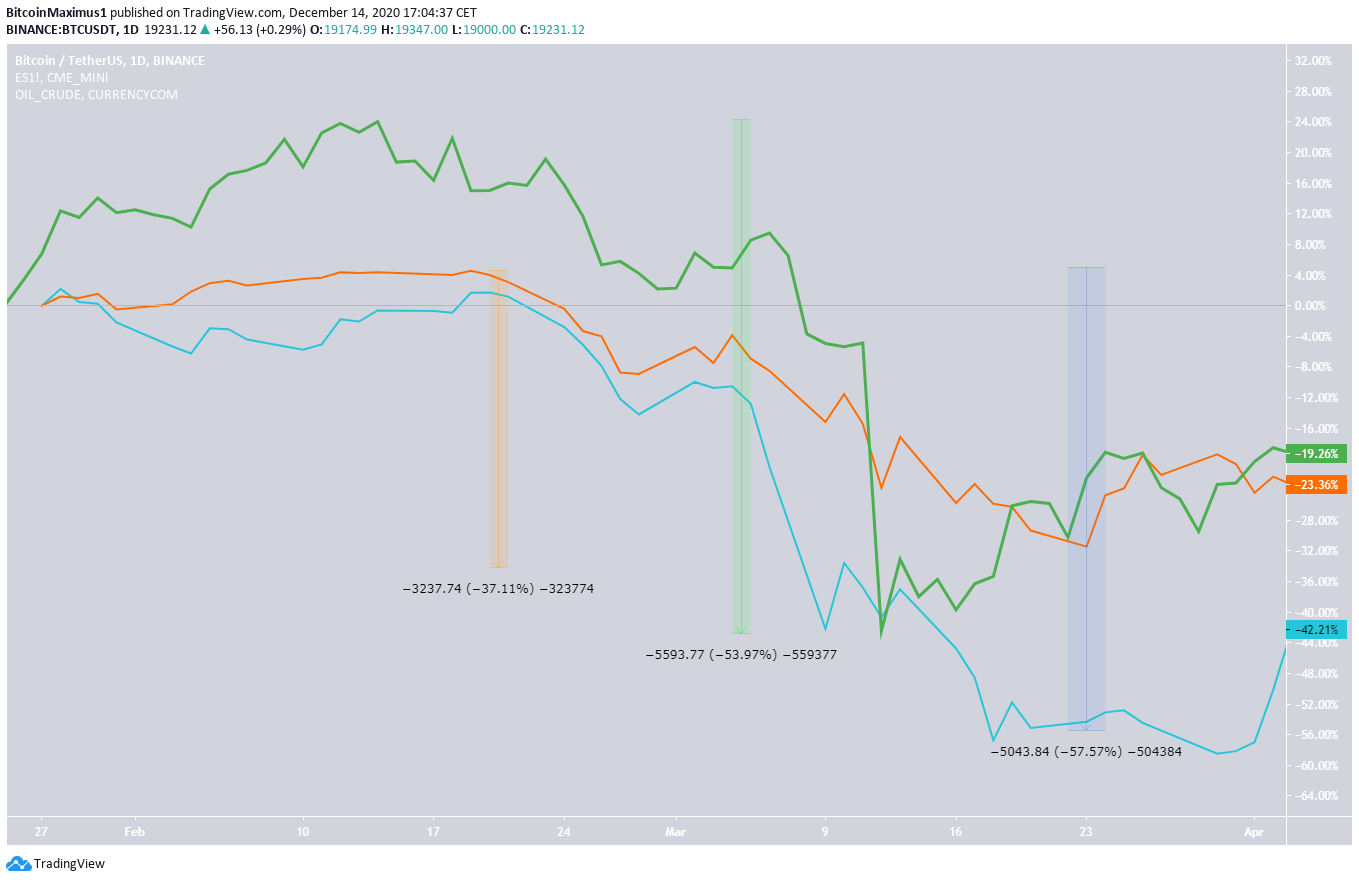
On March 12, BTC decreased by 39 per cent in a day, the largest percentage decrease in history. BTC reached a yearly low of $3,850, the next day. Interestingly, that is still the lowest price of the year, since BTC has gone on an absolutely massive bullish run since.
On Dec. 1, BTC reached a new all-time high of $19,918, but has broken it several times until now, culminating with a high of $28,377, reached on Dec. 27. As of Dec. 28, BTC has increased by 280 per cent since the beginning of the year, trading at $27,000 as opposed to $7,200, which was the price on Jan. 1.
The outlook for cryptocurrencies in the year 2021 is decisively bullish, both in the technical and fundamental aspects. Institutional interest is increasing considerably, as evidenced by the stockpiling of cryptocurrencies by the Grayscale Investment Trust.
Biggest gainers
In this article, we will take a look at five coins which have increased the most throughout the year. Only coins ranked in the top 100 by market capitalization will be considered, and the increases will be rounded up to the nearest whole number.
The top five alongside their rate of increase is as follows:
- AAVE (50x)
- KSM (39x)
- BAND (27x)
- Celsius (16x)
- OCEAN (10x)
As a frame of reference, BTC has increased by roughly 2.4x during the year, as of the time of writing — the measuring period begins once coins are listed on a major exchange, so some coins such as YFI and YFII are not included.
AAVE (AAVE)
In the year 2020, AAVE had one of the most memorable crypto runs to date. Besides the fact that the yearly increase was significantly higher than that of all the other cryptocurrencies we analyzed, it also measures admirably with increases from the 2017 bull-run.
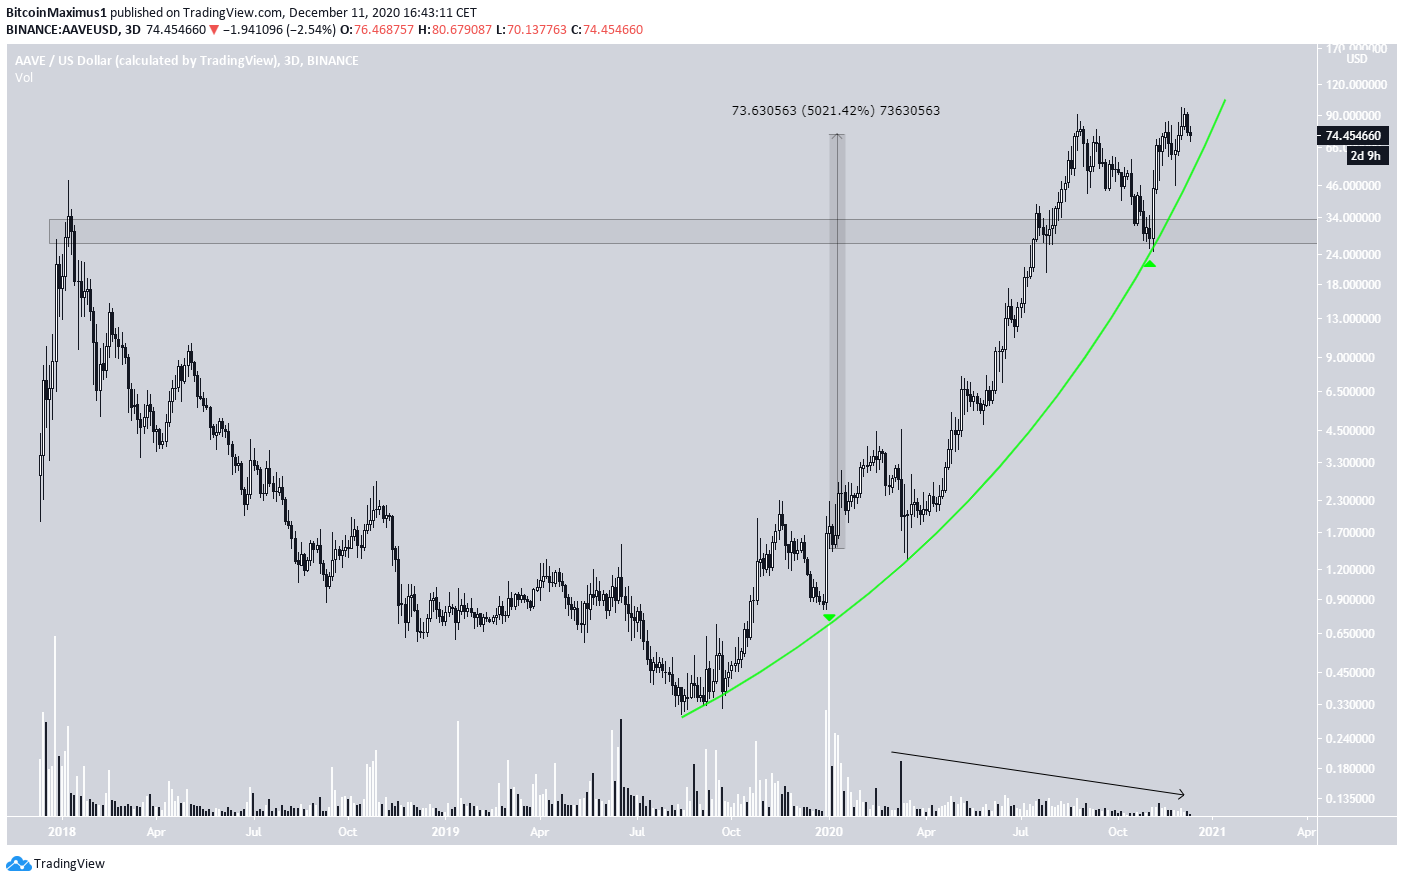
On Jan. 1, 2020, AAVE was trading at a low of $1.41. In mid-December, it was trading at around $74, an increase of 5,000 per cent for the year. In addition, AAVE reached a new all-time high of $99.53 on Dec. 5, dwarfing the previous all-time high of $48.5, which was reached in 2018.
To put it into perspective, if you had invested $100 in AAVE on Jan. 1, you would currently have $5,000.
The price movement for AAVE shows a parabolic move, which, while unsustainable in the long-run, has given amazing gains throughout the year. Interestingly, the parabola — shown in green in the image below — was not broken, as of mid-December.
What stands out is the significant volume during the beginning of the run and the extremely low volume since then, a sign of a weakening trend. In addition, there is a possible double top pattern visible from Aug. 25 to the next all-time high, a bearish sign. However, the parabola is still intact, possibly allowing AAVE for a strong finish to the year, as long as it does not break down.
Note: the logarithmic chart is used in the image in order to better visualize large price fluctuations. The same will be done with all of the images presented in the article.
Kusama (KSM)
Even though its rate of increase lags behind that of AAVE, KSM had quite a memorable run itself.
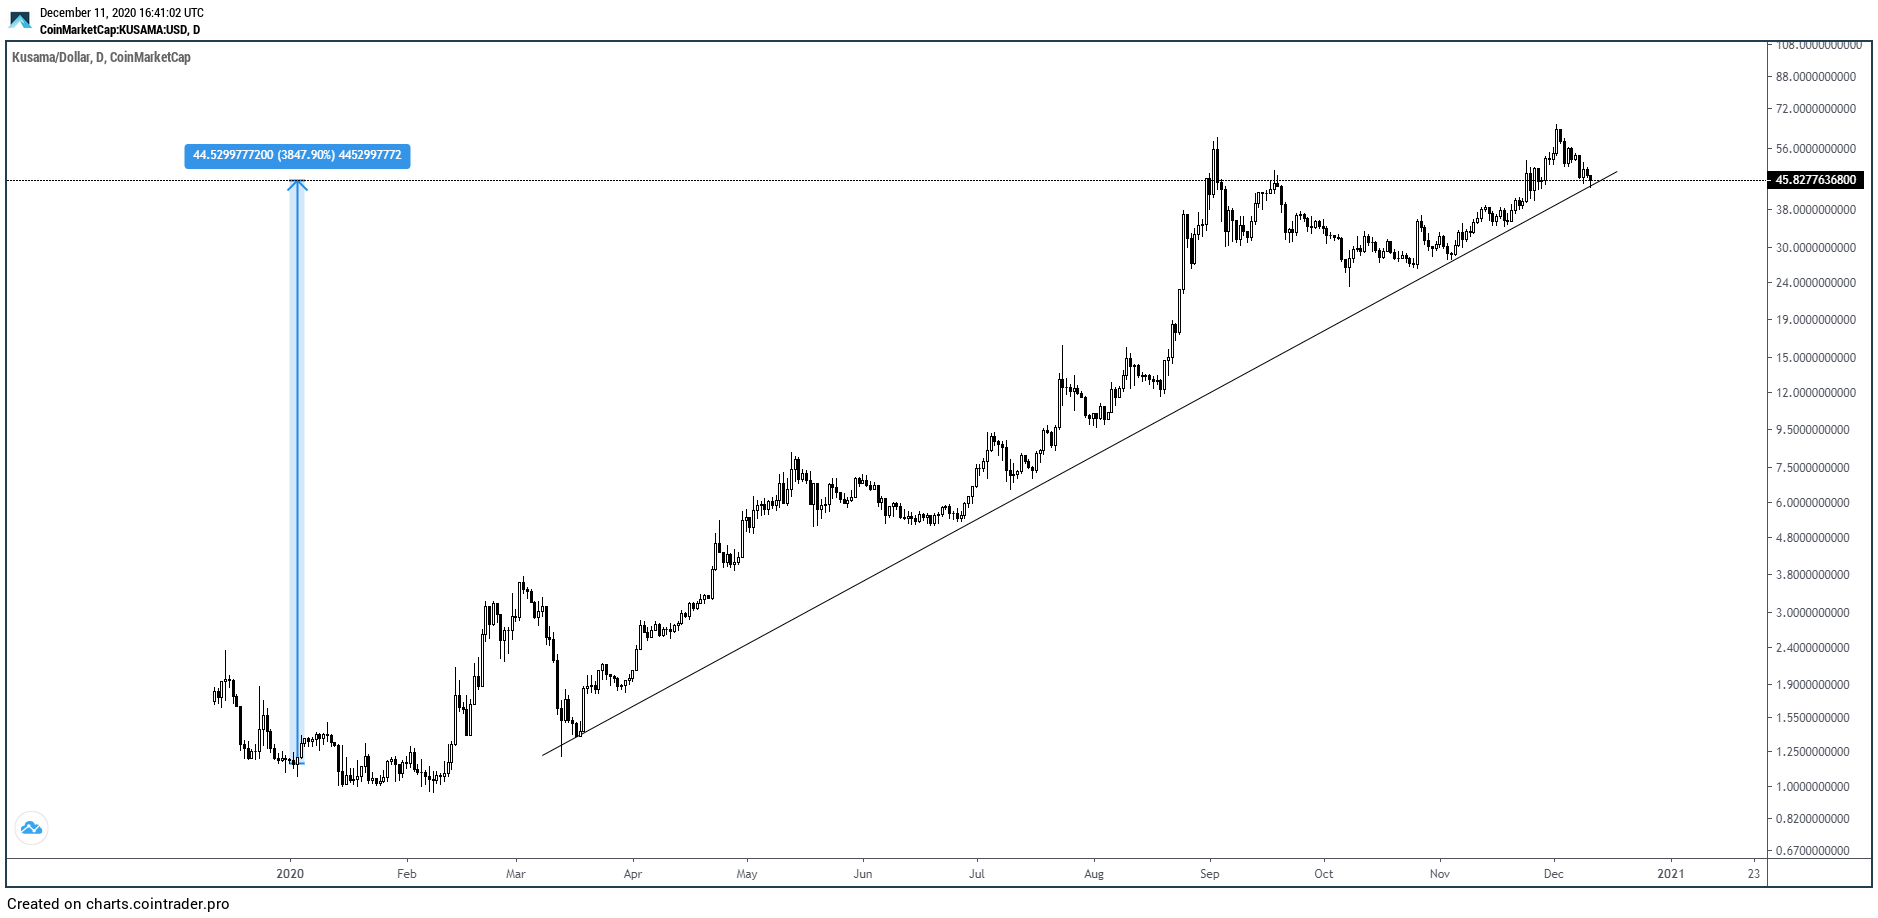
On Jan. 1, the KSM price was trading at $1.15, while in mid-December it was trading at around $45, an increase of 3,850 per cent. KSM first reached an all-time high on Sept. 3, then proceeded to reach a slightly higher high of $65.2 on Dec. 2.
Unlike AAVE, the increase for KSM is more of a straight trendline than it is a parabola, a sign of a more sustainable price increase. While this bodes well for its future outlook, KSM has also created a double top pattern. The pattern is very similar to that of AAVE and could be a sign of a trend reversal.
Band Protocol (BAND)
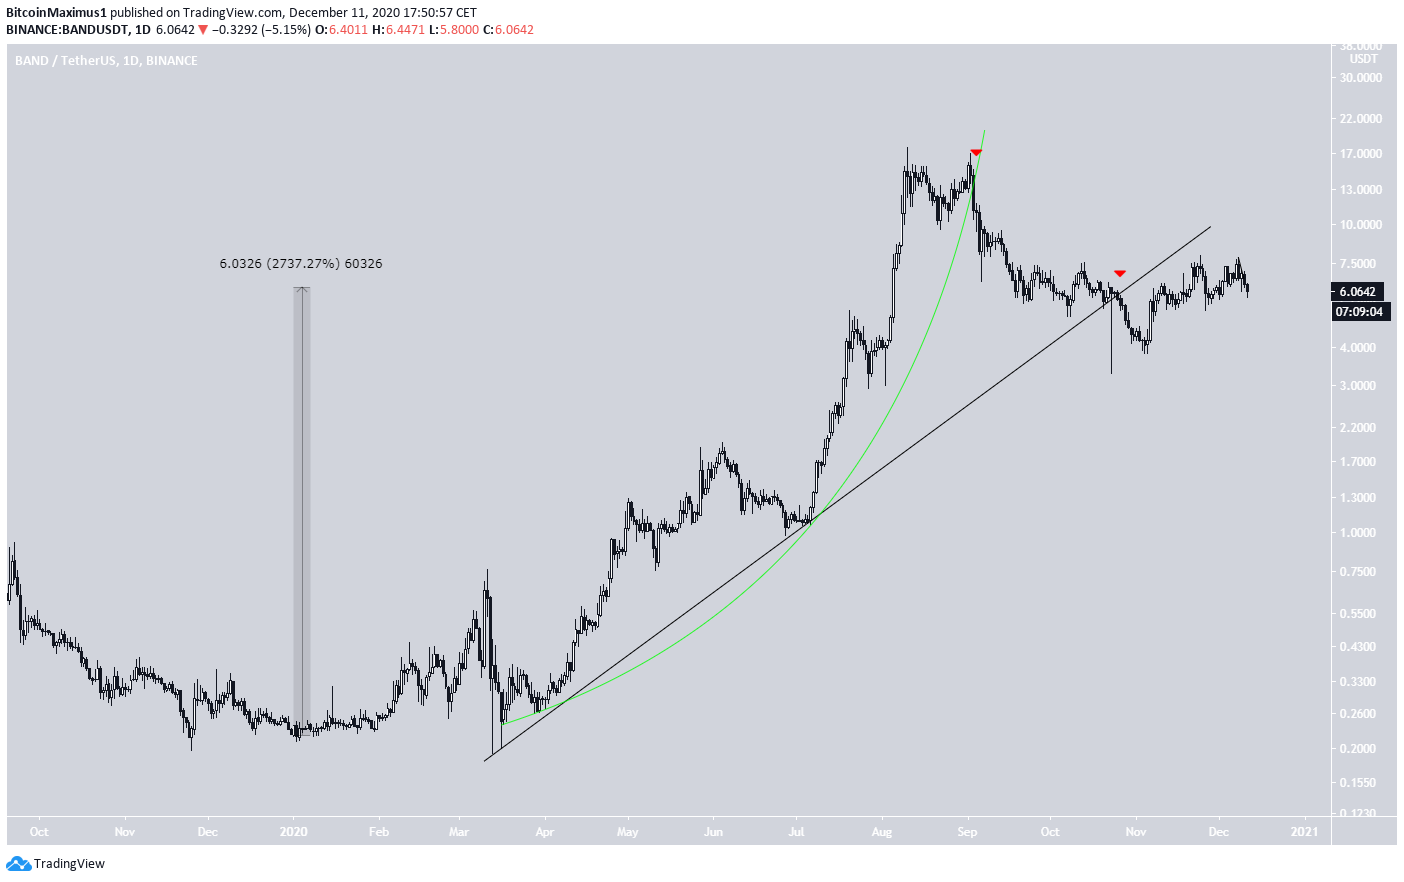
Out of the coins we have outlined, BAND is the first that has broken down from its structure, which is true whether you use a parabola (green) or an ascending support line (black). This is a bearish sign, and if BAND continues decreasing, it could be serve as a benchmark for the other coins with similar completed upward movements.
Prior to breaking down, BAND reached a new all-time high of $17.78 on Aug. 10, but has been decreasing since. Measuring from the Jan. 1 price of $0.218, this was an increase of 8,500 per cent, and would have snatched the top sport from AAVE. However, after the breakdown, the higher prices could not be sustained and AAVE gets to keep the top spot.
At the time of writing, BAND was trading at $6.03, with an increase of 2,740 per cent.
However, due to the break in structure, the outlook for BAND is considerably more bleak than that for AAVE and KSM. In addition, it is worth mentioning that the BAND has decreased by a little more than 60 per cent since the Aug. 10 all-time high, demonstrating the risks of getting caught in entering a trade prior to a significant corrective movement.
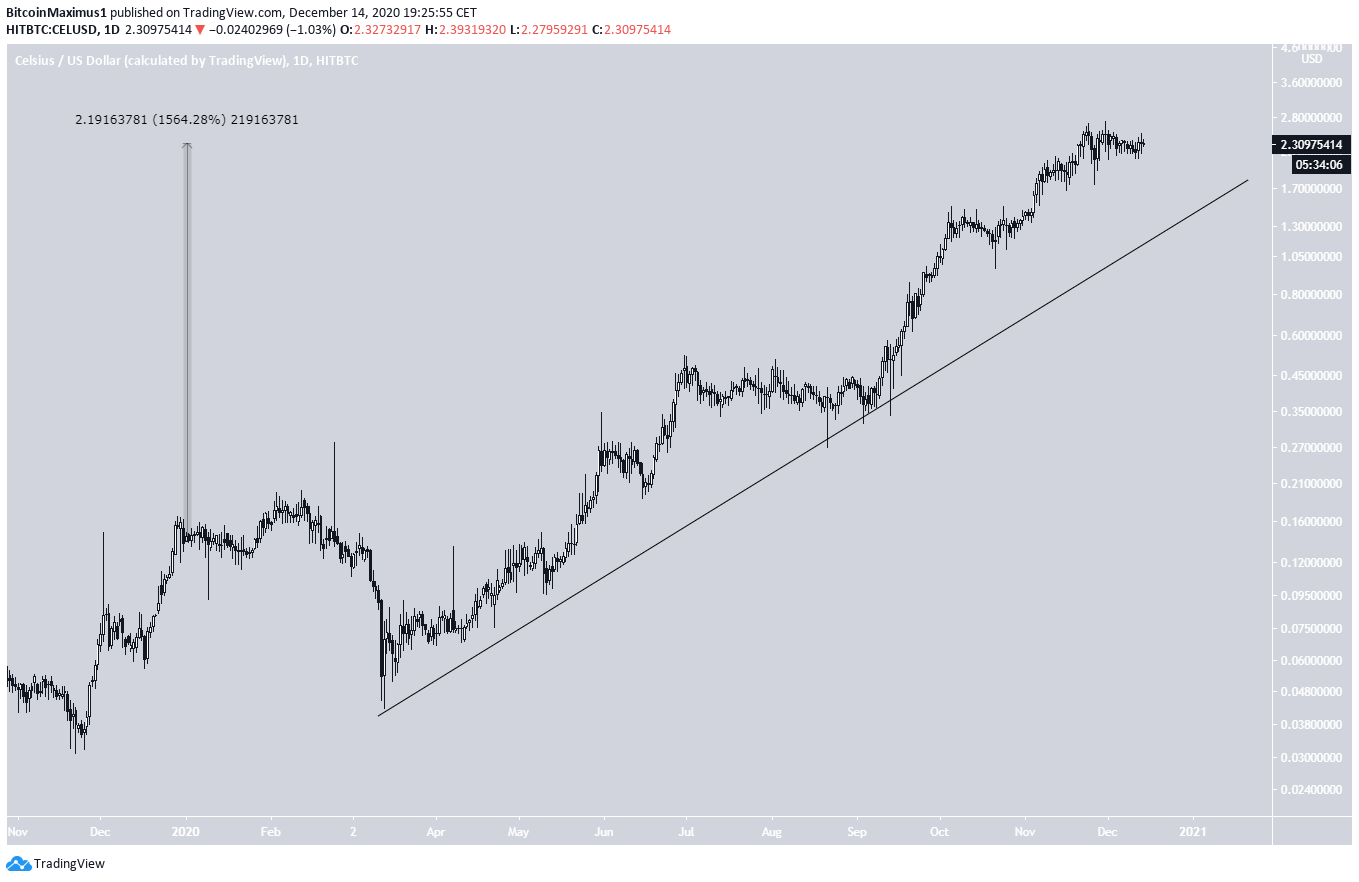
Celsius (CEL)
On Jan. 1, the CEL price was trading close to $0.138. After a considerable drop during the “March crash,” CEL began the current upward movement that is still ongoing, reaching a new all-time high of $2.72, on Nov. 30.
The price movement is very similar to that of KSM, with the difference being that CEL has not dropped and validated its support line since reaching the all-time high. Furthermore, CEL has yet to undergo a significant correction. From the coins that we selected, it is the only one that has yet to do so.
Therefore, while the relatively gradual movement is a positive sign, the lack of a correction is a cause for concern. A drop to the ascending support line would be a decrease of roughly 30 per cent.
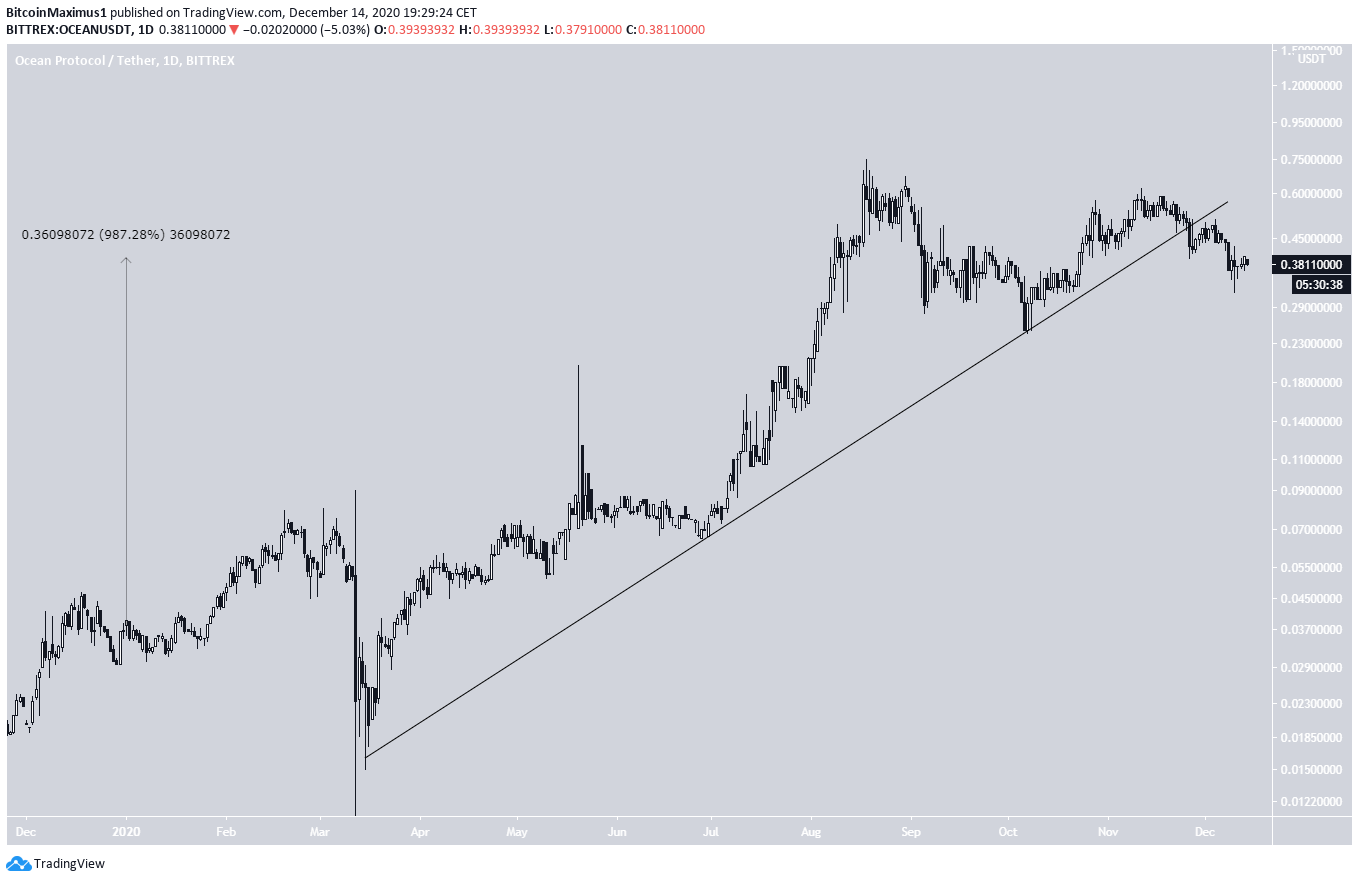
Ocean Protocol (OCEAN)
Finally, we arrive at OCEAN, which rounds out the top five. OCEAN was trading at $0.034 on Jan. 1, before beginning a rapid upward move that culminated with a new all-time high of $0.75 on Aug. 18.
However, the higher prices could not be sustained and OCEAN was trading at $0.38, at the time of writing. This is an increase of 987 per cent measuring from the price on Jan. 1.
Similar to BAND, the bullish structure for OCEAN, namely the ascending support line, has been broken. Furthermore, this occurred after OCEAN made an attempt at creating a new all-time high but failed to do so.
These are both signs of weakness that could suggest that the upward move for OCEAN has ended and a significant correction awaits.
Towards new highs
The cryptocurrency sector is notorious for otherworldly price increases and decreases. These movements have served to create both a group of enthusiasts, who are enamored with cryptocurrencies because of their significant potential for gains, and a group of detractors, which disparage the crypto sector because of the inherent risks associated with these wild price fluctuations.
The fact that the use of a logarithmic chart is mandatory just to visualize the price movement further serves to drive this point home.
An interesting observation is that the biggest gainers reached their yearly highs in August—September, before dropping. However, some of them proceeded to reach new highs in December. If their structure holds, it is possible that they have yet to reach their highs.
In addition, it is worth keeping in mind that after such a significant upward movement, the ensuing downward move is often as consequential. This was illustrated in the case of BAND and potentially OCEAN.
This could especially be the case if the current structure fails in parabolic movements such as that in AAVE, since due to the rapid increase there is a distinct lack of support all the way down to much lower levels.
Note: Cryptocurrency trading carries a high level of risk and may not be suitable for all investors. The views expressed here are those of the author’s and do not necessarily represent or reflect the views of BeInCrypto.
