


Berachain’s (BERA) price has risen more than 15% in the last 24 hours, and its market cap has reached $800 million. This surge comes after BERA formed a golden cross, signaling a potential trend reversal to the upside.
Despite this bullish momentum, its RSI remains in neutral territory, and its CMF, although improving, is still negative, indicating cautious sentiment. With resistance at $9.18 and support at $6.18, BERA’s next moves will depend on whether buying pressure can be sustained.
Berachain RSI Has Been Neutral Since February 21
Berachain’s RSI is currently at 57.59, up from 35.9 one day ago, indicating a significant increase in buying momentum. The Relative Strength Index (RSI) measures the speed and change of price movements, oscillating between 0 and 100.
Typically, an RSI above 70 suggests that an asset is overbought and could be due for a correction, while an RSI below 30 indicates that it is oversold and might be primed for a bounce.
Readings between 30 and 70 are generally considered neutral, reflecting a balance between buying and selling pressure.
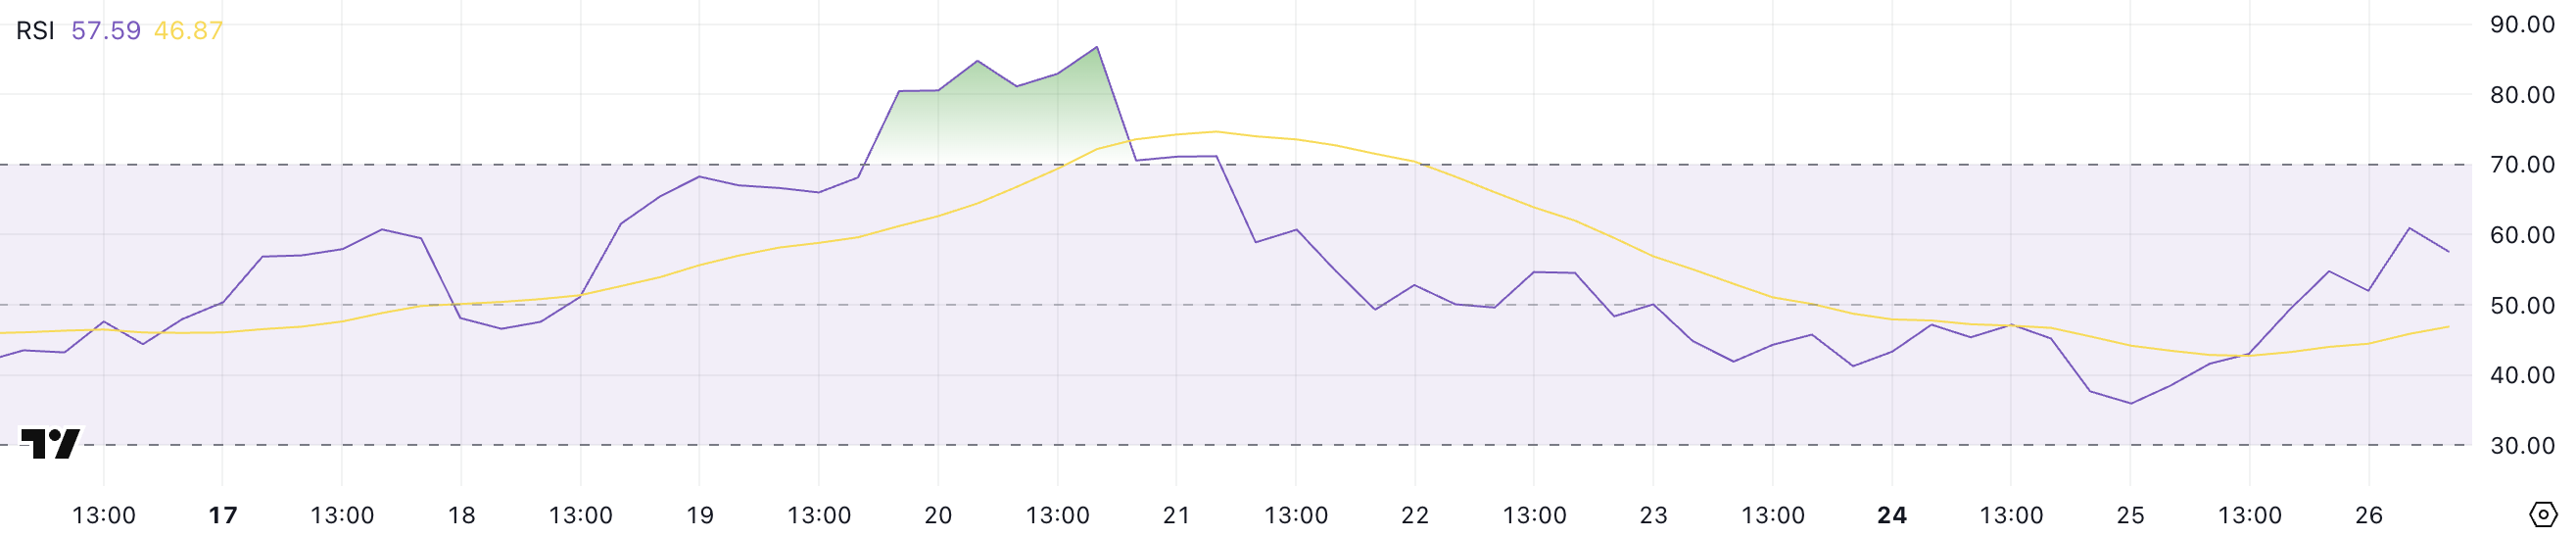
With BERA’s RSI at 57.59, it remains in neutral territory but shows a notable upward movement, suggesting increasing bullish momentum. This could indicate that buying interest is building up, potentially leading to a continuation of the recent upward price action.
If the RSI continues to rise and approaches 70, it could signal an overbought condition, increasing the likelihood of a pullback. Conversely, if it stabilizes around the current level, BERA could experience consolidation before deciding its next directional move.
Given that Berachain RSI has been neutral for almost a week, this recent uptick could be an early sign of a trend reversal. However, confirmation would require a sustained increase in buying pressure.
BERA CMF Is Going Up, But Still Negative
Berachain’s CMF is currently at -0.13, up from -0.41 two days ago. This indicates that selling pressure is decreasing but still outweighs buying interest.
The Chaikin Money Flow (CMF) measures the volume-weighted average of accumulation and distribution over a set period, typically 20 or 21 days. It oscillates between -1 and +1, with positive values suggesting buying pressure and accumulation. On the other hand, negative values indicate selling pressure and distribution.
Generally, a CMF above 0.20 is considered strongly bullish, while a CMF below -0.20 is seen as strongly bearish. Values closer to zero reflect a more neutral stance, signaling a balance between buyers and sellers.
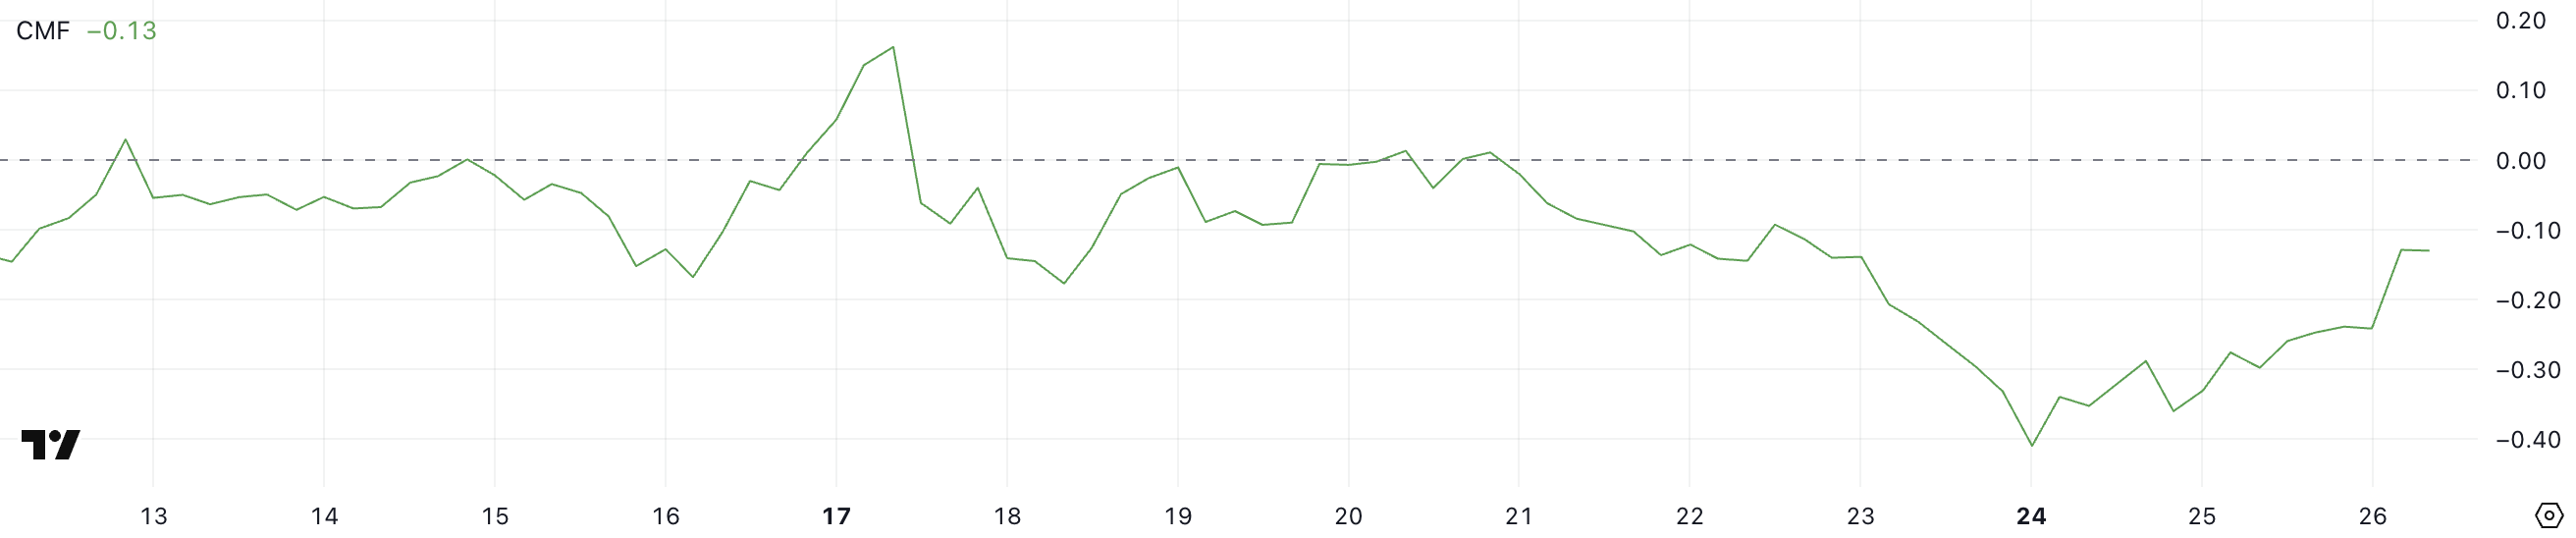
With BERA’s CMF at -0.13, it remains in negative territory, showing that selling pressure is still present but weakening. This could indicate that while bears are still in control, their influence is diminishing, potentially paving the way for a shift in momentum.
If the CMF continues to rise and crosses above zero, it would signal a transition to buying pressure. That would possibly lead to a bullish price movement. However, given that BERA’s CMF has been negative for six days now, it suggests that sentiment remains cautious, and a clear reversal would require sustained buying volume.
Until that happens, Berachain price may continue to face downward pressure or consolidate before deciding on its next directional move.
Will Berachain Reclaim $9 Soon?
Berachain just formed a golden cross, a bullish technical pattern that occurs when the short-term moving average crosses above the long-term moving average, signaling a potential trend reversal to the upside.
This bullish signal is reinforced by BERA price surging more than 15% in the last 24 hours, pushing it back above the $7 level. Golden crosses are typically seen as a sign of strong buying momentum and the start of a sustained uptrend.
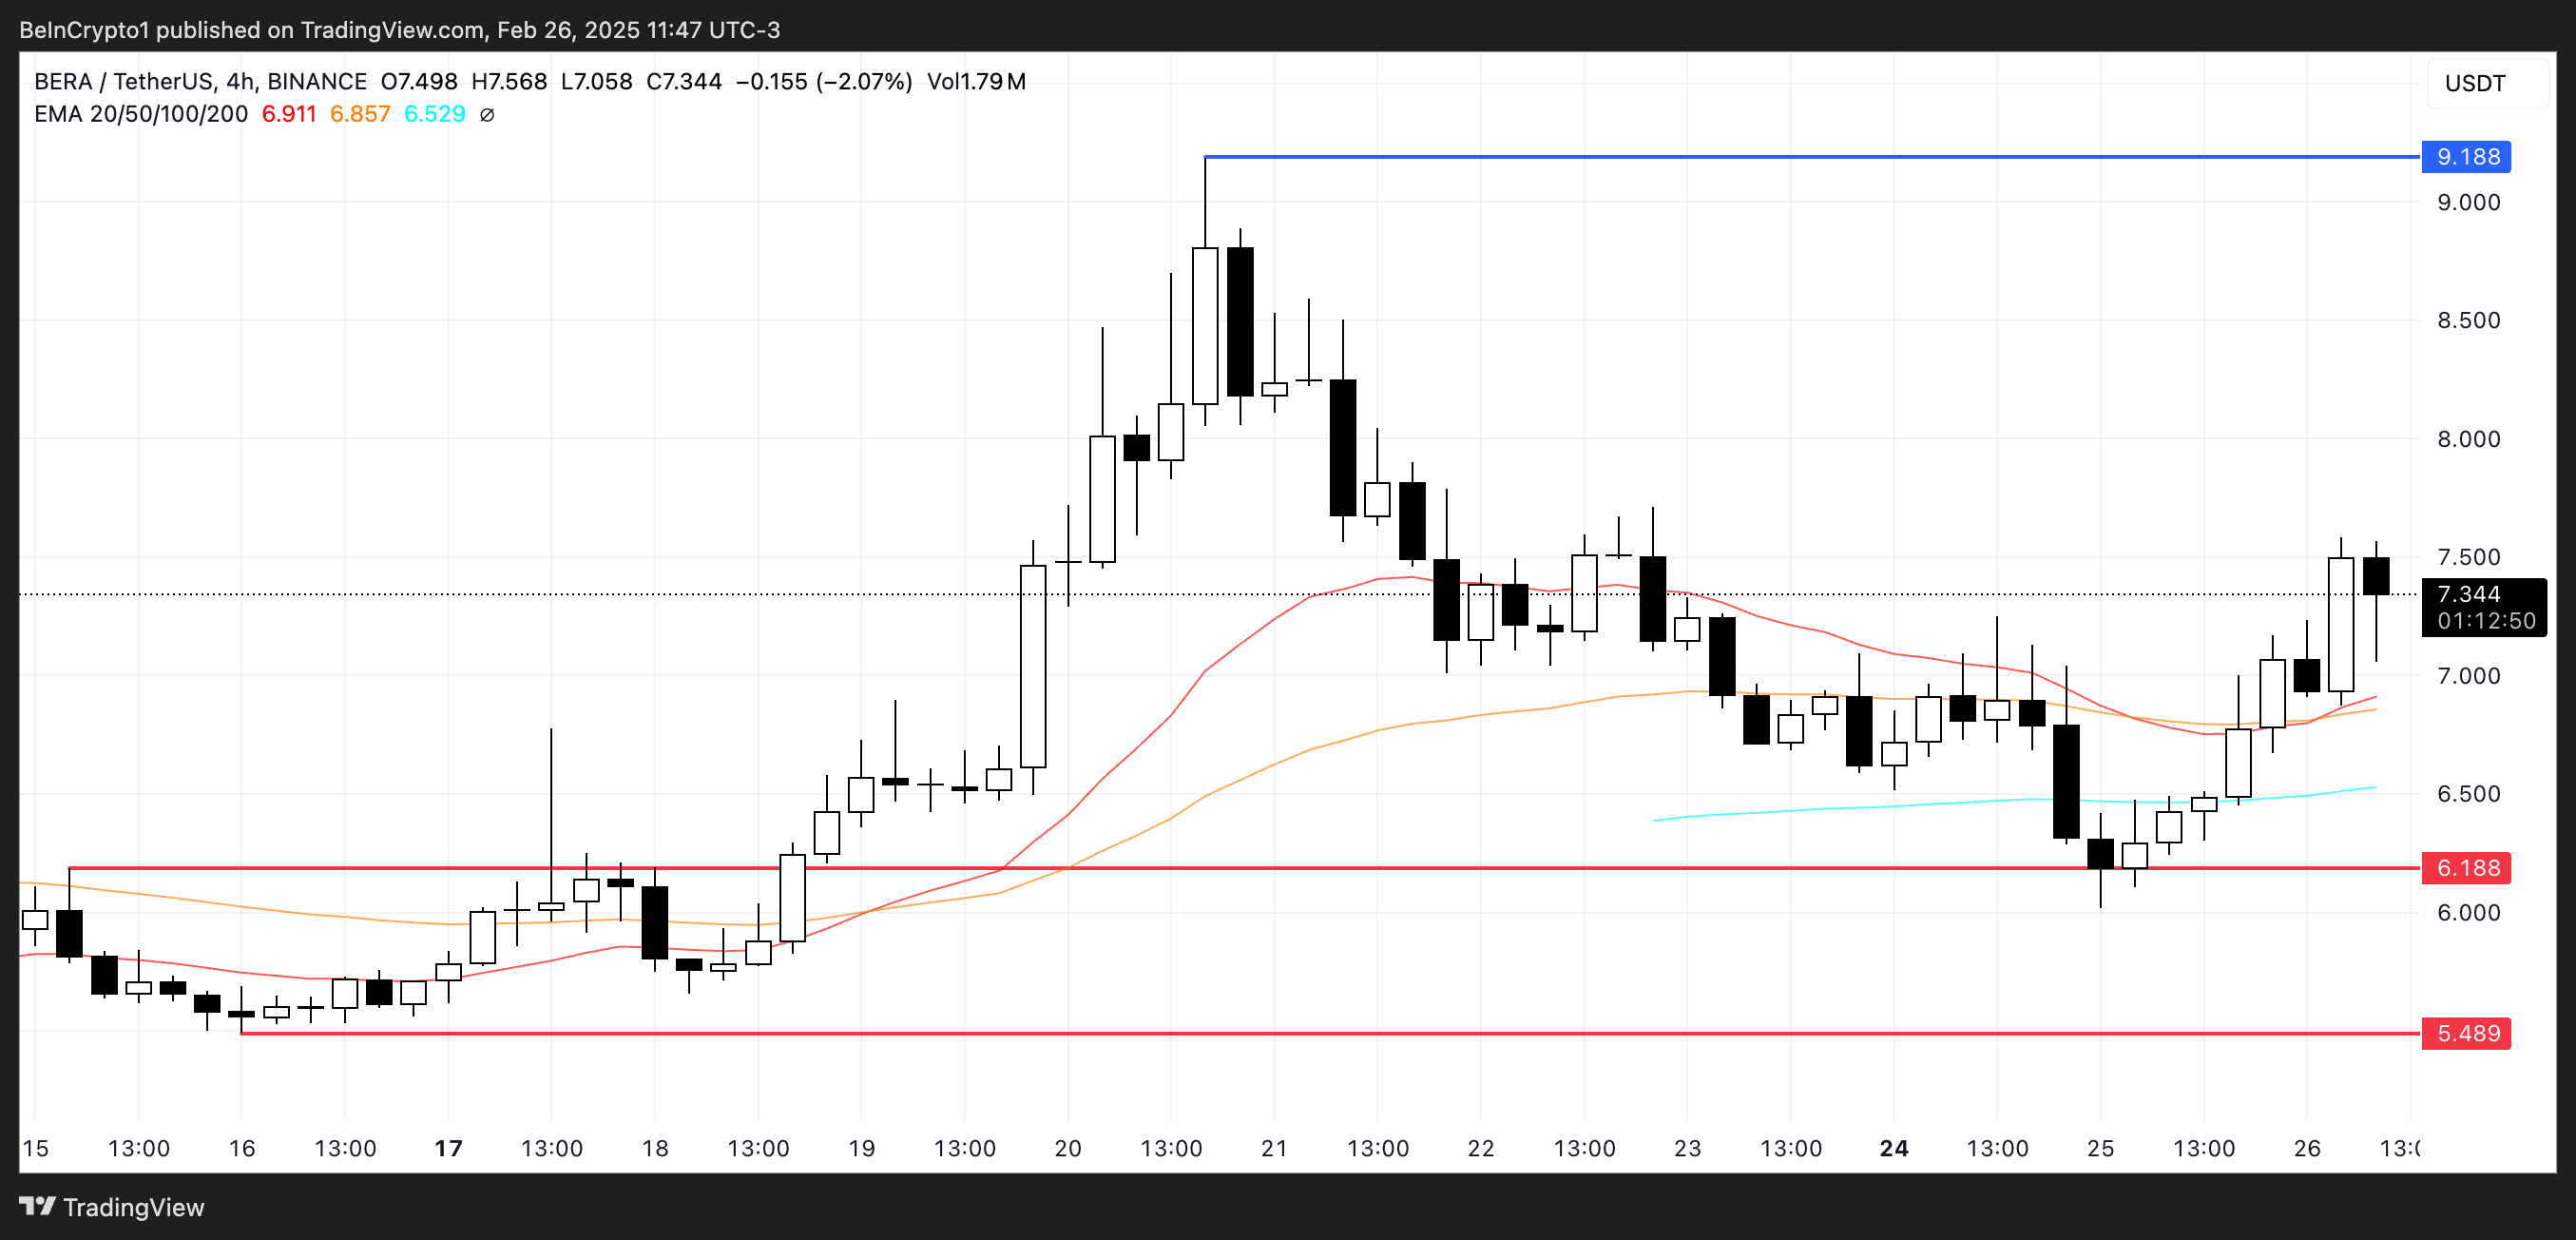
If this uptrend continues, Berachain could rise to test the next resistance at $9.18. That would represent a potential 25% upside from its current price.
However, if the uptrend loses steam and selling pressure increases, BERA could retest the support at $6.18, which held strong yesterday.
If this support is tested again and fails, BERA could decline further to $5.48. This would mark a potential 25% correction from current levels.


