
Ethereum (ETH) has been moving downwards since it reached an all-time high on May 12. So far, it has reached a low of $1,750.
Technical indicators in multiple time-frames are bearish, supporting a continued fall in price.
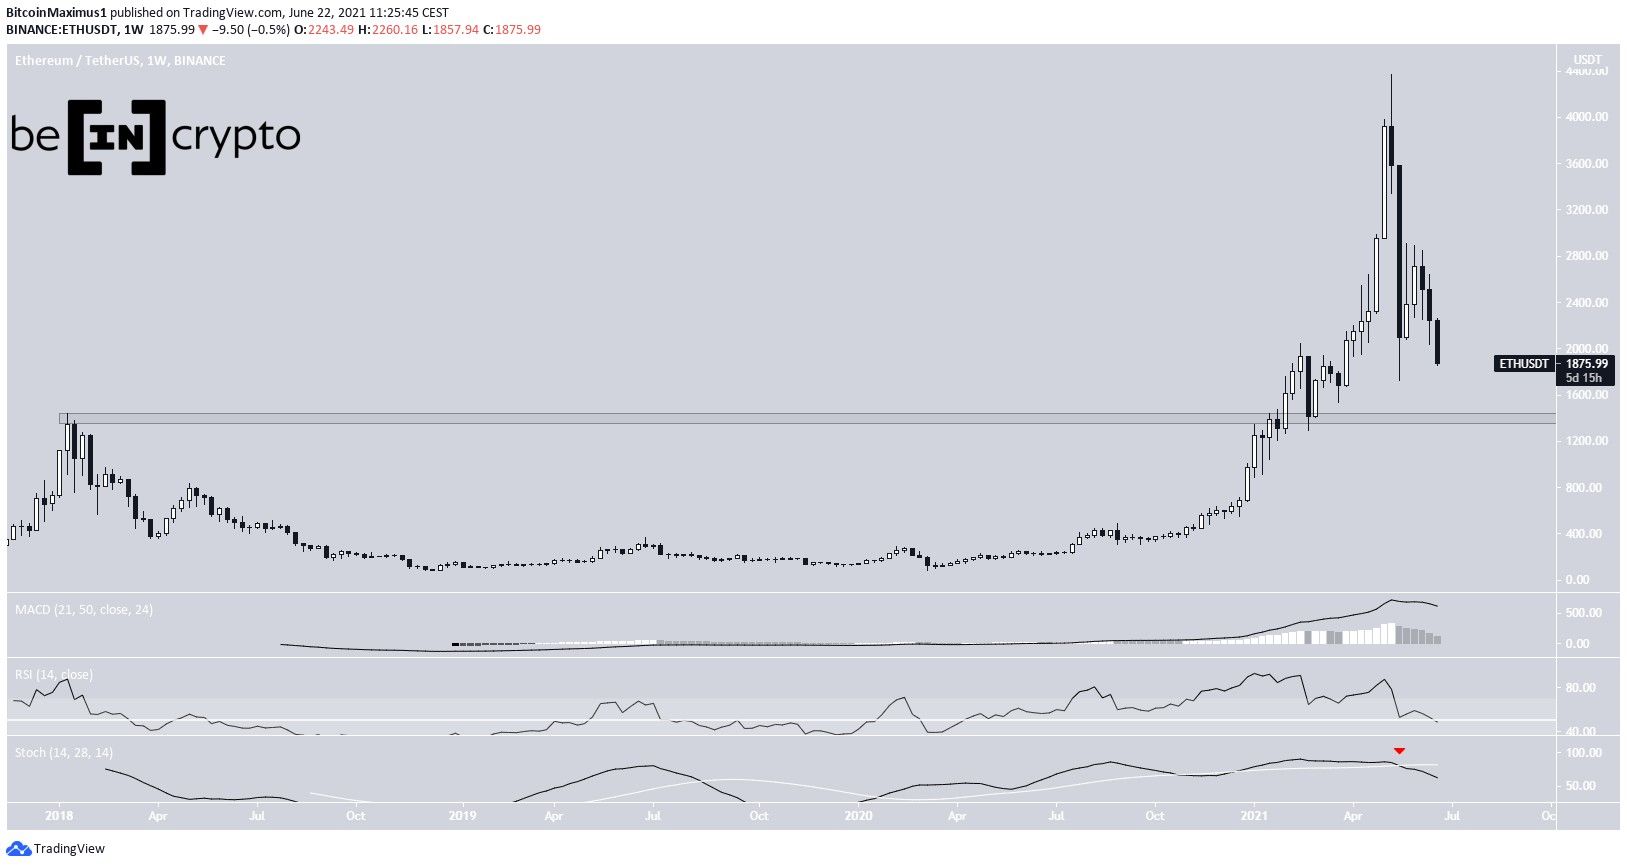
Long-term ETH levels
ETH has been moving downwards since May 12, when it had reached an all-time high price of $4,340. The decrease has been swift, so far leading to a low of $1,750 on May 23.
Technical indicators are decisively bearish. The MACD & RSI are falling, the latter crossing below 50. The Stochastic oscillator has already made a bearish cross (red icon)
The main support is at $1,400. This is the previous all-time high resistance area, which has been validated once after the ensuing breakout.
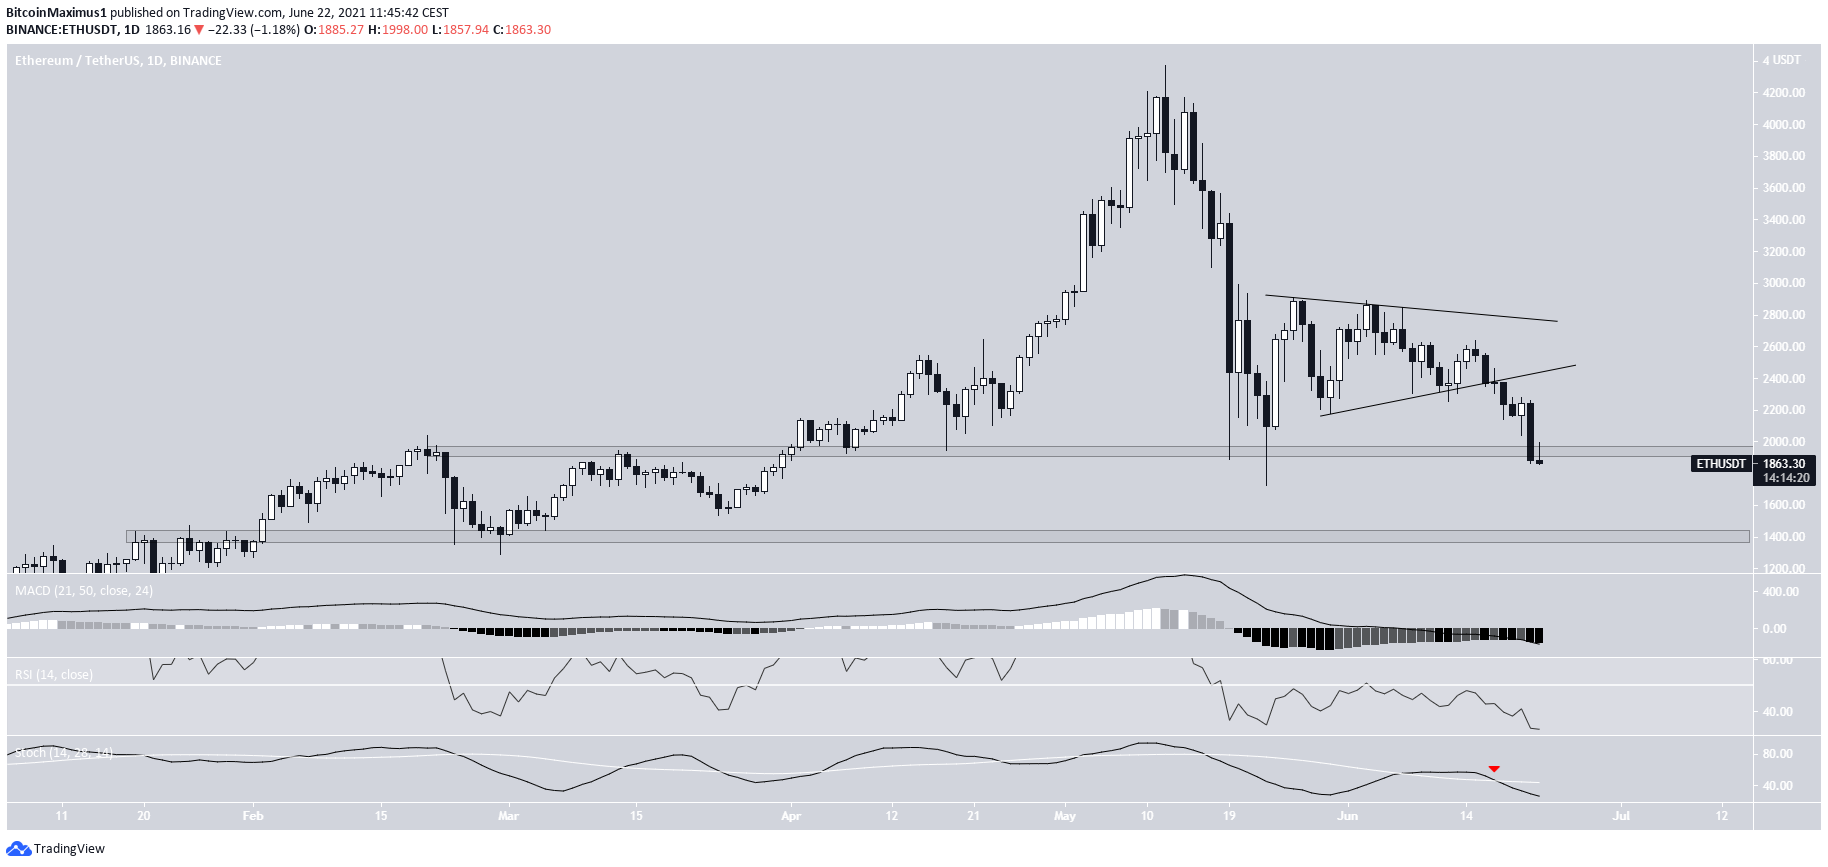
Ongoing breakdown
The daily chart aligns with the bearish sentiment.
ETH has broken down from a symmetrical triangle on June 17 and has been moving downwards since.
Currently, it is in the process of falling below the $1900 support area. In addition to this, yesterday’s close was the lowest since March.
Finally, technical indicators are providing a bearish outlook. The Stochastic oscillator has made a bearish cross and both the RSI & MACD are falling. The former is below 50 while the latter is negative.
The next support level is at $1450, coinciding with the previously outlined long-term support level.
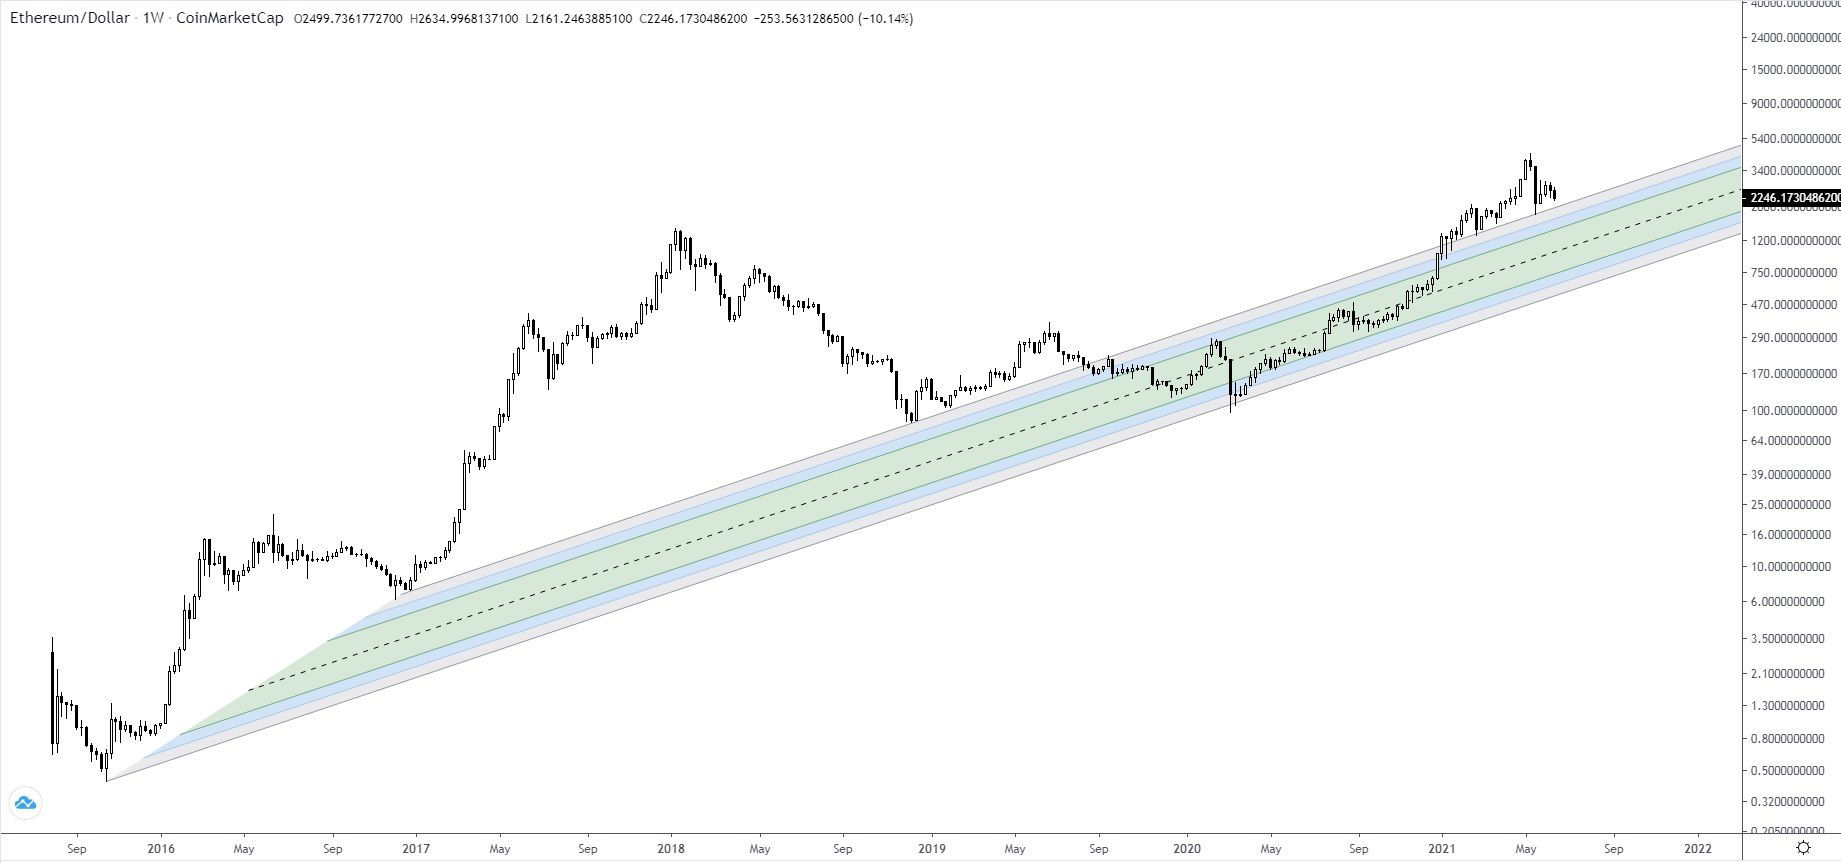
Cryptocurrency trader @TheEuroSniper outlined an ETH chart, stating that the token could continue consolidating for a while near the $1500-$2000 region. This is in line with readings from both the weekly and daily time-frames.
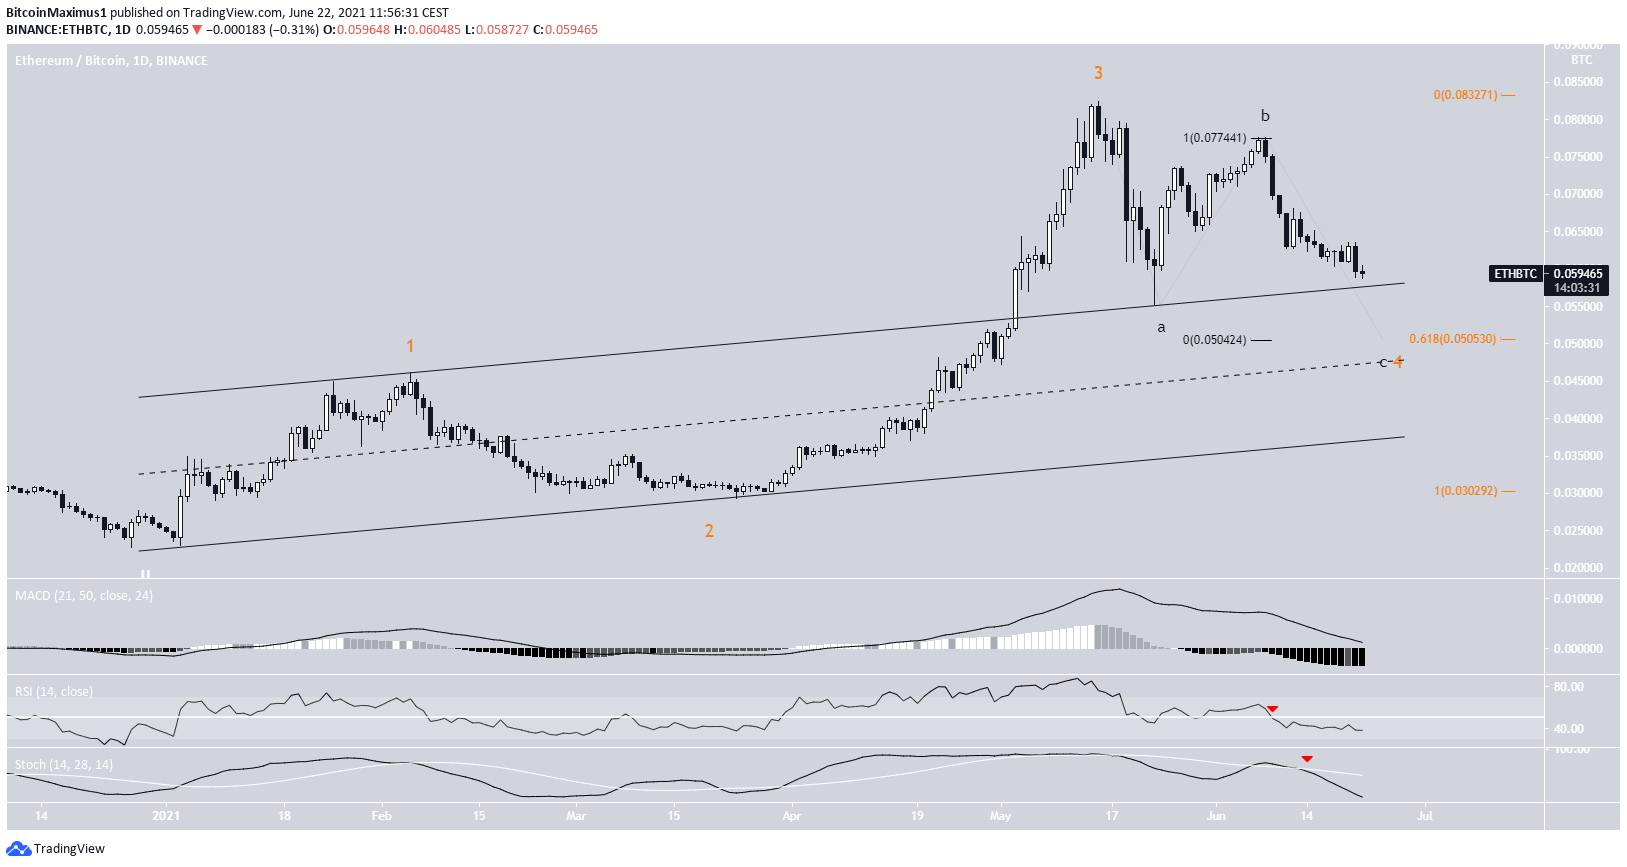
ETH/BTC
The ETH/BTC pair provides a similarly bearish picture. It has been moving downwards since creating a lower high on June 9.
Similarly to the USD pair, technical indicators are firmly bearish. The RSI has fallen below 50 while the Stochastic oscillator has made a bearish cross.
The wave count indicates that this is a fourth wave pullback (orange). A very likely level for the bottom of the move would be at ₿0.05. This would give the A:C sub-waves (black) a 1:1 ratio. In addition, it would reach both the 0.618 Fib retracement support level and middle of the parallel channel.
Afterwards, an upward movement would be likely.
For BeInCrypto’s latest bitcoin (BTC) analysis, click here.
