


In times of recession and/or financial instability, both Bitcoin and gold have been described as safe-haven investments that act as a hedge against the traditional financial markets. However, while the demand for gold has historically increased during unstable times, Bitcoin has only existed in newer generations — thus, there is insufficient data to make the claim.
Since its inception and on most time-frames, the Bitcoin price has significantly outperformed that of gold. Even though it is considered a riskier investment, its rate of increase has absolutely dwarfed that of gold.
Since Bitcoin did not exist during the last financial recession, the next one will provide important data in determining whether Bitcoin has begun to replace gold in the minds of investors.

Analysis
Based on our analysis, while the price patterns of Bitcoin and gold are similar, their previous movement and technical indicators differ significantly. This makes us believe that we cannot use the price of one to predict changes in the other.
Cryptocurrency trader @thrillmex stated that a bearish argument for Bitcoin is found by looking at the patterns of BTC and gold — outlining a bearish fractal.
good bearish argument
gold vs $btc pic.twitter.com/v80wRGn6gK
— Cæsar 🏦 (@PARABOLIT) October 29, 2019
While Bitcoin has often been compared, using a pattern in one to predict the price of the other initially seems like a stretch. However, let’s look at them more closely and see if more similarities arise.
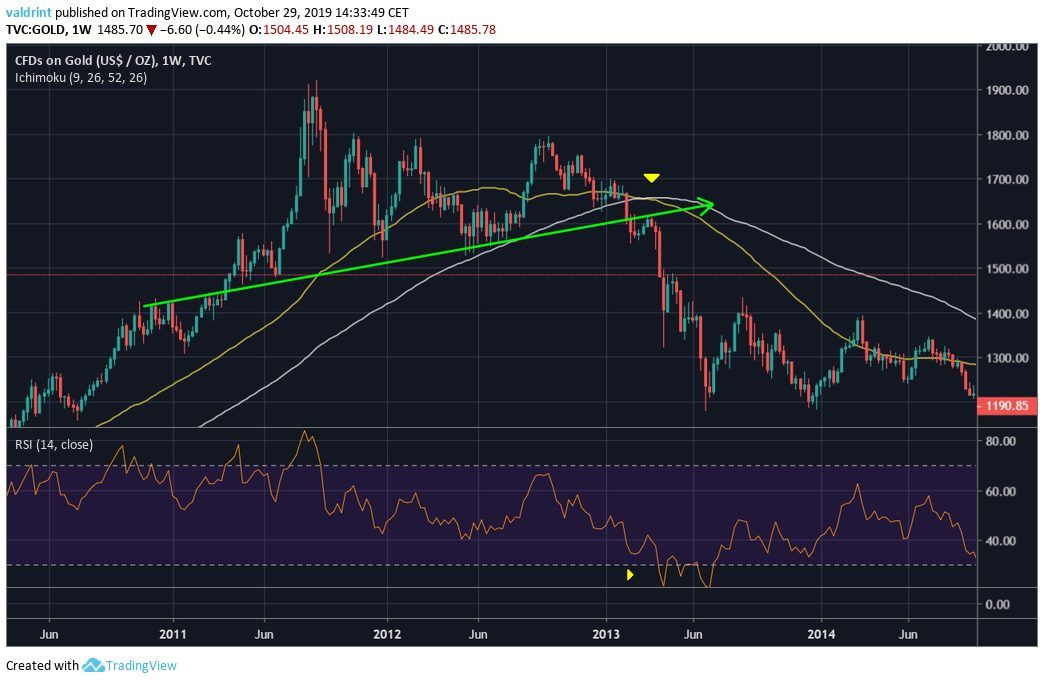
Gold
The support line for the price of gold stretches out for most of 2011-2013. The price made a lower high before eventually breaking down. After the breakdown, there was a bearish cross of the 50- and 100-week moving averages (MA). This indicated that the upward trend has lost its power and a downward trend has begun. Additionally, the RSI was heavily oversold and the lack of divergence reduced the possibility of a reversal.
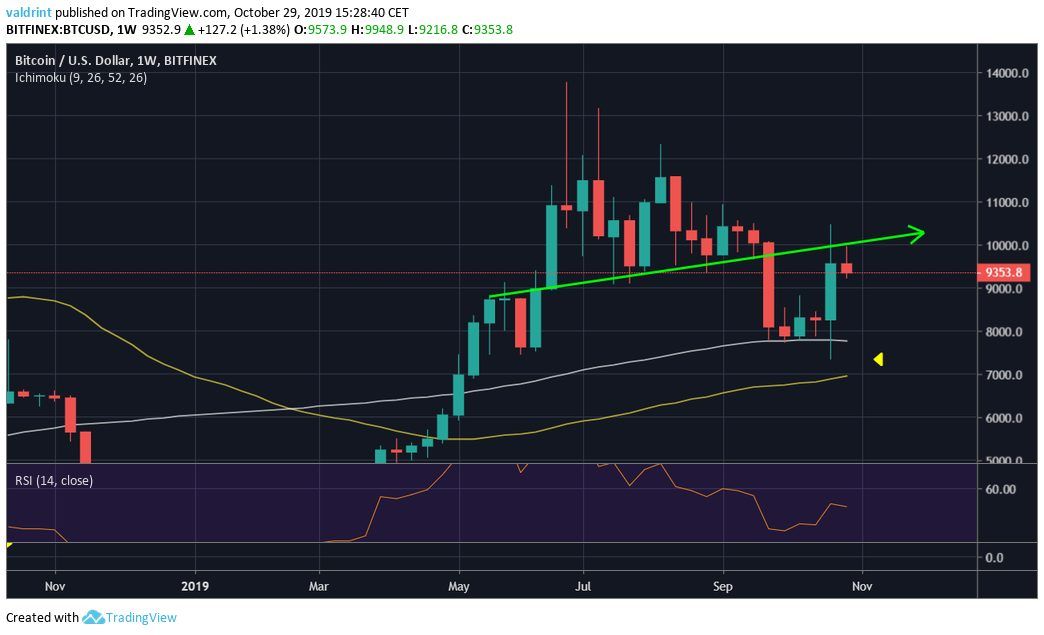
Bitcoin
The pattern for Bitcoin looks similar — besides the fact that it is transpiring within a munch shorter time-frame.
After making a lower high, the BTC price broke down and, afterward, validated the support line. However, it was above the MAs during the whole period and found support above them after the breakdown. Additionally, the RSI is in neutral territory and is moving upward.
Therefore, besides the pattern similarities, we do not see any other resemblance between the prices of Bitcoin and gold during these periods of time.
Disclaimer: This article is not trading advice and should not be construed as such. Always consult a trained financial professional before investing in cryptocurrencies, as the market is particularly volatile.
Did you know you can trade sign-up to trade Bitcoin and many leading altcoins with a multiplier of up to 100x on a safe and secure exchange with the lowest fees — with only an email address? Well, now you do! Click here to get started on StormGain!


