
The Bitcoin Cash (BCH) price is currently attempting to break out above the $320 resistance level, something it has not done since the beginning of Aug.
BCH should successfully break out and begin moving towards the resistance levels outlined in this article.
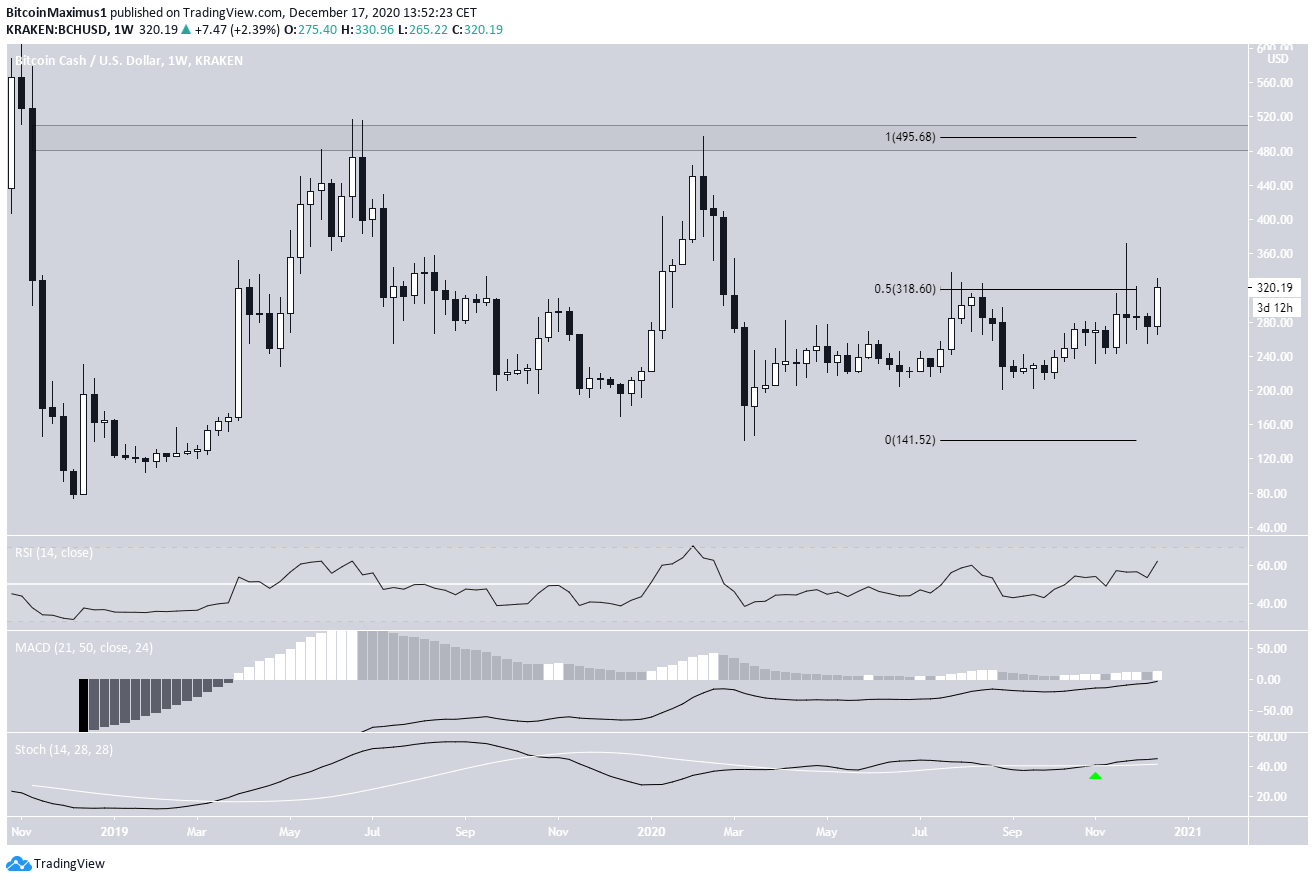
Long-Term Resistance
The weekly chart shows that the price has been moving upwards since March. 13. Despite this, it has been struggling to move above the $318 resistance area since the beginning of Aug. The area is the 0.5 Fib retracement level measured from the Feb. high.
While BCH has moved above this area, it failed to sustain the higher prices and left a long upper wick in place. Currently, it’s in the process of making another breakout attempt.
Technical indicators on the weekly time-frame are bullish, suggesting that it will break out successfully. If so, the next closest resistance area would be at $395.
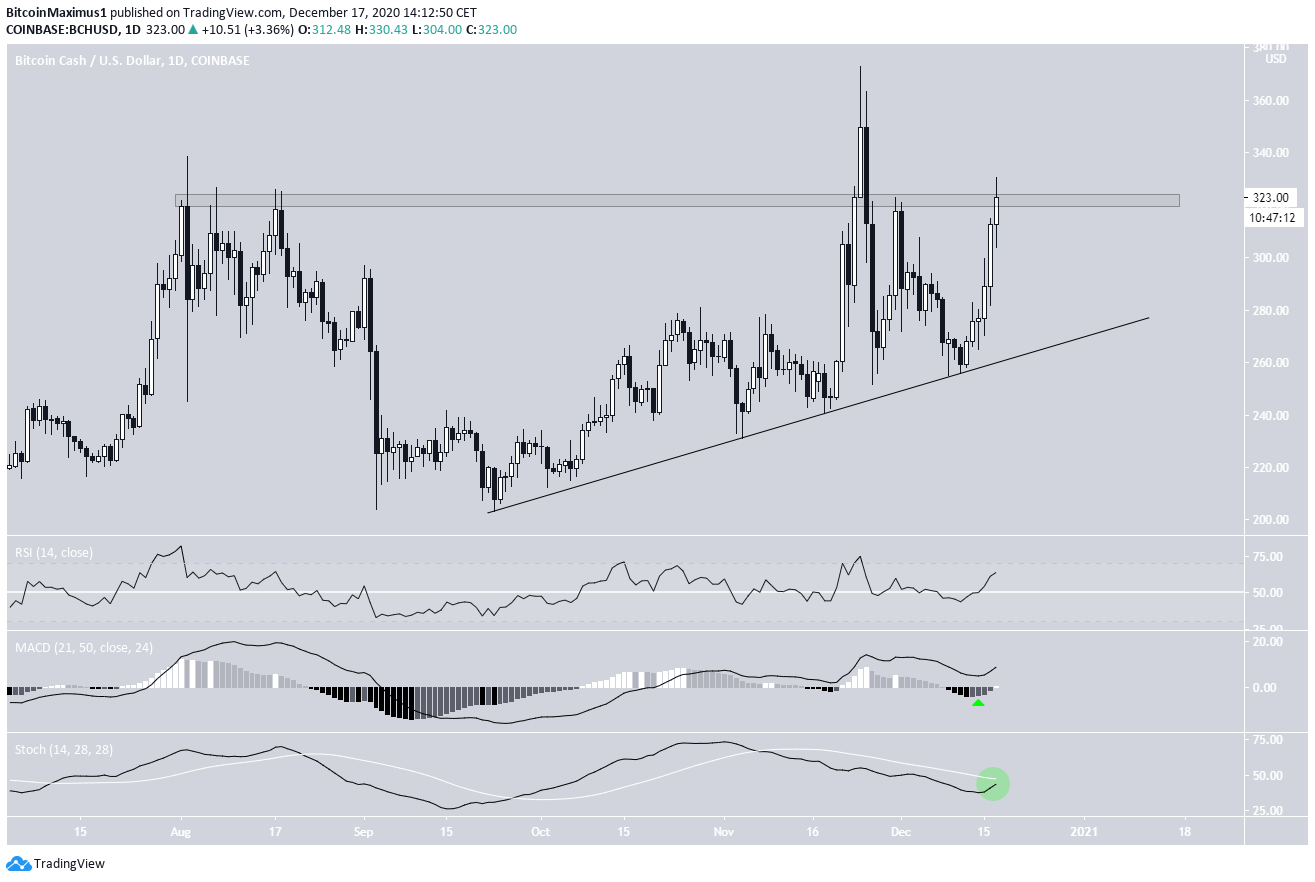
Future Movement
The daily chart shows that BCH has been following an ascending support line since Sept. 23, when it reached a low of $203.
We can also see a minor resistance area at $320, coinciding with the previously mentioned 0.5 Fib retracement level. Except for the previous wick high, BCH has been trading below this line since the beginning of Aug.
Similar to the weekly time-frame, technical indicators are bullish, supporting the possibility of a breakout and move towards the next resistance area at $495.
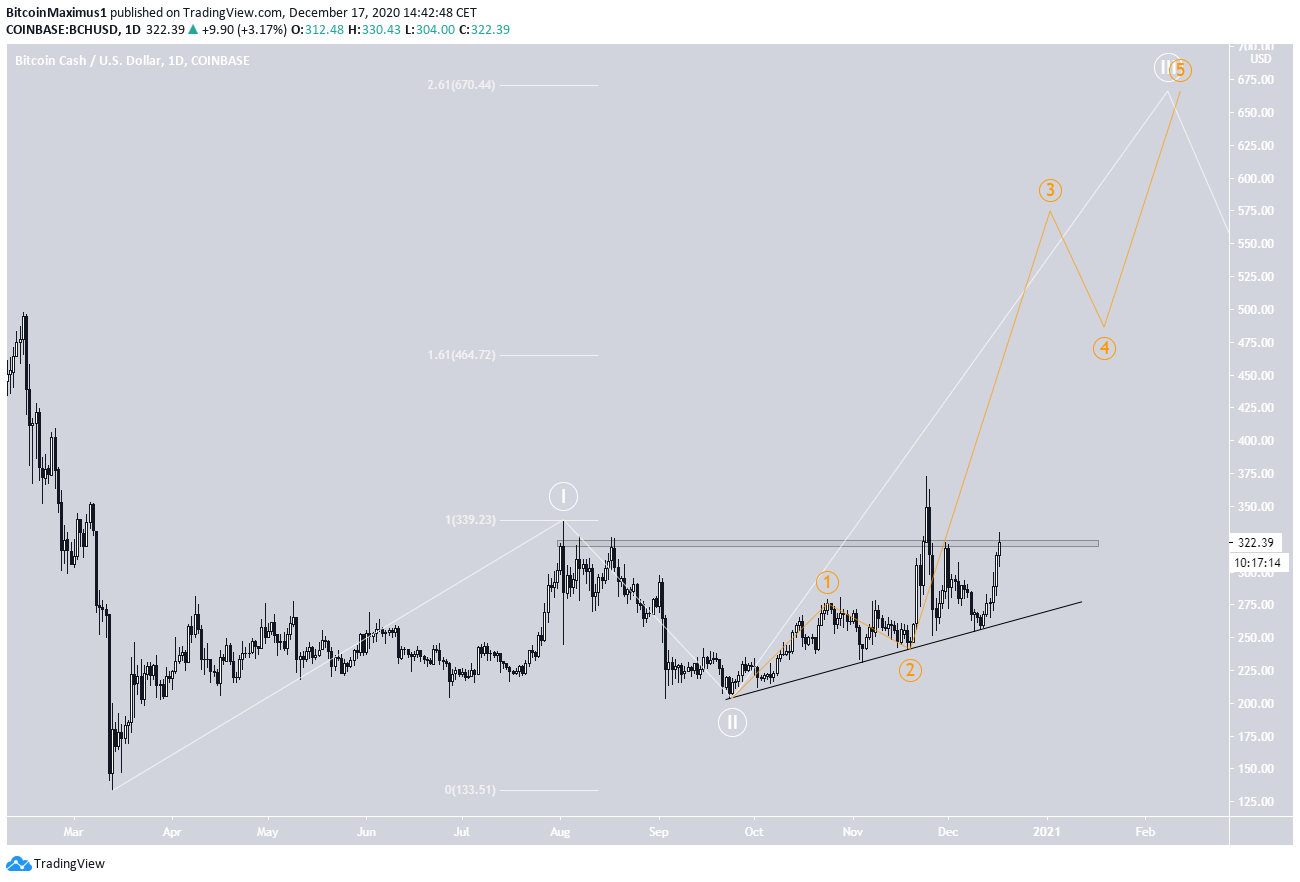
Wave Count
The wave count suggests that BCH began a bullish impulse on March 13 and is currently in an extended wave 3 (shown in white below).
The first target for the top of this wave would be at $465, close to the previously outlined resistance area. But due to the extension, the $670 target seems more likely to act as the top of the move.
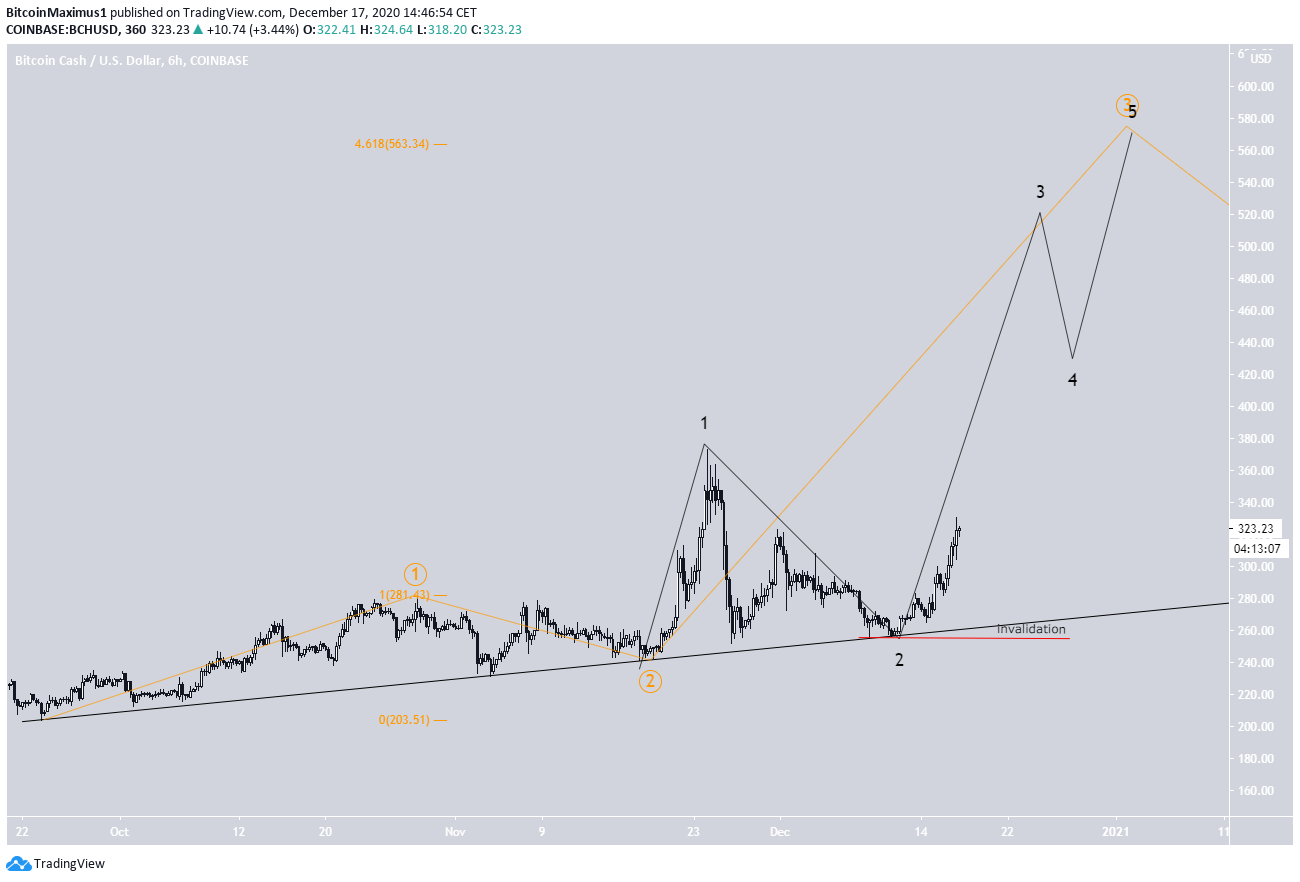
The sub-wave count for wave 3 is shown in orange.
A closer look at the movement reveals a 1-2/1-2 wave formation, which means that sub-wave 3 is also extended. The minor sub-wave count is shown in black.
A likely target for the top of sub-wave 3 is at $563, before a slight drop and continuation of the move towards the $670 target.
More accurate targets will be given once the move begins to unfold.
BCH/BTC
Cryptocurrency trader @Mesawine1 outlined a chart, stating that BCH has bounced at ₿0.013 and should continue moving upwards.
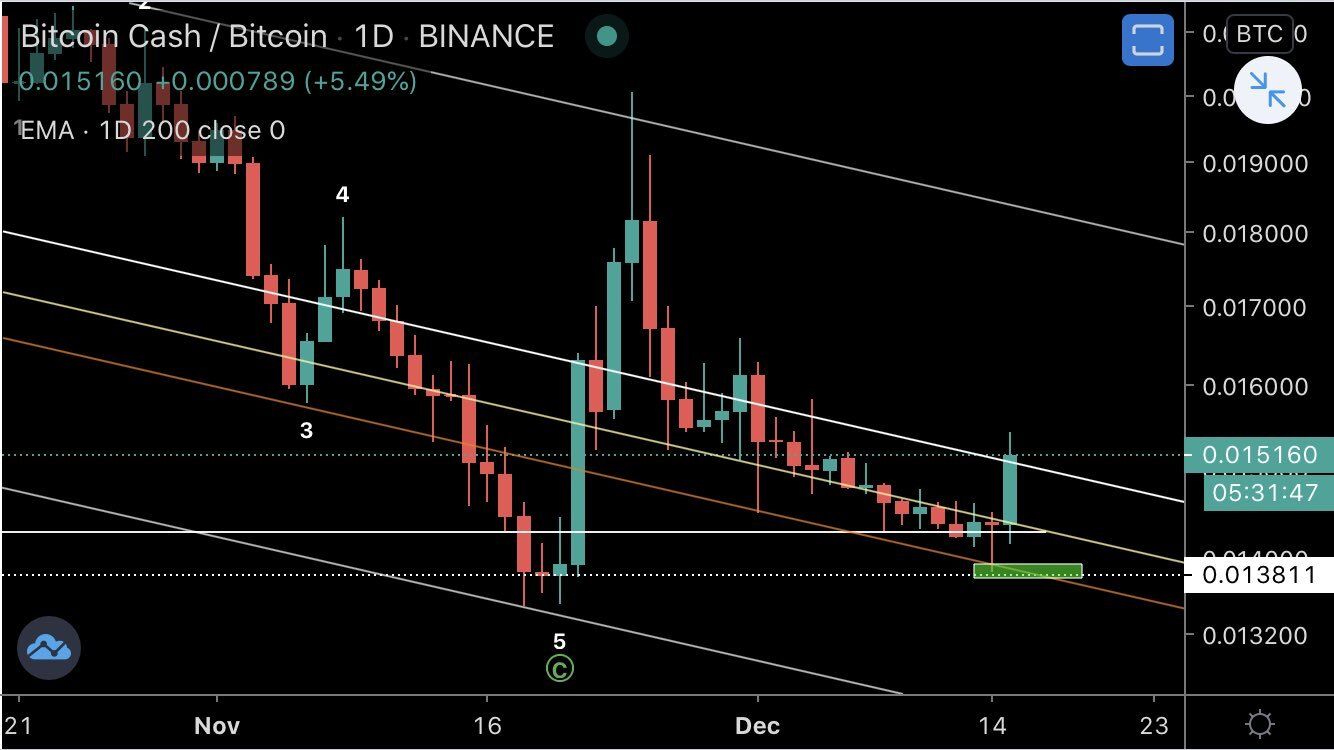
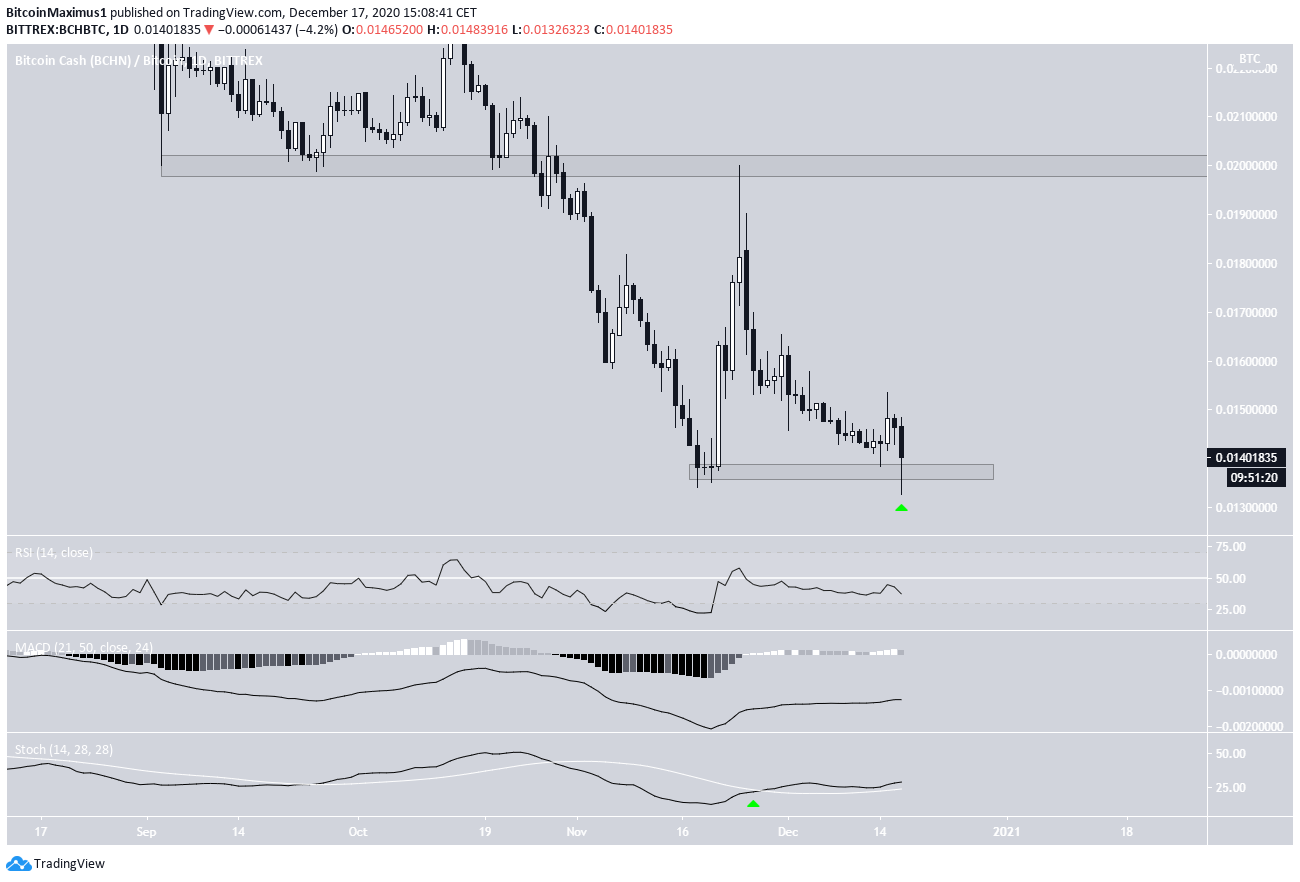
The BCH/BTC chart shows a bounce at the ₿0.013 support area and the subsequent validation in the form of a long lower wick. If BCH manages to hold above this area, it’s likely to increase towards ₿0.02.
The Stochastic Oscillator and MACD are bullish, supporting the possibility that BCH continues moving upwards, even though the RSI is still bearish.
Conclusion
To conclude, once BCH successfully reclaims the $320 level, the rate of increase is likely to accelerate as BCH moves towards the targets of $563 and $670.
For BeInCrypto’s previous Bitcoin (BTC) analysis, click here!
Disclaimer: Cryptocurrency trading carries a high level of risk and may not be suitable for all investors. The views expressed in this article do not reflect those of BeInCrypto.
