

Today marks the fourth month anniversary of the Bitcoin Cash (BCH) hard fork. We at BeInCrypto thought this would be a good time to look back on this historic moment. So let’s begin, shall we:
On Nov 15, 2018, Bitcoin Cash Satoshi’s Version (BCHSV) and Bitcoin Cash ABC (BCHABC) were born. This marked an important moment in the still continuing Bitcoin Cash Civil War. As both fights for dominance, we at BeInCrypto thought it would be a good time to look back and see what’s happened with these two cryptocurrencies since the divide.
Here’s the market outlook for BCH/BCHABC and BSV/BCHSV from Nov 15, 2018 to Mar 15, 2019:
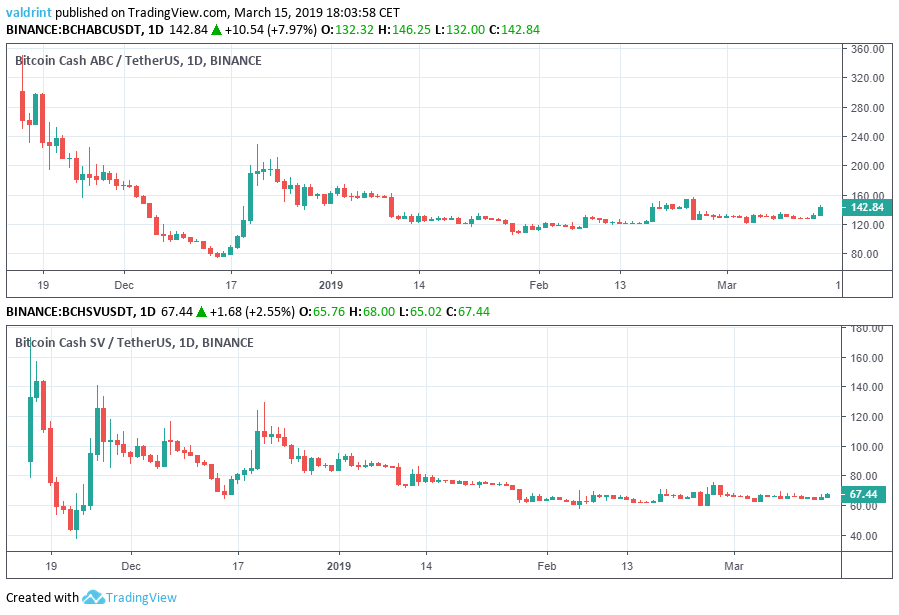 Now let’s take a look at how these two cryptocurrencies have performed over the last four months. First, let’s start with Bitcoin Cash ABC:
Bitcoin Cash ABC: Technical Analysis Nov 15, 2018 to Mar 15, 2019
Key Highlights
- The price opened Nov 16 at $301.
- It is currently trading at $143.5.
- The difference in value amounts to a 53% loss.
- The price made an absolute low on Dec 15 at $74.02.
- A rapid increase ensued which took it to $229.38 on Dec 21.
- It is currently trading inside an ascending triangle.
- There is resistance near $200.
- There is support near $80.
Previous Movement
The price of BCHABC on Binance is analyzed at six-hour intervals from November 16, 2018 to March 15, 2019. The price opened at $301 on Nov 16. A gradual decrease ensued before it intensified on Dec 3.
The price made a bottom at $74.02 on Dec 15.
A rapid increase took the price back to $229.38 on Dec 21.
A gradual decrease followed, with the price stabilizing at $158. On Jan 10, a sharp drop ensued and created a trading pattern.
The price opened at $301 on Nov 16. A gradual decrease ensued before it intensified on Dec 3.
The price made a bottom at $74.02 on Dec 15.
A rapid increase took the price back to $229.38 on Dec 21.
A gradual decrease followed, with the price stabilizing at $158. On Jan 10, a sharp drop ensued and created a trading pattern.
Horizontal Resistance
The price made a high of $158.3 on Jan 10, 2019. A sharp drop ensued. It revisited the same level again on Feb 24. Tracing these highs gives us a horizontal resistance line.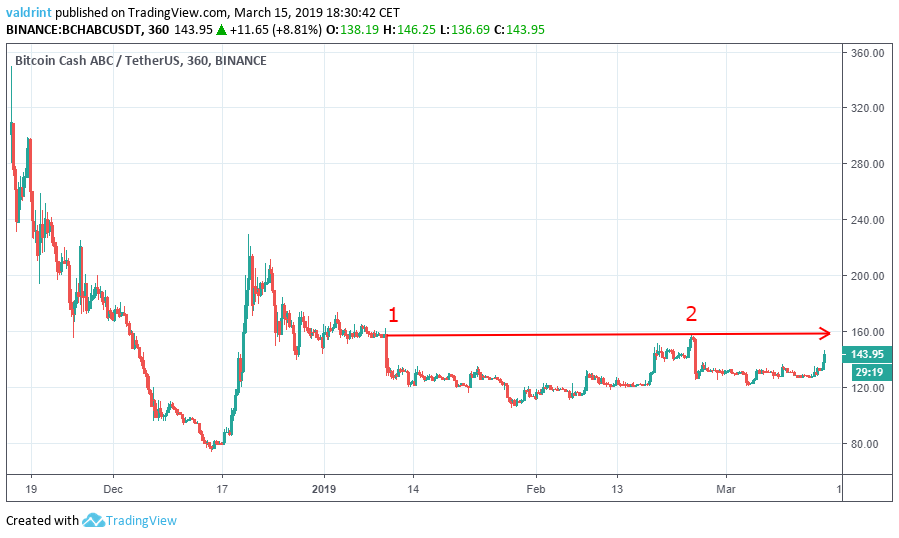 The resistance line acts as a ceiling to price, preventing further upward movement. It is supposed to trace the theoretical upper limits of the price.
Based on this resistance line, it is unlikely that the price trades above the $158 level unless a breakout occurs. The resistance line alone is not sufficient in predicting when a breakout will occur.
The resistance line acts as a ceiling to price, preventing further upward movement. It is supposed to trace the theoretical upper limits of the price.
Based on this resistance line, it is unlikely that the price trades above the $158 level unless a breakout occurs. The resistance line alone is not sufficient in predicting when a breakout will occur.
Ascending Triangle
The price made a low of $104.87 on Jan 28. 2019. It has continued to create higher lows since. Tracing these lows gives us an ascending support line. Similar to the resistance line, the support line acts as a floor to price, preventing further downward movement. It also measures the rate of increase.
Price has increased at the same rate as predicted by the ascending support line.
The support and resistance lines combine to create an ascending triangle, which is a bullish pattern making price increases more likely.
Based on the triangle and prior market movement, it is likely that the price trades inside the ascending triangle until a point of convergence occurs when the price is likely to break out.
Similar to the resistance line, the support line acts as a floor to price, preventing further downward movement. It also measures the rate of increase.
Price has increased at the same rate as predicted by the ascending support line.
The support and resistance lines combine to create an ascending triangle, which is a bullish pattern making price increases more likely.
Based on the triangle and prior market movement, it is likely that the price trades inside the ascending triangle until a point of convergence occurs when the price is likely to break out.
Future Movement
Resistance and support areas are created when the price visits the same level several times. They are helpful in predicting potential reversal areas once a breakout occurs.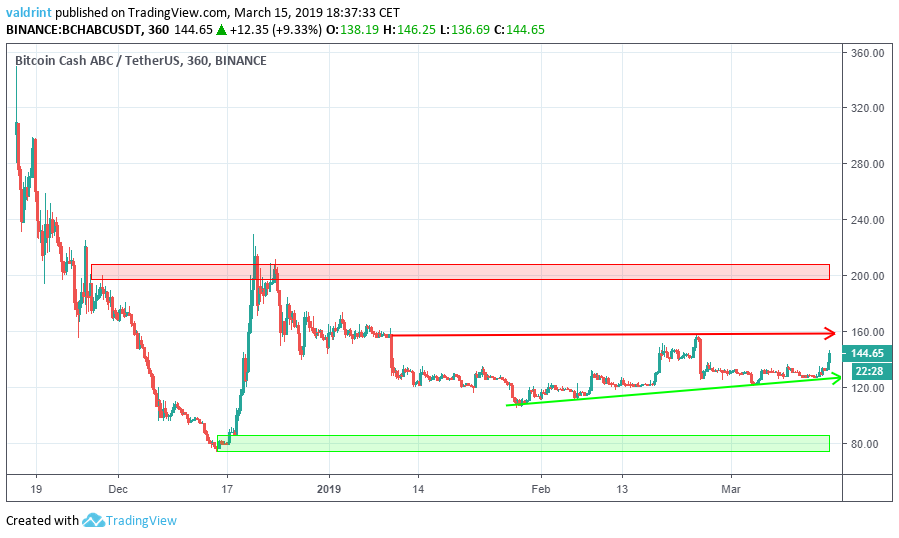 The first resistance area is found near $200. If the price breaks out of the triangle, this would provide a likely reversal area. Based on our analysis, it is likely that the price will eventually reach this level.
The closest support area is found near $80. If a breakdown were to occur, this would provide a likely reversal area. Based on our analysis, it is unlikely that the price will reach this level.
Now let’s take a look at Bitcoin Cash SV:
The first resistance area is found near $200. If the price breaks out of the triangle, this would provide a likely reversal area. Based on our analysis, it is likely that the price will eventually reach this level.
The closest support area is found near $80. If a breakdown were to occur, this would provide a likely reversal area. Based on our analysis, it is unlikely that the price will reach this level.
Now let’s take a look at Bitcoin Cash SV:
Bitcoin Cash SV: Technical Analysis from Nov 15, 2018 to Mar 15, 2019
Key Highlights
- The price opened at $89.74 on Nov 16.
- It reached a high of $172.99 the same day.
- It is currently trading at $67.54.
- The difference between opening and current prices represents a loss of 24.7%.
- The price reached a low of $42.82 on Nov 22.
- A rapid upward move took it to a high of $139 on Nov 26.
- It is currently trading inside an ascending triangle.
- There are resistance areas near $90 and $110.
- There is support near $40.
Previous Movement
The price of BCHSV on Binance is analyzed at six-hour intervals from November 16, 2018 to March 15, 2019.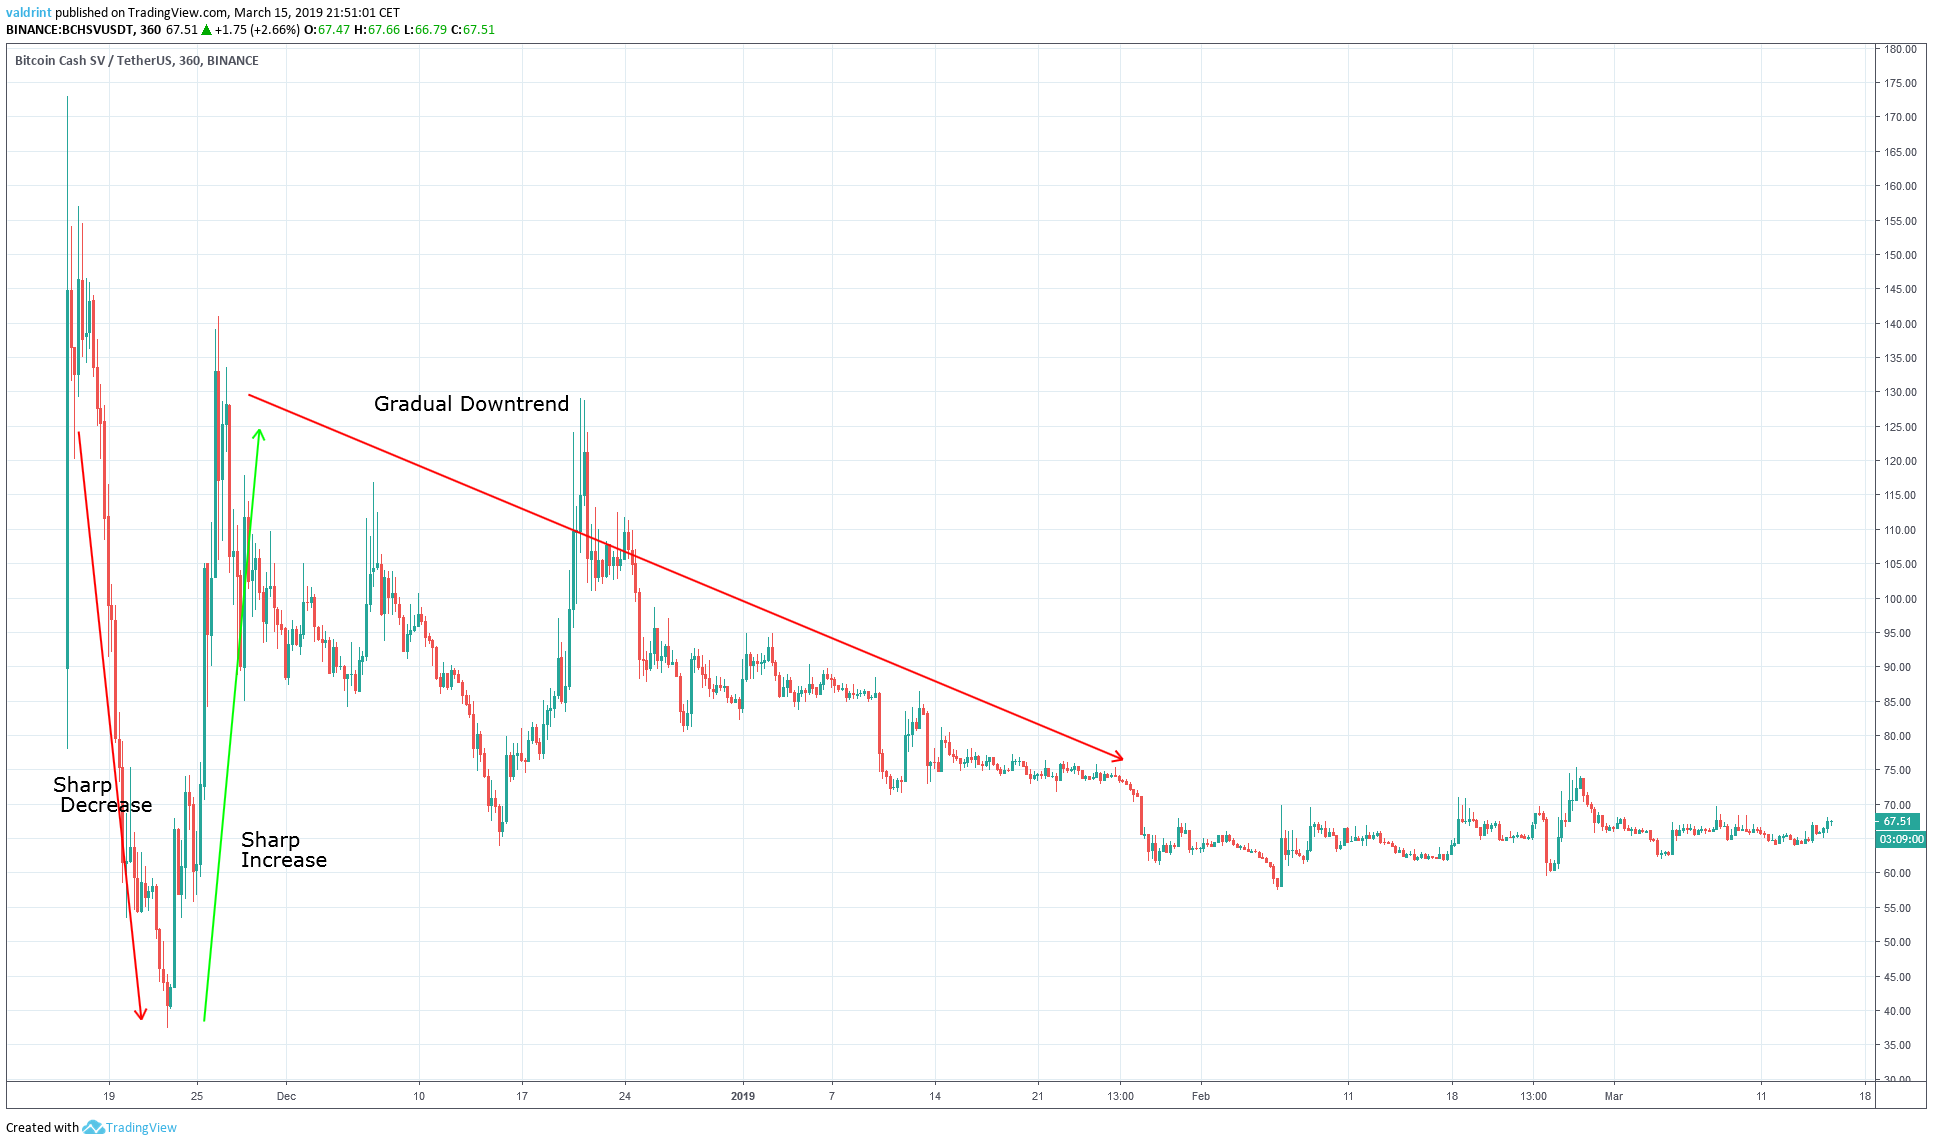 The price opened at $89.74 on Nov 16. Initially, the outlook was positive as the price reached a high of $172.99 the same day.
However, a rapid downward move was initiated, which dropped it all the way to $42.82 on Nov 22.
Another sharp rebound brought the price back to $141 on Nov 26.
Since then, the price has been following a gradual downtrend with some fluctuations. until Jan 26, when a sharp decline intensified the downtrend leading to more pronounced price losses. This drop initiated a trading pattern.
The price opened at $89.74 on Nov 16. Initially, the outlook was positive as the price reached a high of $172.99 the same day.
However, a rapid downward move was initiated, which dropped it all the way to $42.82 on Nov 22.
Another sharp rebound brought the price back to $141 on Nov 26.
Since then, the price has been following a gradual downtrend with some fluctuations. until Jan 26, when a sharp decline intensified the downtrend leading to more pronounced price losses. This drop initiated a trading pattern.
Resistance line
The price reached a stable level of $73 throughout most of January. A sharp drop ensued on Jan 26. The price made another high of $73 on Feb 26. Tracing these highs gives us a horizontal resistance line.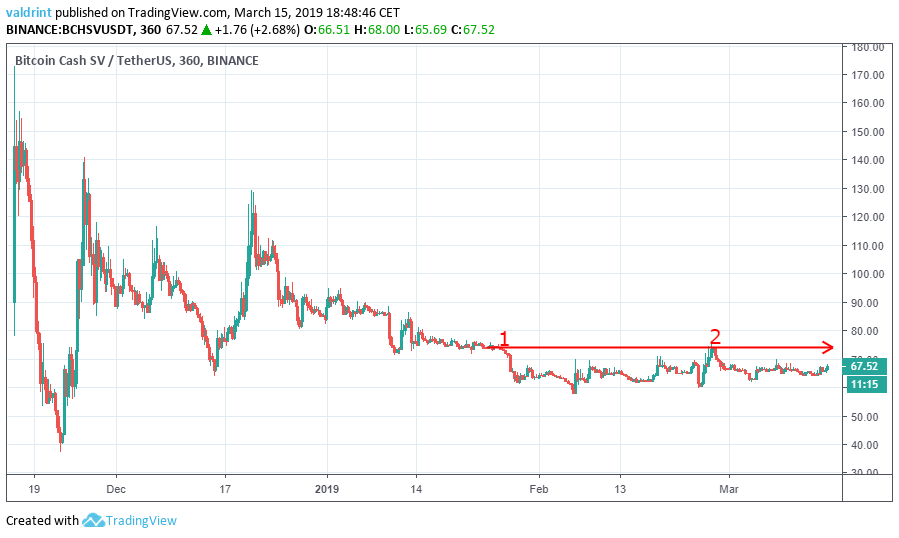 The resistance line acts as a ceiling to price, preventing further upward movement.
It is unlikely that the price will reach a level above $76 unless a breakout occurs. The resistance line alone is not sufficient in predicting when a breakout will occur.
The resistance line acts as a ceiling to price, preventing further upward movement.
It is unlikely that the price will reach a level above $76 unless a breakout occurs. The resistance line alone is not sufficient in predicting when a breakout will occur.
Support Line
The price made a low of $65 on Feb 6. Since then it has continued to create successive higher lows. Tracing these lows gives us an ascending support line.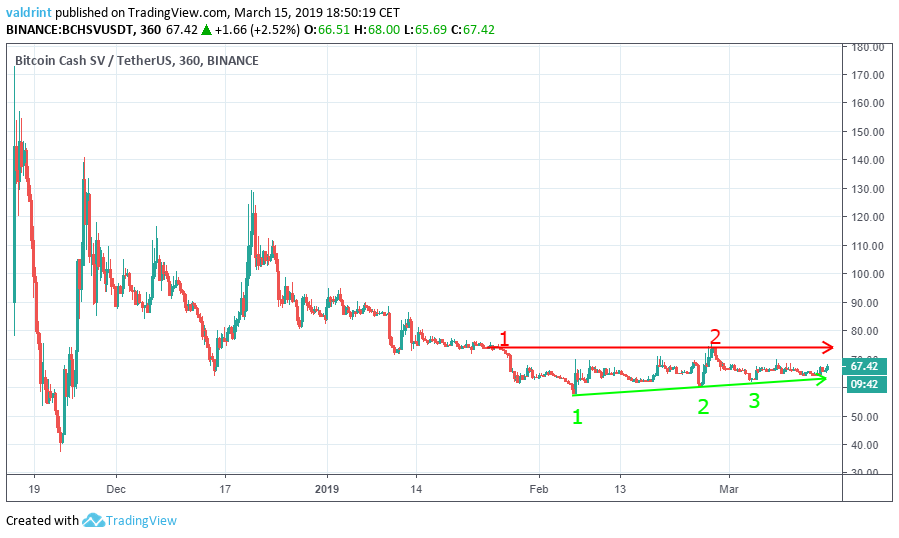 Similar to the resistance line, the support line acts as a floor to price, preventing further downward movement.
The support and resistance lines combined create an ascending triangle, which is a bullish pattern, making price increases more likely.
Based on this triangle, it is likely that the price trades within the confines of the triangle until a point of convergence occurs, when the price is likely to break out.
Similar to the resistance line, the support line acts as a floor to price, preventing further downward movement.
The support and resistance lines combined create an ascending triangle, which is a bullish pattern, making price increases more likely.
Based on this triangle, it is likely that the price trades within the confines of the triangle until a point of convergence occurs, when the price is likely to break out.
Future Movement
Resistance and support areas are created when the price visits the same level several times. They are helpful in predicting potential reversal areas once a breakout occurs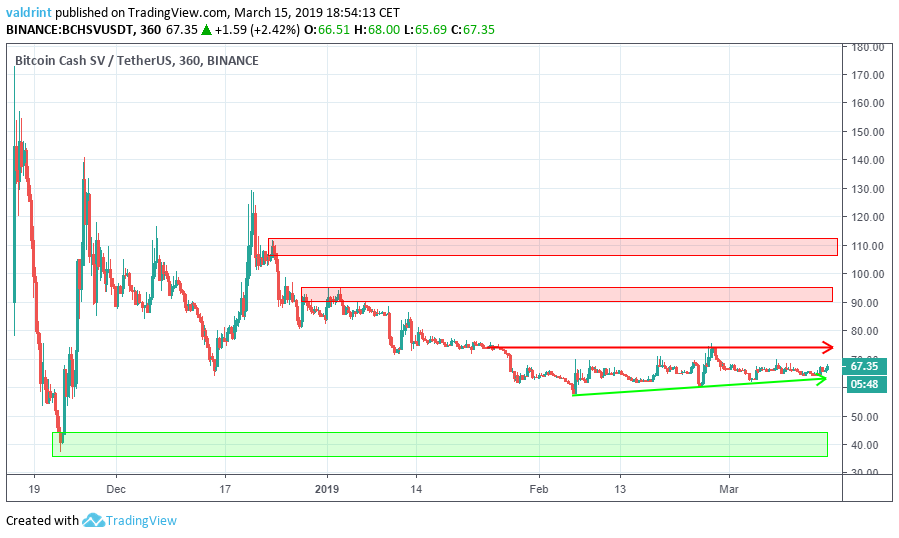
Summary of Analysis
Both BCHABC and BCHSV have lost significant value since the day of the drop. However, BCHSV has fared better, losing only 24.7%. BCHABC, on the other hand, lost more than twice this amount—losing 57% of its value. However, the future looks bright for both as they trade within their own respective bullish patterns. Which of the two coins do you think will reach the prices of Nov 16 first? Why? Let us know in the comments below.Interested in Bitcoin? Click Here for Our In-Depth BTC Analysis!
Disclaimer: This article is not trading advice and should not be construed as such. Always consult a trained financial professional before investing in cryptocurrencies, as the market is particularly volatile.Disclaimer
In line with the Trust Project guidelines, this price analysis article is for informational purposes only and should not be considered financial or investment advice. BeInCrypto is committed to accurate, unbiased reporting, but market conditions are subject to change without notice. Always conduct your own research and consult with a professional before making any financial decisions. Please note that our Terms and Conditions, Privacy Policy, and Disclaimers have been updated.

Valdrin Tahiri
Valdrin discovered cryptocurrencies while he was getting his MSc in Financial Markets from the Barcelona School of Economics. Shortly after graduating, he began writing for several different cryptocurrency related websites as a freelancer before eventually taking on the role of BeInCrypto's Senior Analyst.
(I do not have a discord and will not contact you first there. Beware of scammers)
READ FULL BIO
Sponsored
Sponsored