See More

Bitcoin Cash Showing Signs of Weakness (BCH/USD and BCH/EUR Price Analysis for 04/18/19)

3 mins
Updated by Valdrin Tahiri
Join our Trading Community on Telegram
At BeInCrypto, we offer regular price analyses and predictions of the most popular and relevant cryptoassets. In our April 16 analysis of Bitcoin Cash (BCH), we predicted short-term decreases. Our prediction was validated on Apr 18, when the price reached the support line of the triangle we defined. In this analysis, we take a look at BCH’s price in both euros and dollars to predict possible price fluctuations in BCH/USD($) and BCH/EUR(€).

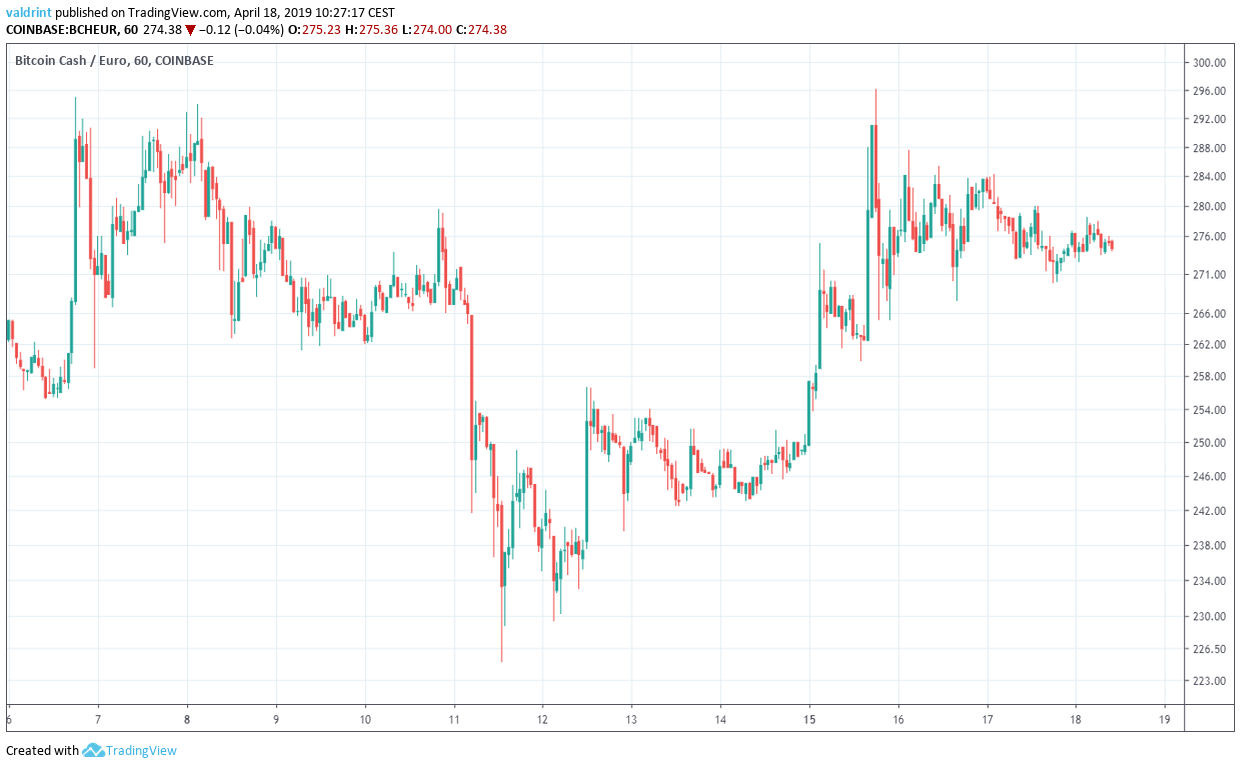
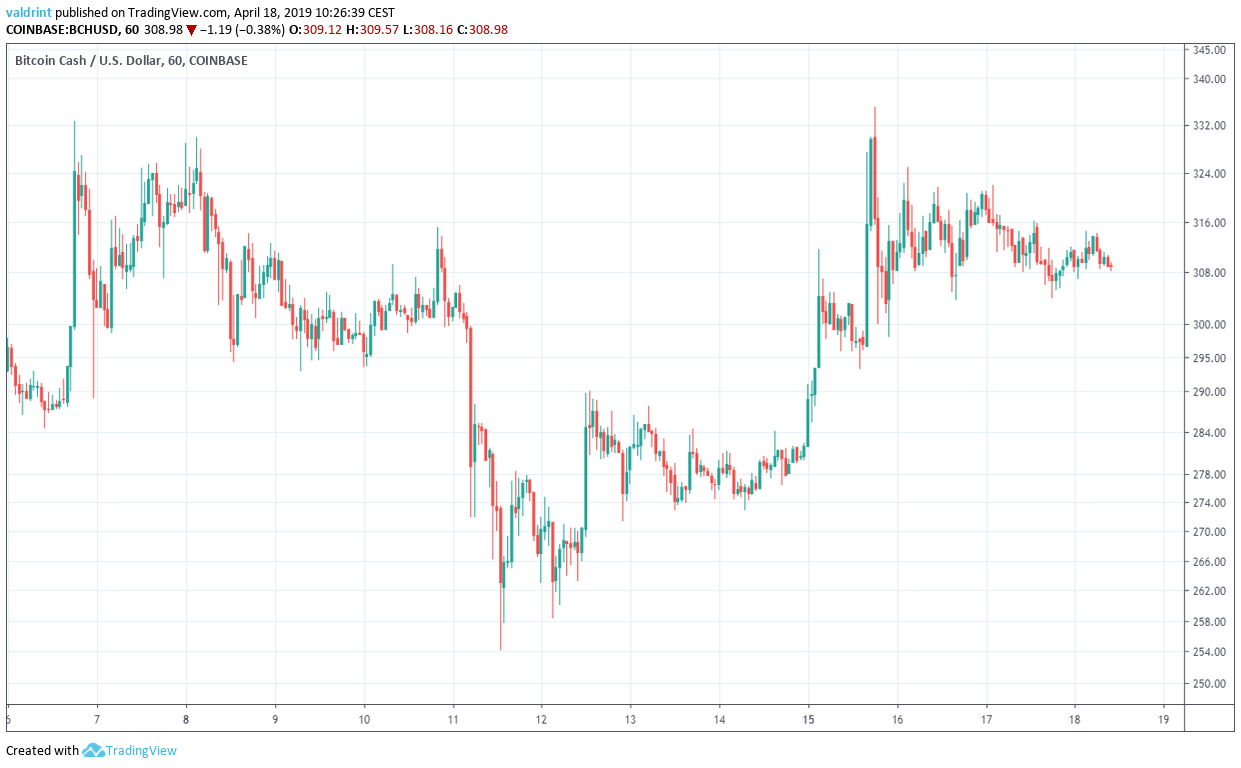
On Apr 6, the price reached a high of $333 and €298. It reached similar levels on Apr 8 and 15. It has been gradually decreasing since.
BCH Outlook
BCH/EUR Prices: Apr 6 – Apr 18
BCH Outlook
BCH/USD Prices: Apr 6 – Apr 18
              When will the decrease for Bitcoin Cash come to an end? Let’s find out:

Bitcoin Cash (BCH): Trends For April 18, 2019

  • The price of BCH reached similar highs on Apr 6, 8 and 15.
  • Bitcoin Cash is trading inside an ascending triangle.
  • Bearish divergence is developing in the RSI and the MACD.
  • There is support near $275 and $255.
  • There is support near €241 and €225.

Ascending Triangle

The price of BCH on Coinbase is analyzed at one-hour intervals from Apr 6 to Apr 18. This is done in order to trace the current trading pattern. In order not to create confusion, we will not be using images of the BCH/EUR pair until we address future possible price levels. There. the relevant resistance and support areas will be shown in dollars and euros.
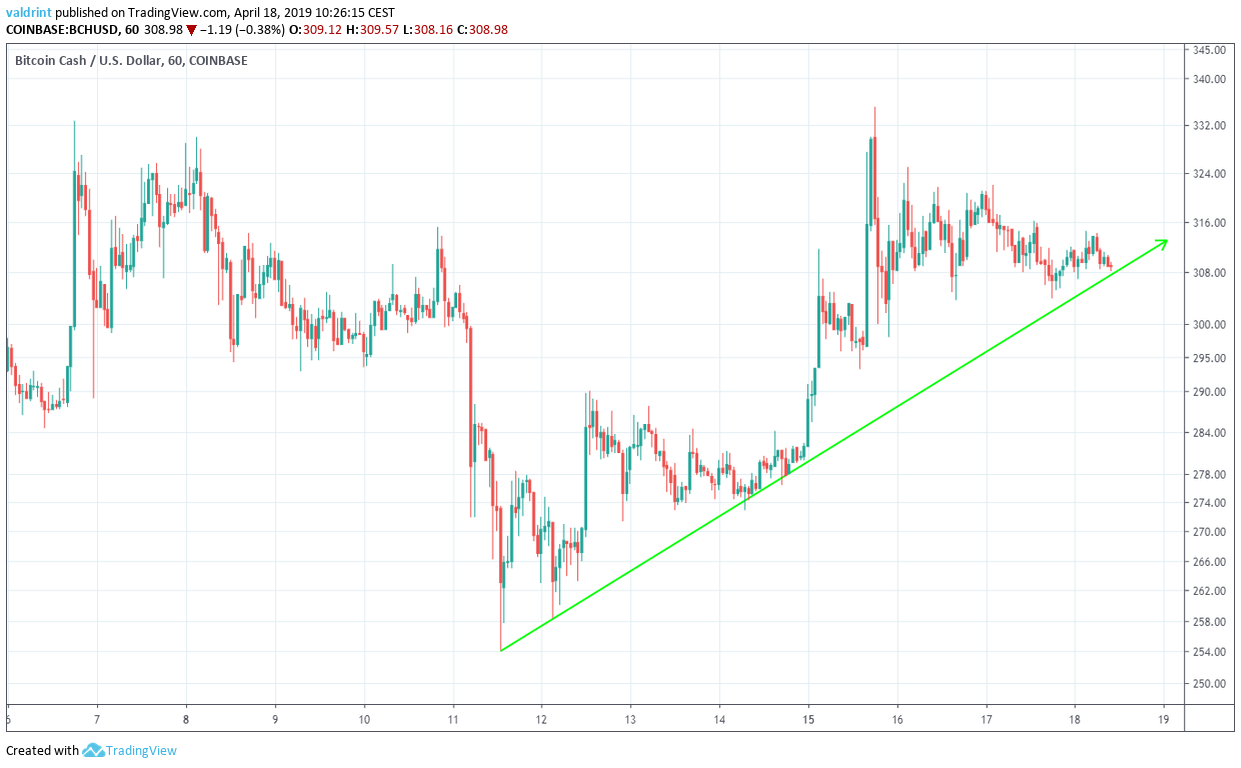
On Apr 11, the price reached an hourly low of $254.177. It has been gradually increasing since. The price has made several higher lows. Tracing these lows gives us an ascending support line: BCH Support Line On Apr 6, the price reached an hourly high of $332.63. Several market cycles have been completed, and the price has reached the same level three times. Tracing these highs gives us a horizontal resistance line. Together, the resistance and support lines combine to create an ascending triangle: BCH Triangle 
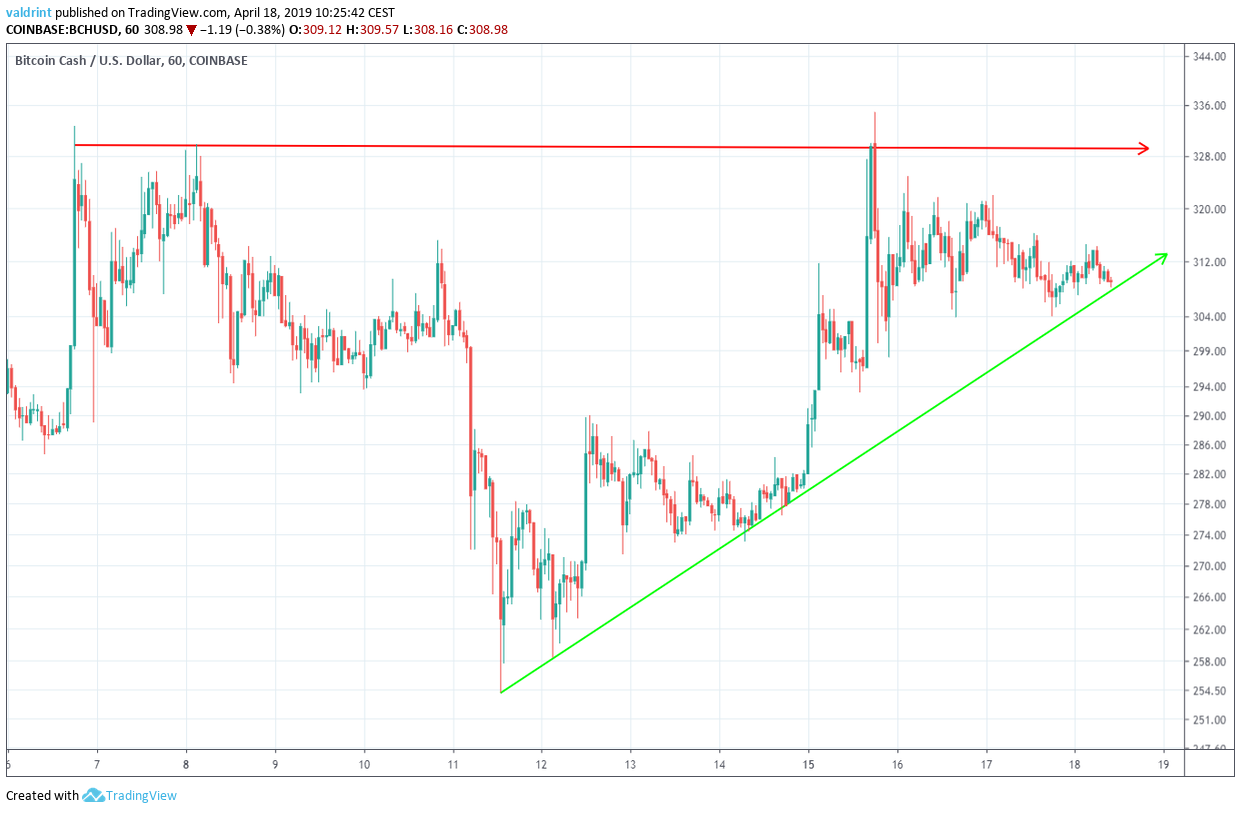
It is likely that the price will keep increasing at the rate predicted by the triangle until a decisive move occurs. In order to predict the direction of this move, a look at technical indicators is required.

Technical Indicators

The price of BCH/USD on Coinbase is analyzed at one-day intervals from Mar 21 to Apr 18 alongside the RSI and the MACD to assess possible future price fluctuations of Bitcoin.
The moving average convergence divergence (MACD) is a trend indicator that shows the relationship between two moving averages (long and short-term) and the price. It is used to measure the strength of a move.
The relative strength index (RSI) is an indicator which calculates the size of the changes in price in order to determine oversold or overbought conditions in the market.
These are shown in the graph below:
Bearish Divergence RSI
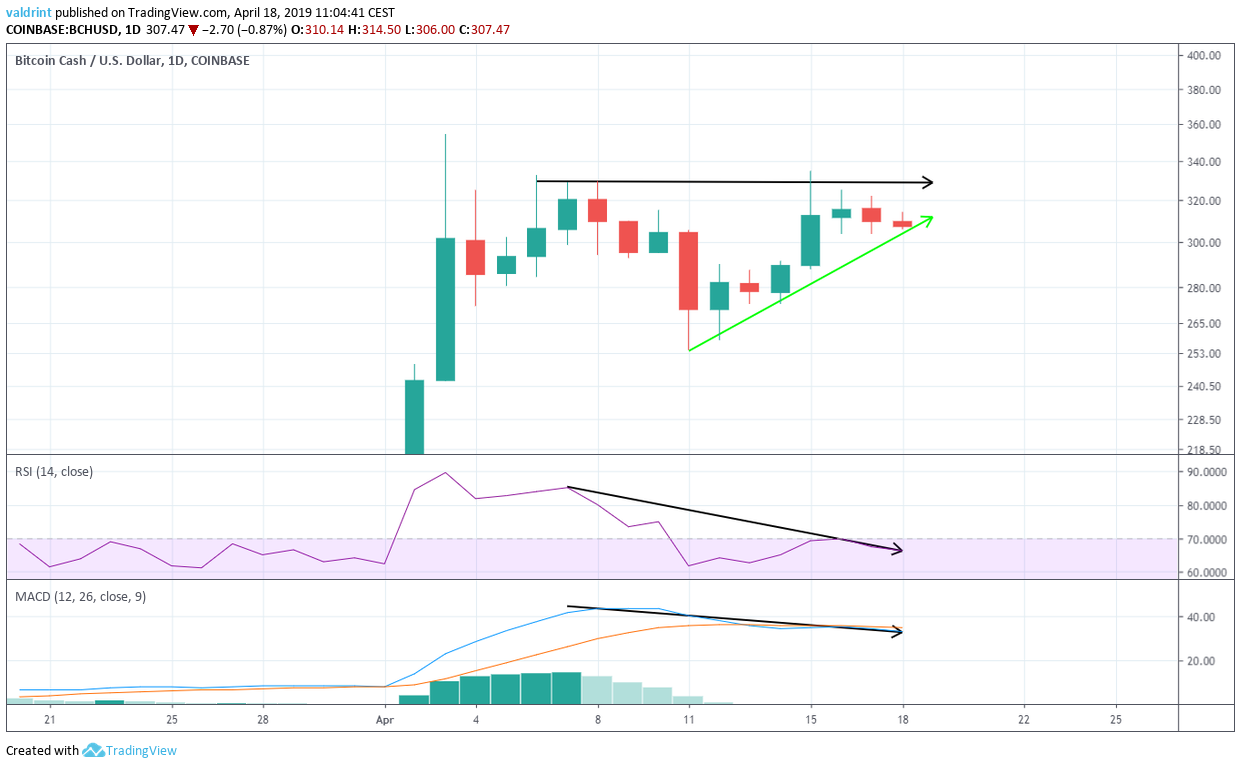
On Apr 6, the price made a high of $332.64. On Apr 15, it made another high of $335. Similarly, the RSI and the MACD made the first high on Apr 6. However, they have continued to generate lower values since. This is known as bearish divergence and often precedes price decreases. Using this indicator, it is unlikely that the price will break out from the triangle. A breakdown is possible.

Future Movement

To determine future price levels, we will look at possible resistance and support areas.
Support areas are created when the price revisits the same level several times. They can provide reversal areas in case a breakout/breakdown occurs.
These are shown for BCH/EUR and BCH/USD below.
EUR Reversal
BCH/EUR Support Areas
USD Reversal
BCH/USD Support Areas
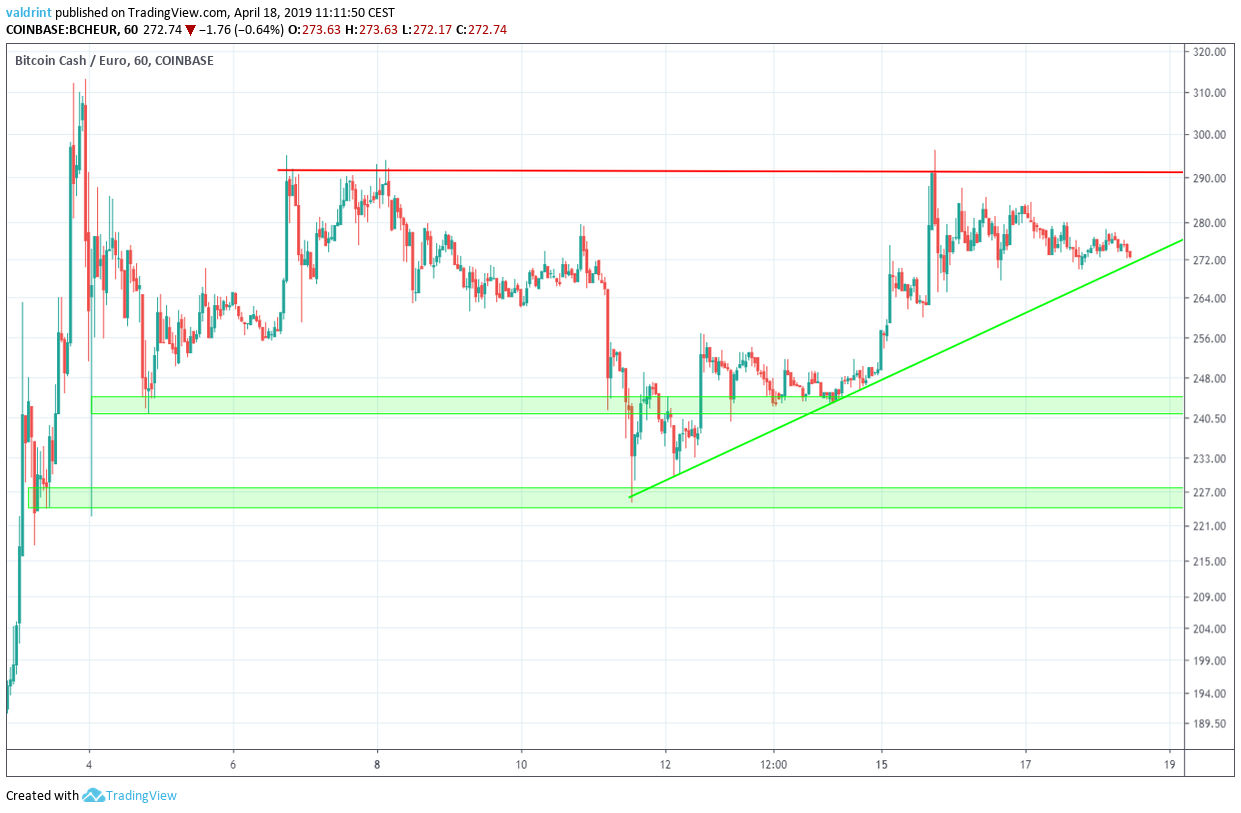
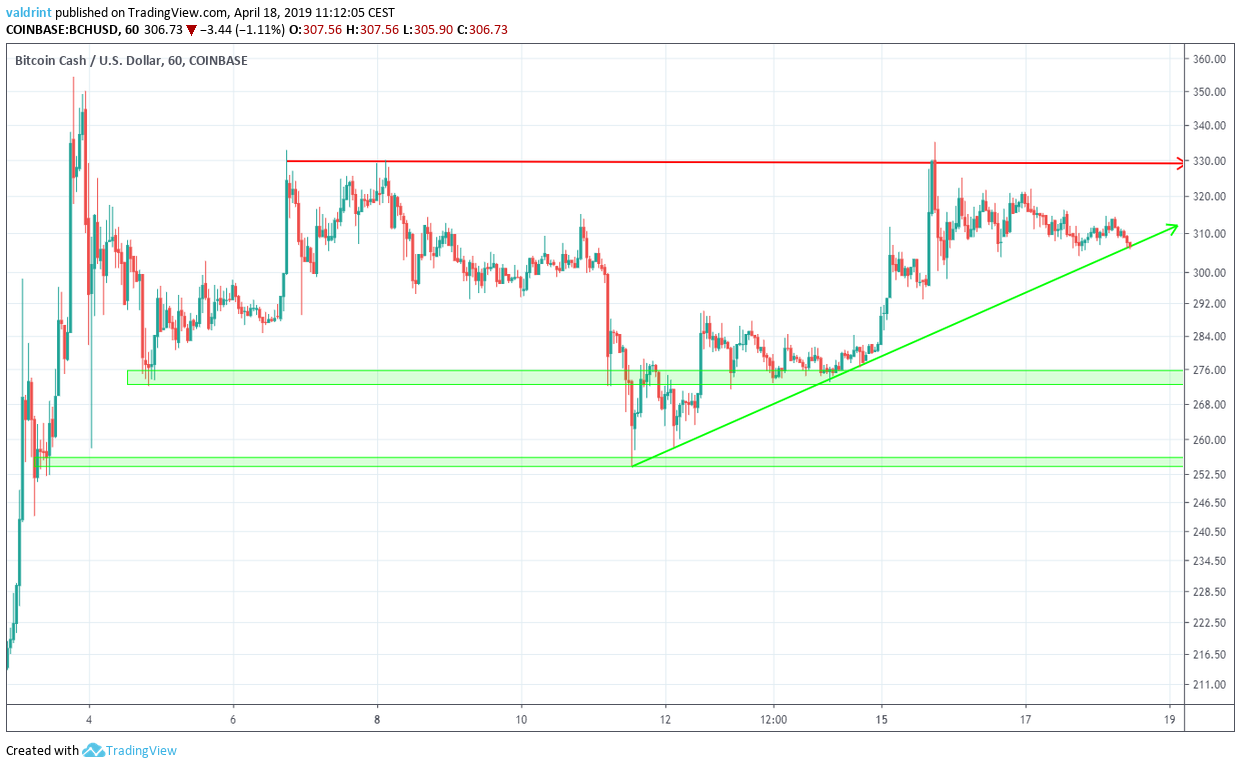
                The closest support area is found near $275 and €241. This is followed by the support area near $255 and €225. We believe that the price will eventually reach these areas.

Summary of Analysis

The price of BCH is likely to keep trading inside the confines of the ascending triangle. We believe that a breakout is unlikely. However, it is possible that short-term increases towards the resistance line will occur. Do you think Bitcoin Cash will break out from the triangle? Let us know your thoughts in the comments below. To read our 2019 and 2020 price predictions for Bitcoin Cash, click on the green button below: Disclaimer: This article is not trading advice and should not be construed as such. Always consult a trained financial professional before investing in cryptocurrencies, as the market is particularly volatile.
Top crypto projects in the US | April 2024

Trusted

Disclaimer

In line with the Trust Project guidelines, this price analysis article is for informational purposes only and should not be considered financial or investment advice. BeInCrypto is committed to accurate, unbiased reporting, but market conditions are subject to change without notice. Always conduct your own research and consult with a professional before making any financial decisions. Please note that our Terms and ConditionsPrivacy Policy, and Disclaimers have been updated.

Valdrin-Tahiri.jpg
Valdrin Tahiri
Valdrin discovered cryptocurrencies while he was getting his MSc in Financial Markets from the Barcelona School of Economics. Shortly after graduating, he began writing for several different cryptocurrency related websites as a freelancer before eventually taking on the role of BeInCrypto's Senior Analyst. (I do not have a discord and will not contact you first there. Beware of scammers)
READ FULL BIO
Sponsored
Sponsored