


The Basic Attention Token (BAT) price has possibly completed a bearish impulse pattern with a breakout from the descending wedge it had been trading in for the past month.
If true, the price is expected to continue moving upwards in either an upwards correction or a new bullish impulse.
BAT Reclaims Support
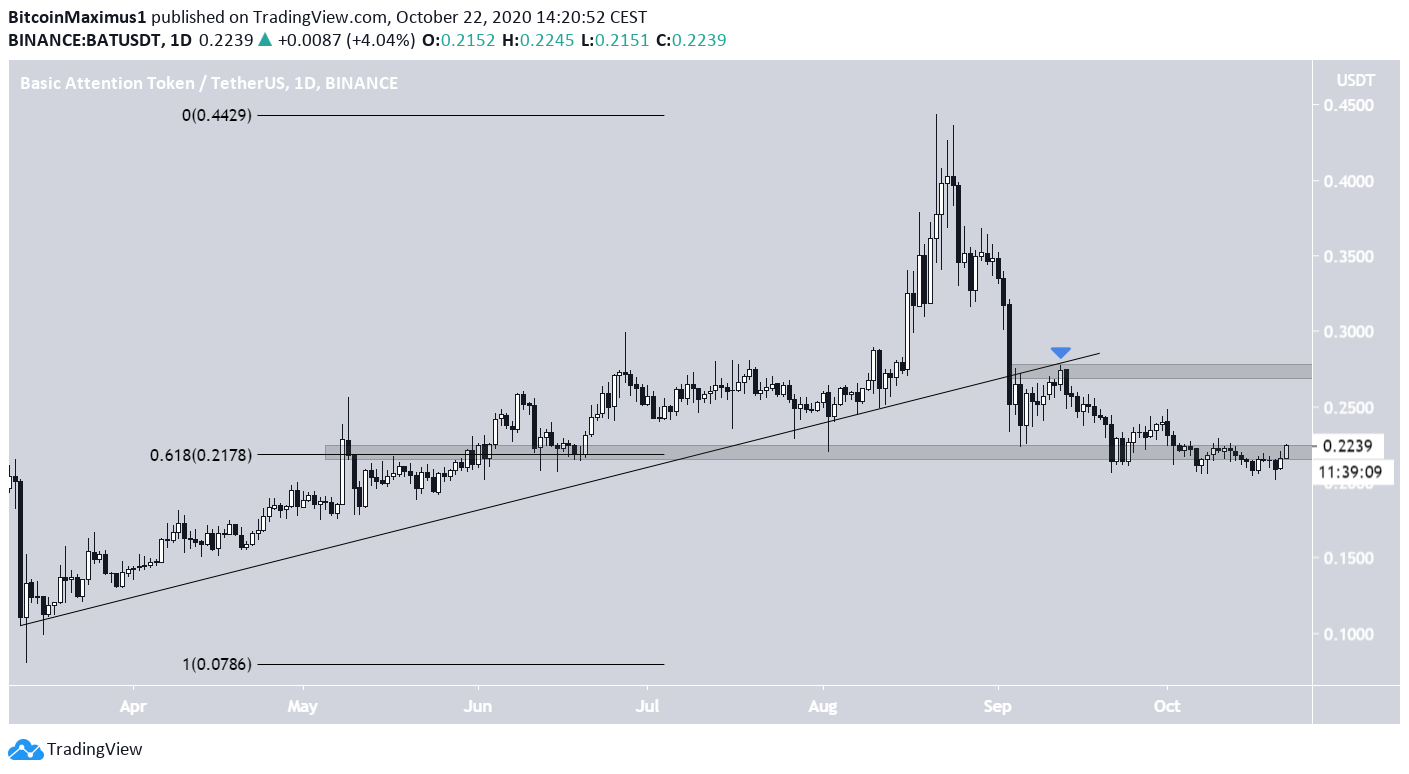
The BAT price has been moving downwards since it reached a high of $0.443 on Aug 21. The decrease was swift and caused a breakdown from an ascending support line that had previously been in place since the March 13 low.
After breaking down, the price validated the line as resistance and continued its descent until it reached a local low of $0.201 on Oct 20.
Currently, the price is trading very close to the $0.217 support area, which is also the 0.618 Fib level of the entire upward move. If the price begins moving upwards, the closest resistance area is found at $0.277, a level created by the highs that validated the aforementioned ascending support line.
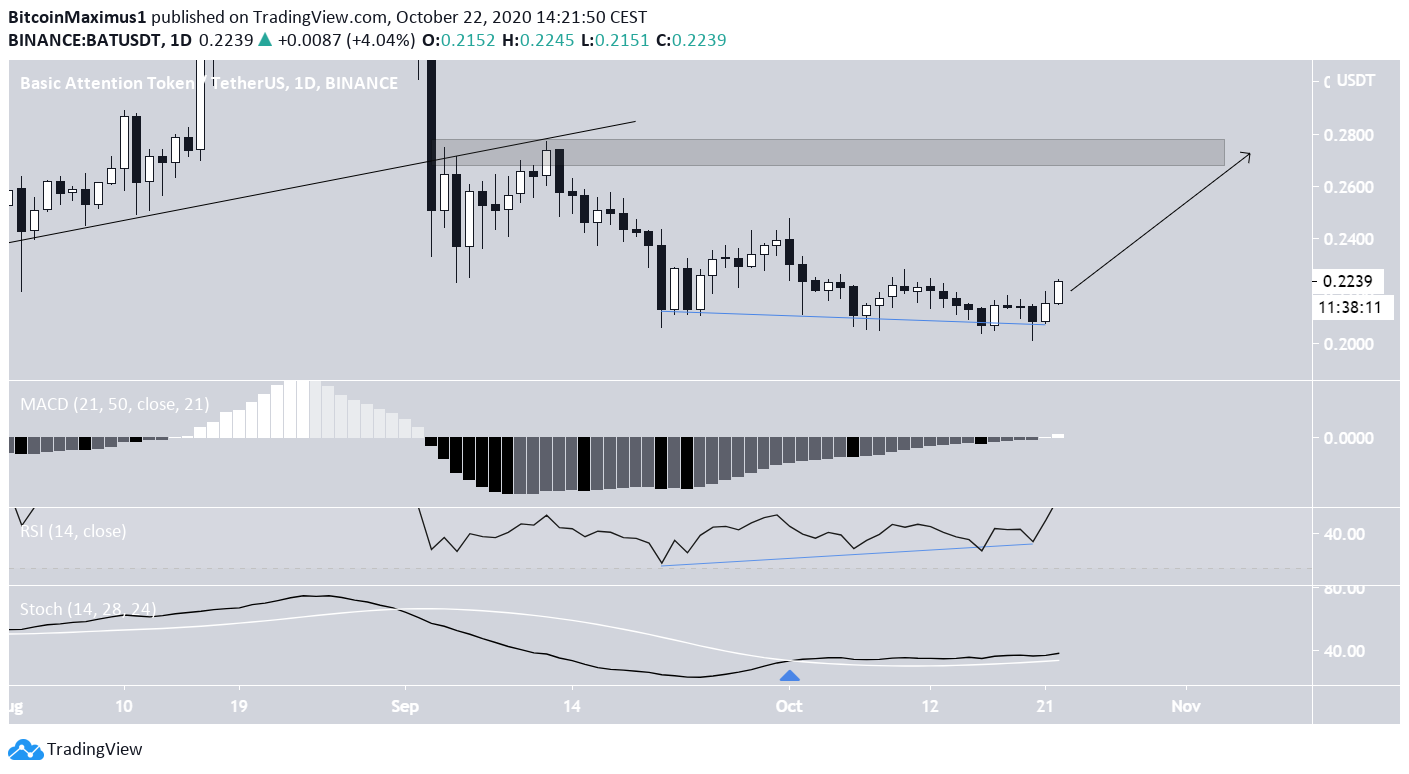
Technical indicators in the daily time-frame are quite bullish. Both the RSI and MACD are moving upwards after generating bullish divergence, and the latter has crossed into positive territory. Furthermore, the Stochastic Oscillator has made a bullish cross. These are signs that the price is expected to move upwards towards the $0.277 resistance area.
Wave Count
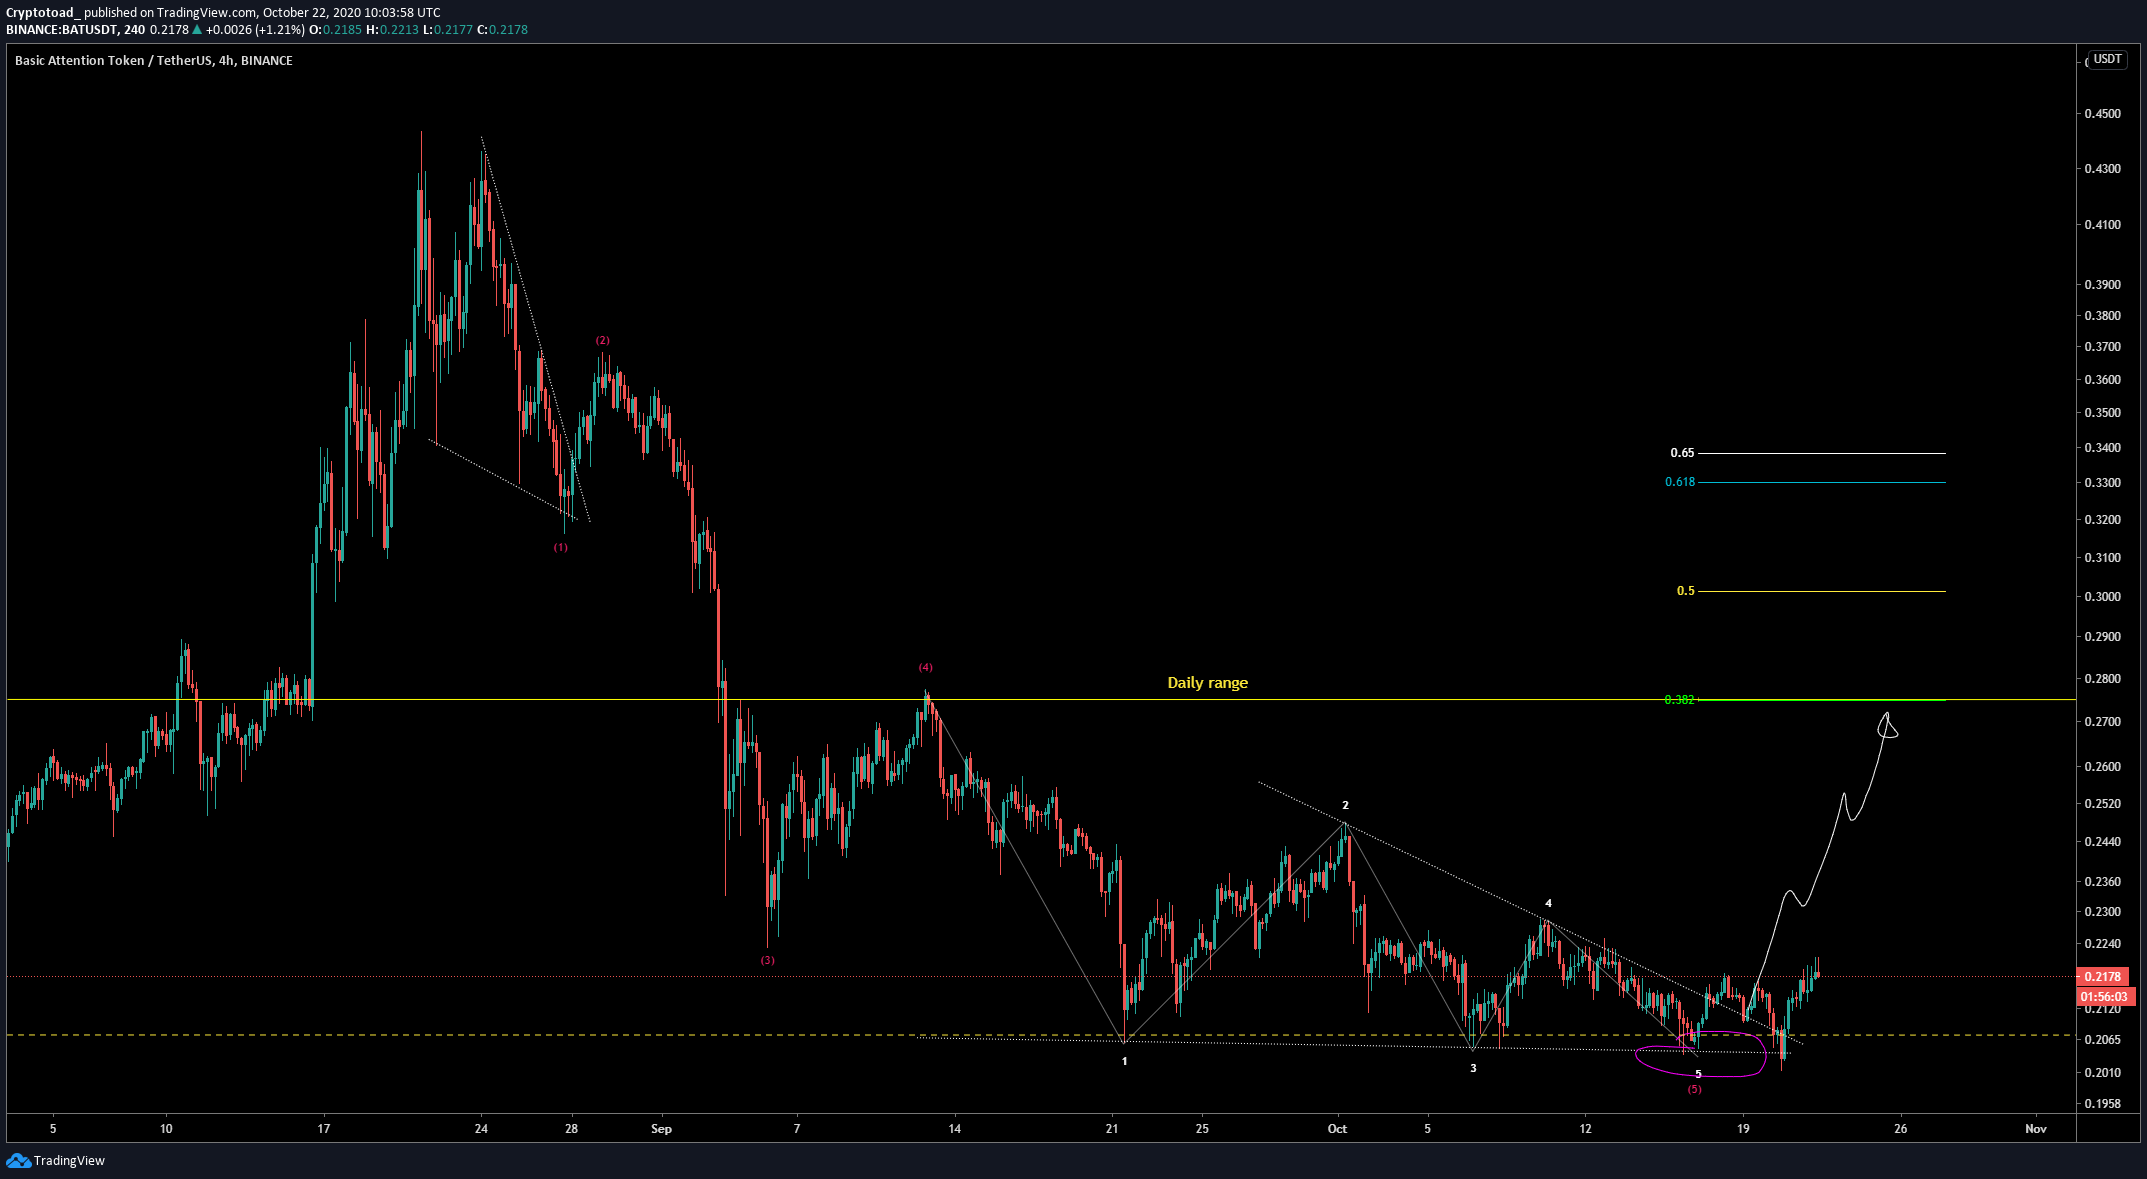
Cryptocurrency trader @Mesawine1 outlined a BAT chart, which shows a completed bearish impulse and a possible upward correction that could take the price to the range of $0.27-$0.33.
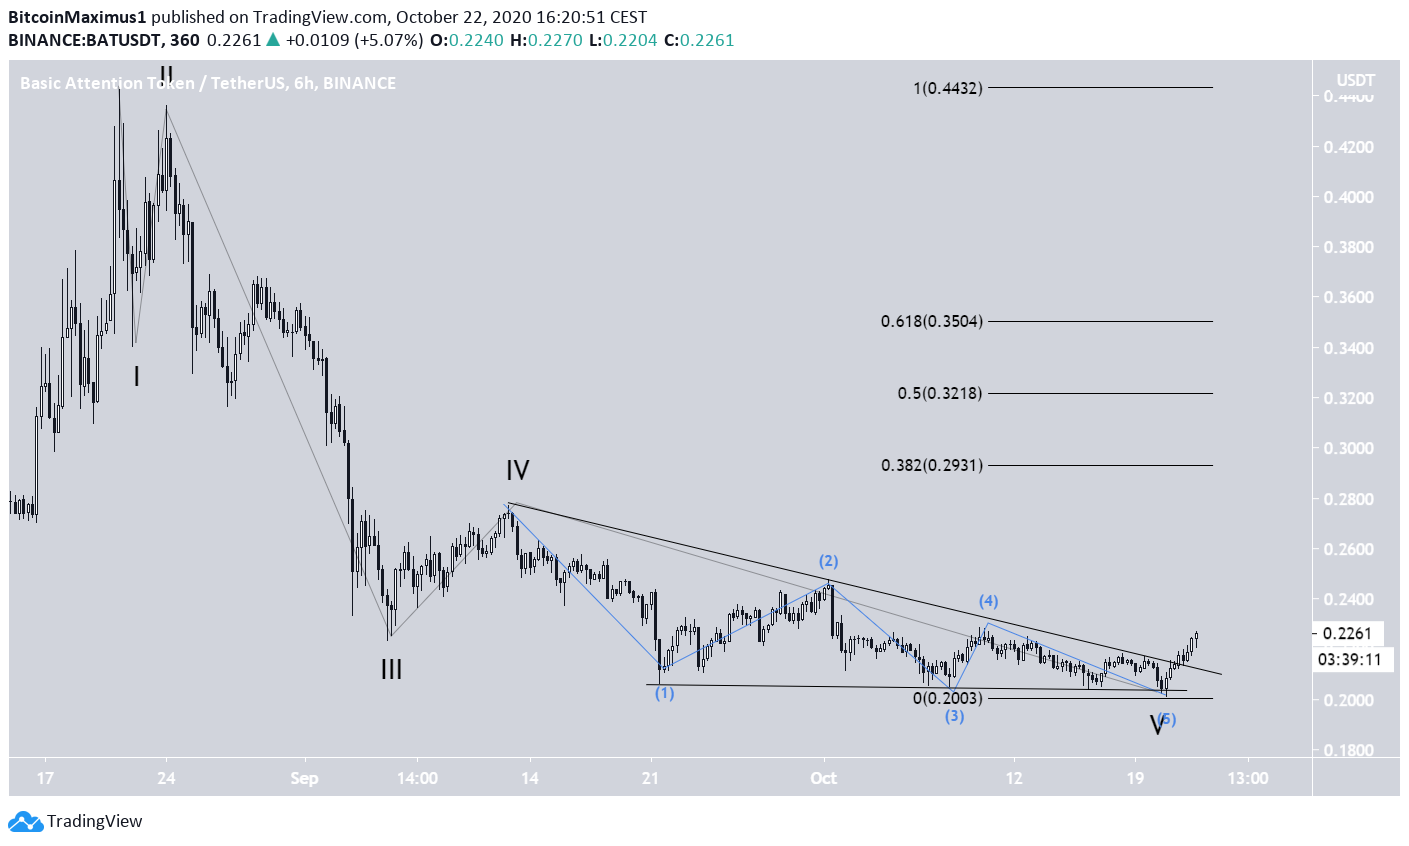
Since the Aug 21 high, the price seems to have completed a bearish impulse (shown in black below). In the impulse, the fifth wave transpired inside an ending diagonal (blue), hence the shape of the descending wedge.
Even though it is not yet certain if the move is a new bullish impulse or just a correction, both scenarios would have the price increasing towards at least the 0.382 Fib level of the entire decrease, and possibly even the 0.618 Fib level.
Therefore, three targets for the move would be at $0.29, $0.32, and $0.35, each higher than the previously mentioned resistance area.
For BeInCrypto’s previous Bitcoin analysis, click here!
Disclaimer: Cryptocurrency trading carries a high level of risk and may not be suitable for all investors. The views expressed in this article do not reflect those of BeInCrypto.


