


Dogecoin (DOGE) and Basic Attention Token prices (BAT) have been decreasing recently. The month of May has been characterized by gradual decreases without significant fluctuations.
Will this continue in June? Which one will increase more?
In order to answer these questions, we analyze the current short and medium-term movements of DOGE/BTC and BAT/BTC alongside an assessment of their technical indicators. In conclusion, we summarize our findings and compare both cryptocurrencies to see which has more potential for higher prices in the future.
Triangle for Dogecoin price (DOGE)
On May 6, DOGE reached a high of 45 satoshis. A decrease ensued and on May 13 the price reached a low of 35 satoshis.
Since then, the price has been trading inside the symmetrical triangle outlined below:
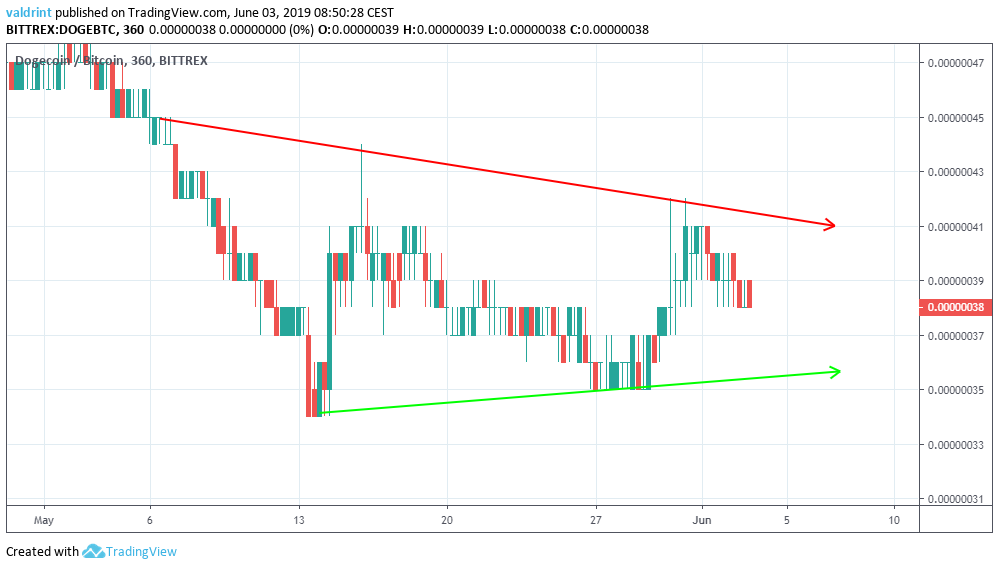
After a failed attempt at an upward move, the Dogecoin price (DOGE) again dropped to the support line on May 27. At the time of writing, DOGE was trading at 38 satoshis. Will the price break out from this triangle?
In order to answer that, we will analyze the price alongside the RSI and the 10- and 20-day moving averages (MA) below:
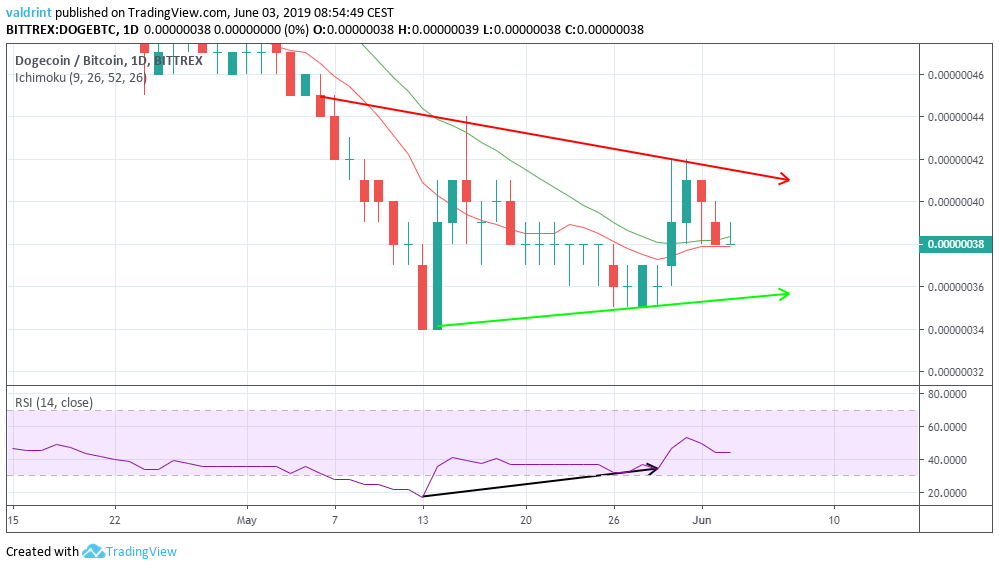
The price is trading above the 10- and 20-day MAs. However, a bullish cross has yet to occur.
Furthermore, during the lows of 34 and 35 satoshis on May 13 and 27, the RSI doubled in size from 17 to 34.
This can be read as bullish divergence, which often precedes price increases.
The use of these indicators makes it unlikely that the DOGE price will breakdown from the channel. Movement inside its confines and an eventual breakout are likely.
If that occurs, where will the price reverse?
Dogecoin Reversal Areas
In case of a breakout or breakdown, resistance and support areas can provide a possible reversal.
One resistance and support area is traced for DOGE below:
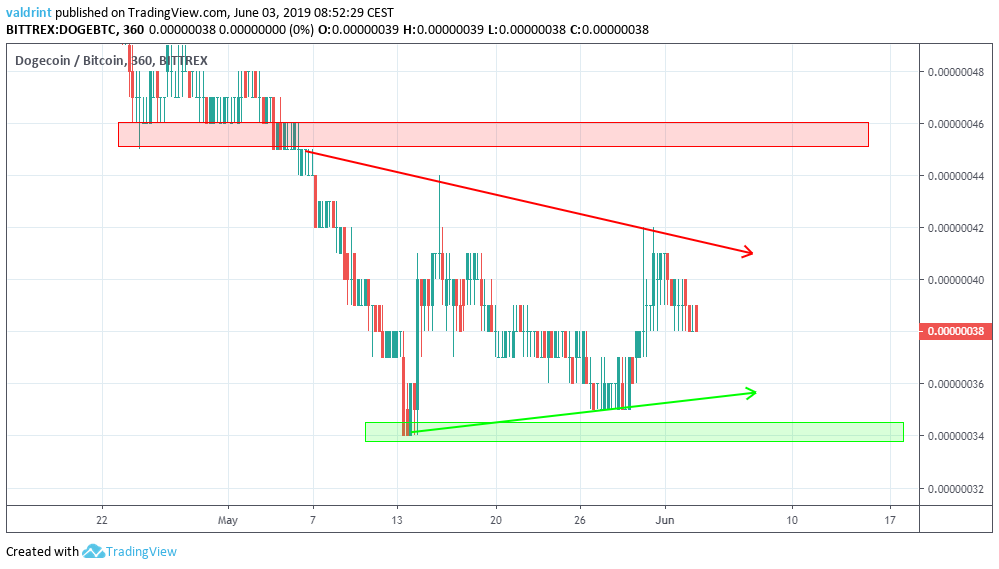
The closest resistance area is found near 45 satoshis. If the price breaks out from the triangle, it is likely to provide a reversal. We believe this to be likely, but not in the short-term. Rather, we believe that the price will continue to trade inside the confines of the triangle.
The closest support area is found near 34 satoshis. If the price breaks down from the triangle, it is likely to reach this area. We do not believe this will occur. However, it is worth noting that the price has not traded below this level since Dec. 2017.
BAT Inside a Descending Wedge
On May 10, the price of BAT reached a low of 4438 satoshis. A rapid upward move began and the price reached a high of 6010 satoshis the next day.
Since then, it has been decreasing, trading inside the descending wedge outlined below:
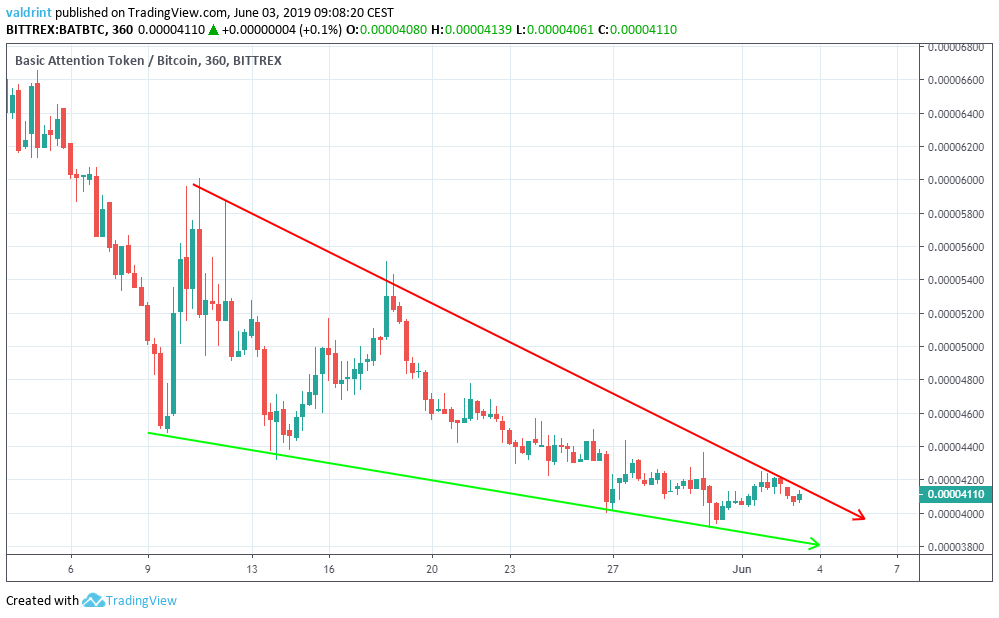
At the time of writing, BAT was trading at 4110 satoshis, very close to the resistance line of the wedge.
Additionally, it is approaching the end of the pattern. Will the price break out?
In order to determine that, BAT is analyzed alongside the RSI and the MACD below:
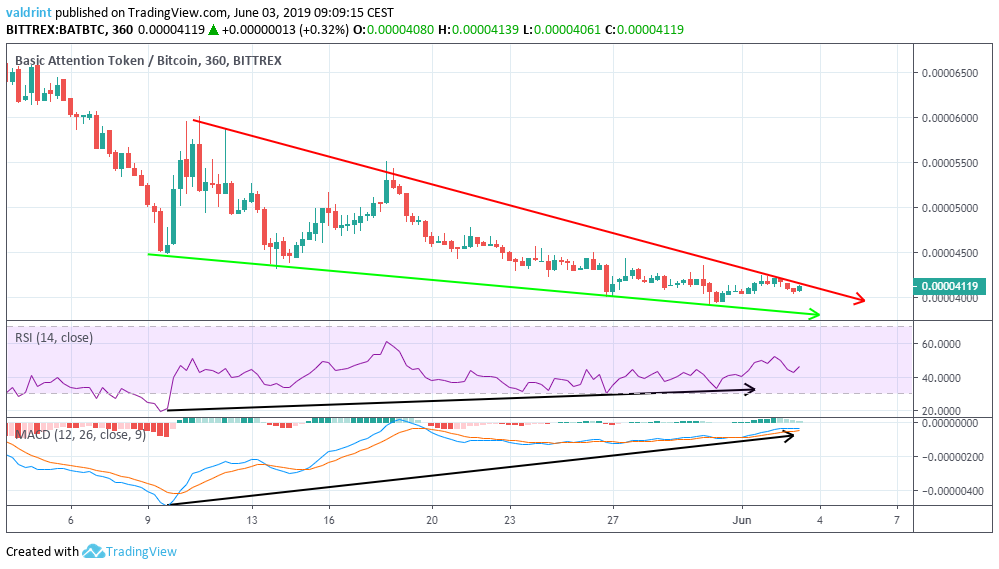
We stated that the BAT price reached a low on May 9, which marked the beginning of the wedge.
During this time, the RSI and the MACD have generated successively higher values.
This is known as bullish divergence and often precedes price increases.
The use of these indicators and the fact that the descending wedge is a bullish pattern makes it likely that a breakout will occur. If it does, where will the price reverse?
BAT Reversal Areas
In case of a breakout or breakdown, resistance and support areas can provide likely areas of reversal.
One resistance area is traced for BAT below:
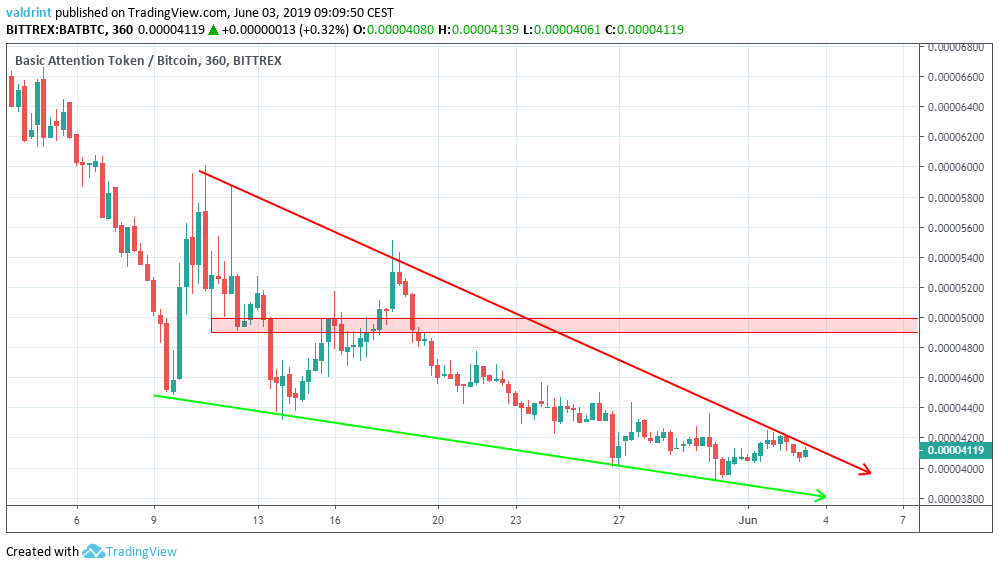
The closest resistance area is found near 5000 satoshis. If the price breaks out from the wedge, it is likely to reach this area. We believe that this is likely to occur.
Summary
To conclude, BAT is trading inside a bullish pattern while DOGE is in a neutral one.
Both of them have created bullish divergence since the creation of their respective patterns. However, this divergence is more pronounced in the case of BAT.
Furthermore, BAT is very close to the end of the pattern, while DOGE is not. Combined with the fact that the latter has been moving very slowly, we believe that BAT has the potential for higher increases, especially in the short-term.
A summary of our findings is presented in the table below:
| DOGE | BAT | Winner | |
| Trading Pattern | Symmetrical Triangle | Descending Wedge | BAT |
| Technical Indicators | Bullish Divergence In The RSI | Bullish Divergence in the RSI and the MACD | BAT |
Do you think the price of Dogecoin initiates a decisive move? Will BAT break out? Leave your thoughts in the comments below:
Disclaimer: This article is not trading advice and should not be construed as such. Always consult a trained financial professional before investing in cryptocurrencies, as the market is particularly volatile.


