
The BAT price broke out from a descending resistance line on February 4. After validating the line as support on February 9, the BAT price began to move upwards.
BAT Highlights
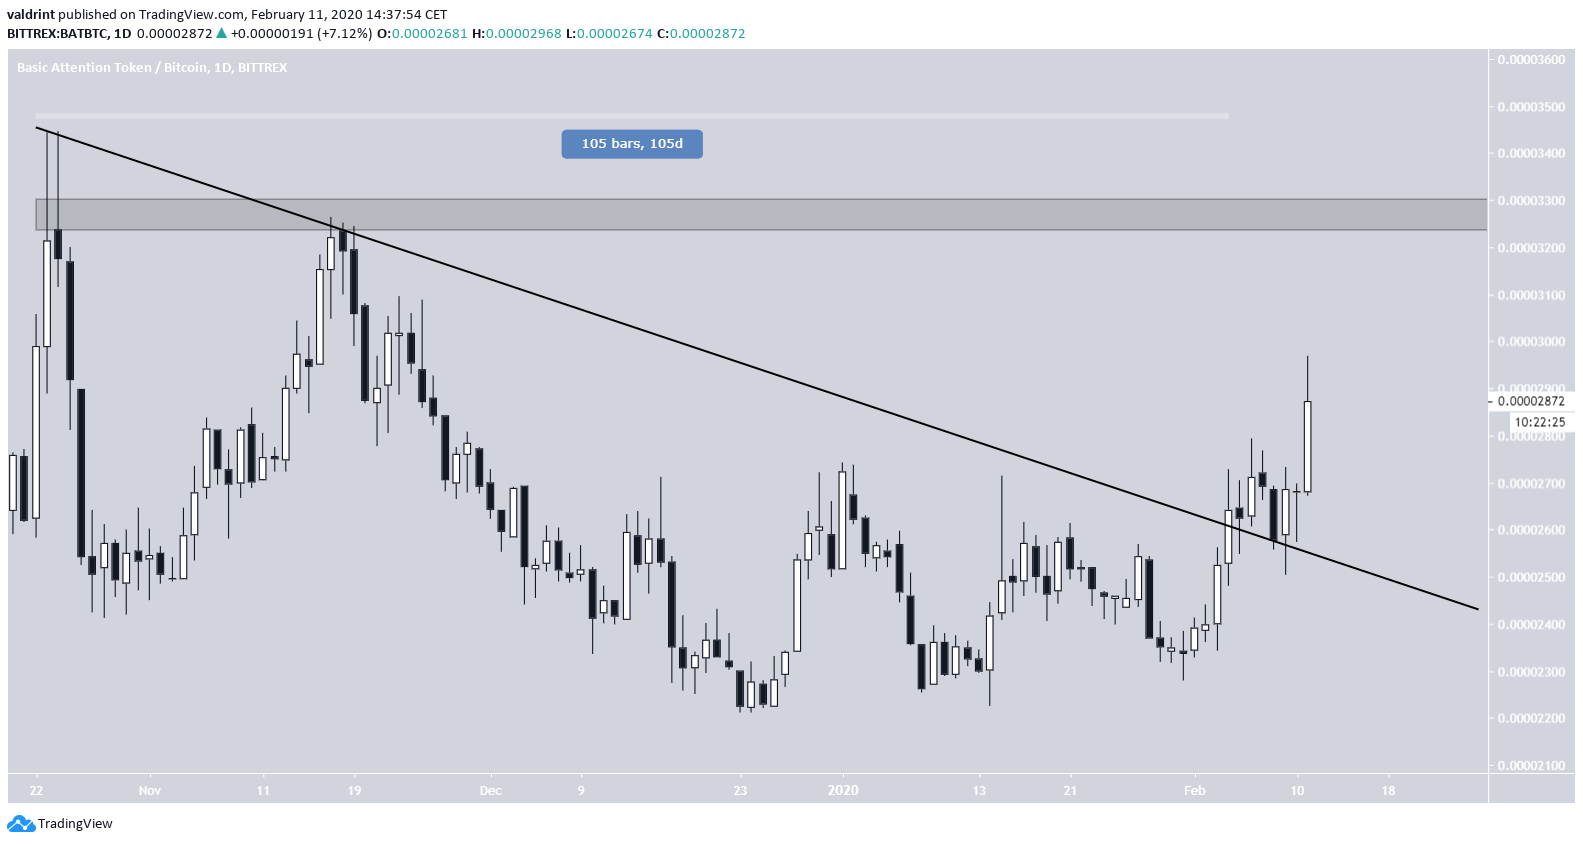
- The BAT price broke out from a 105-day resistance line.
- There is resistance between 3200-3300 satoshis.
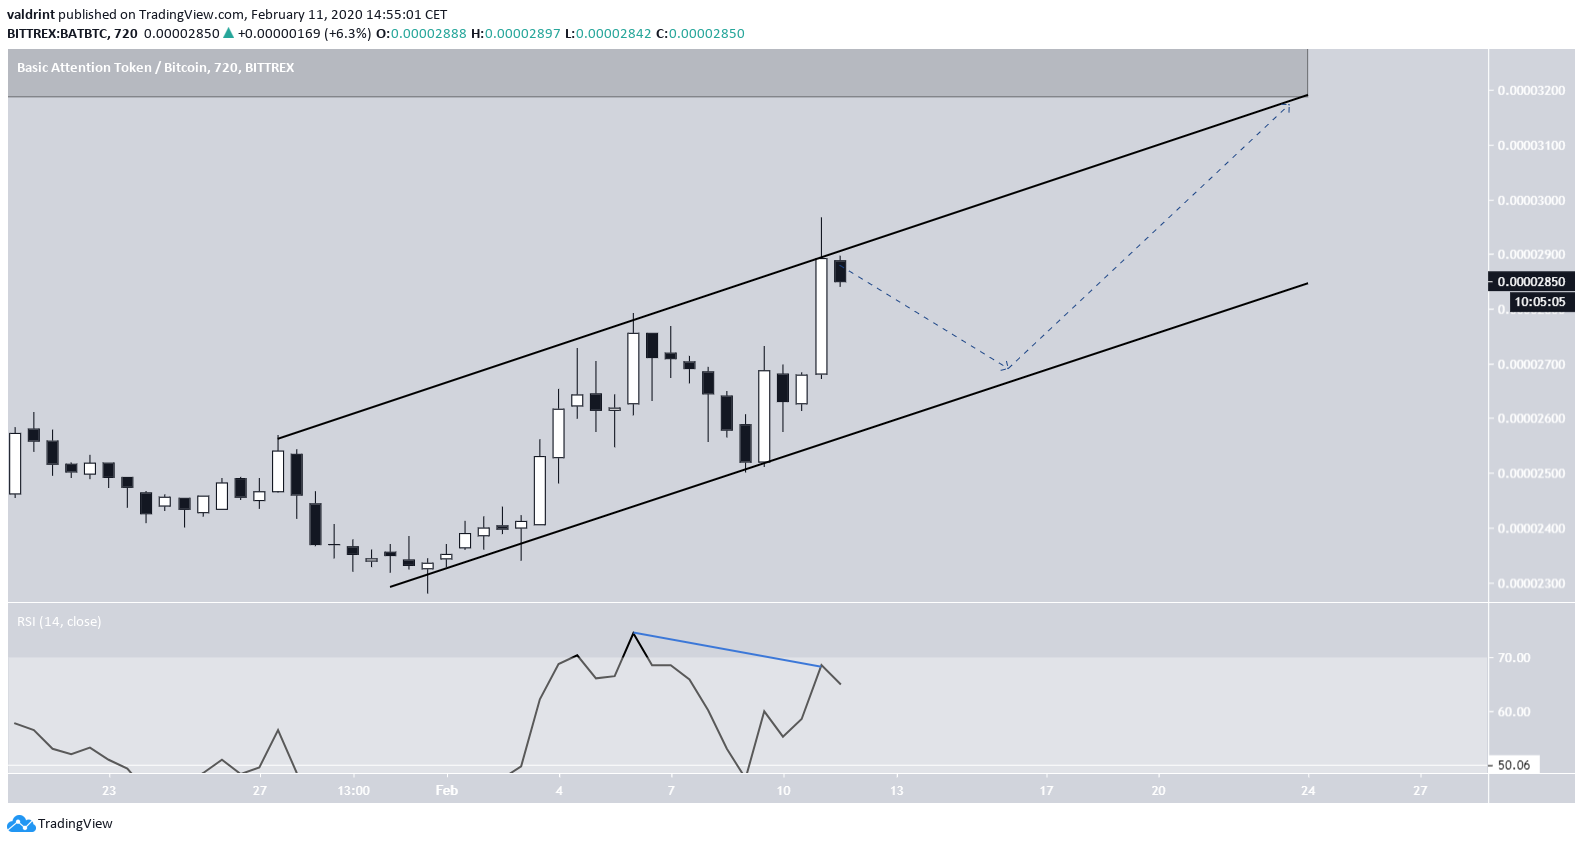
- The price is trading inside a short-term ascending channel.
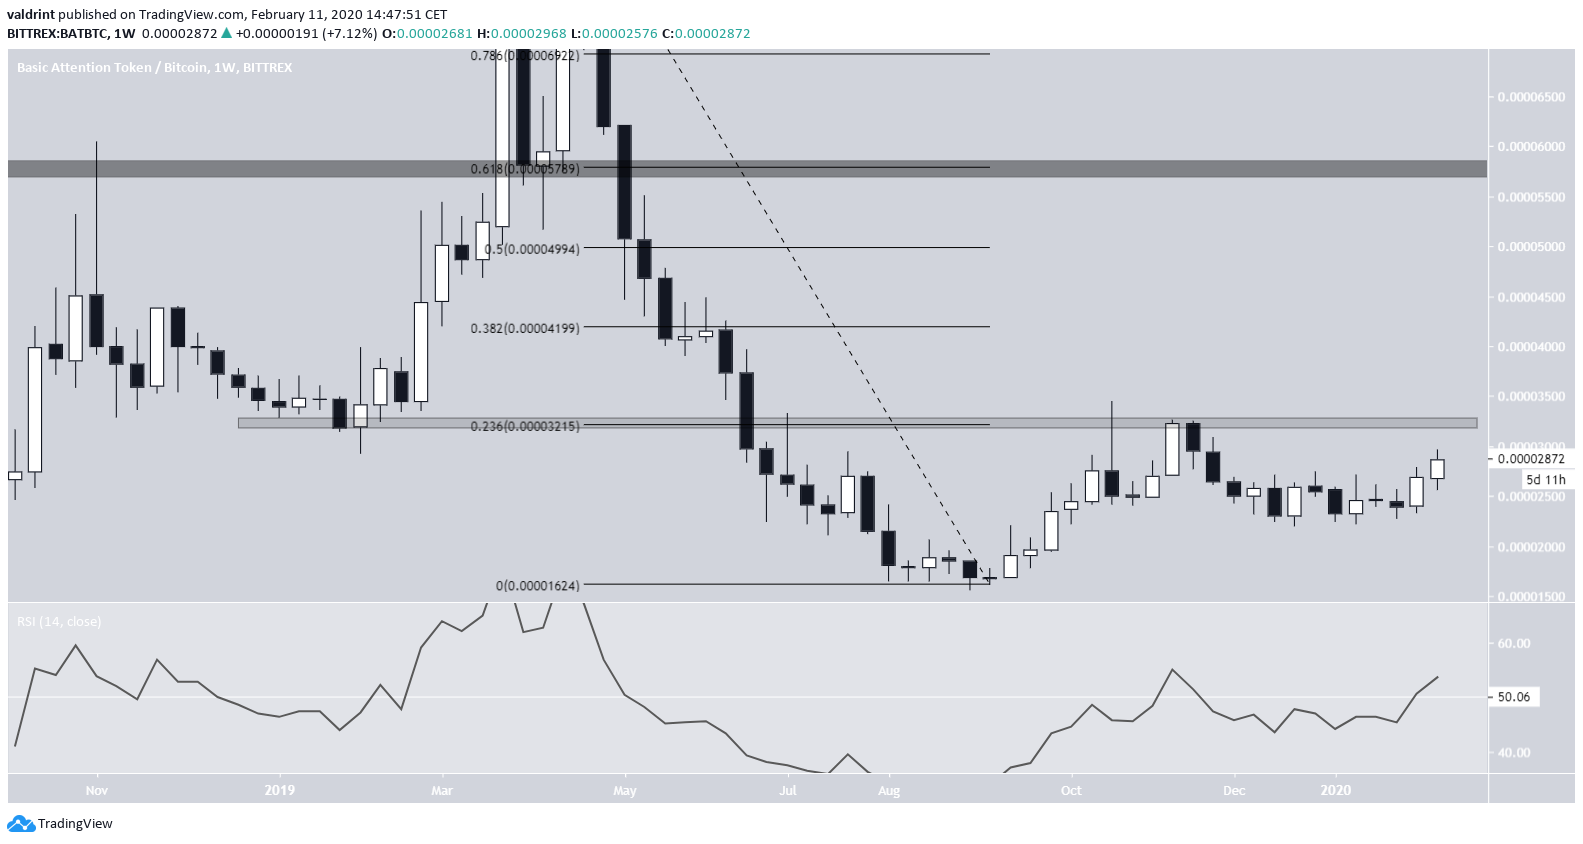
- A long-term price target is found at 5800 satoshis.
Margin trader @LSDinmycoffee tweeted a BAT price chart and outlining his next target at 3300 satoshis, which amounts to a 16% increase from the current price level.
Update: +16% and this is just getting started!
Volume increasing, next stop, 3300 sats for another +16% from here.
When $RVN pumps we go "kaww! kaww!". Do bats emit anything else than ultrasound? Any black smol ting specialist here? 🦇 pic.twitter.com/FUweHryWXZ
— krillin ॐ (@LSDinmycoffee) February 11, 2020
Will the BAT price get there? If the answer is yes, when will it do so? Keep reading below if you are interested in finding out.
Current Breakout
On February 4, the BAT price broke out from a resistance line that was in place for the past 105 days. After validating this line on February 9, the price began to move upward and created a massive bullish engulfing candlestick on February 11.
We successfully predicted this increase in our previous analysis using the Wyckoff distribution model.
There is strong resistance between 3200-3300 satoshis, at the top of the descending resistance line, as outlined in the tweet.
In the short-term, the BAT price is trading inside an ascending channel, having currently reached its resistance line.
But, there is some bearish divergence developing in the RSI, which when considering the fact that the price is also right at a resistance line suggests that BAT will decrease towards support.
As for the 3200-3300 satoshi resistance area, if the price continues increasing at the rate predicted by the channel, it should get to this area by February 23. So, after returning to the support line once more, the BAT price is likely to continue its upward movement towards this resistance.
Future Movement
The weekly chart reveals this resistance area is also the 0.382 fib level of the previous decrease and acted as support in February 2019, greatly increasing its significance.
A breakout above it could take the price all the way to 5800 satoshis, more than a 100% increase from the current price level, since there is a lack of resistance between these two areas, with the exclusion of a minor resistance at 4200 satoshis.
The weekly RSI has clearly moved above 50, a sign that the BAT price is in a bullish cycle.
To conclude, the BAT price has likely begun a long-term upward move. We believe the rate of increase will greatly accelerate once the price breaks out above 3300 satoshis. A long-term target for the price is found at 5800 satoshis.
