
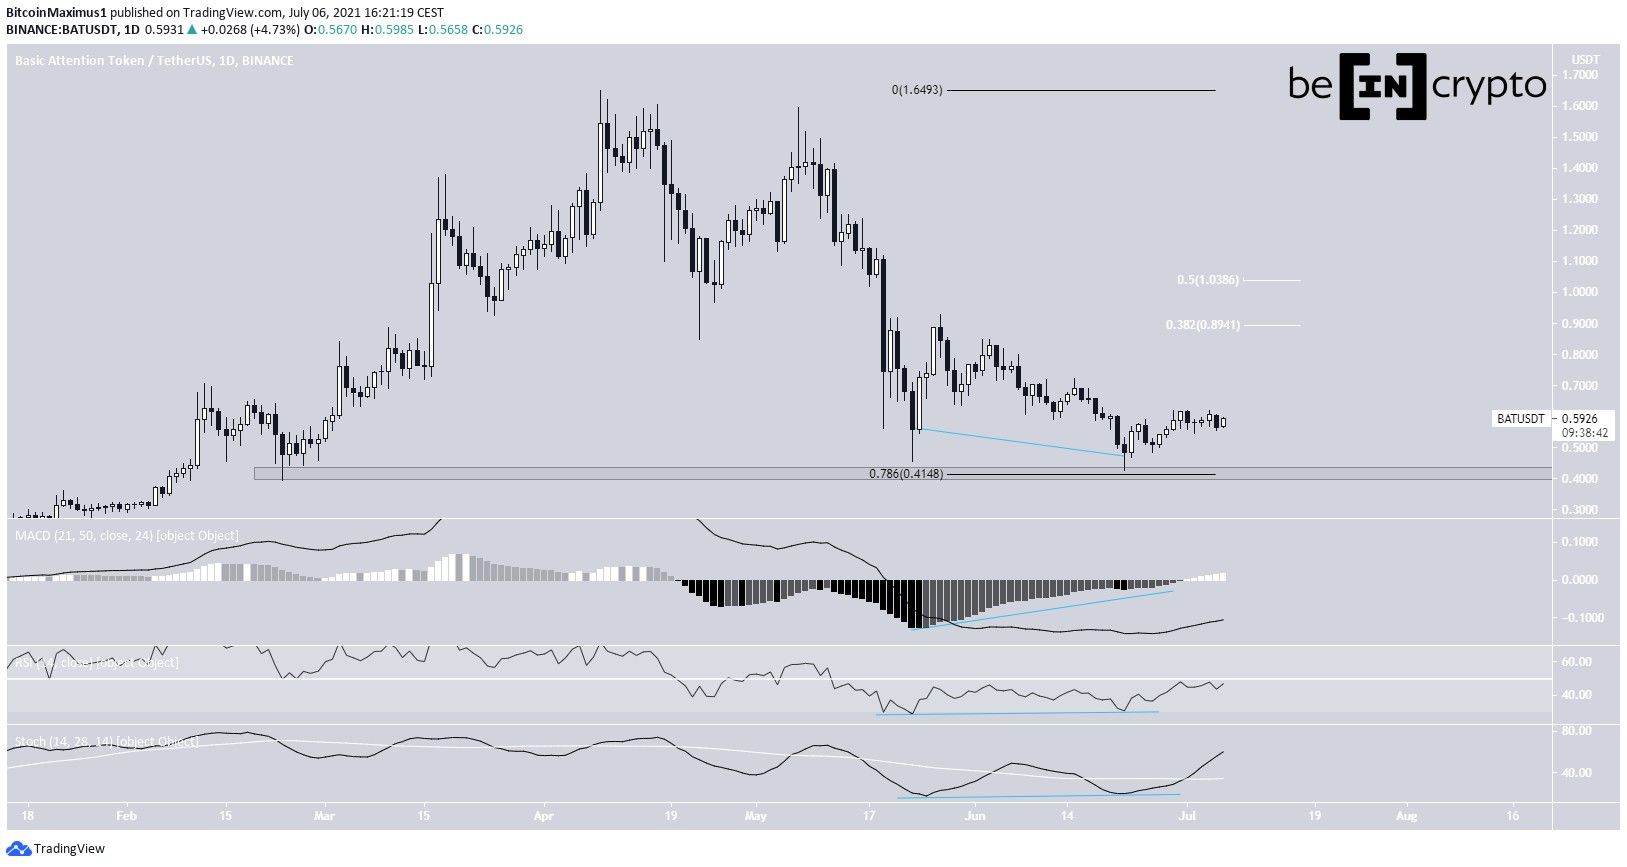
On June 22, Basic Attention Token (BAT) completed a double bottom pattern close to the $0.41 horizontal support area.
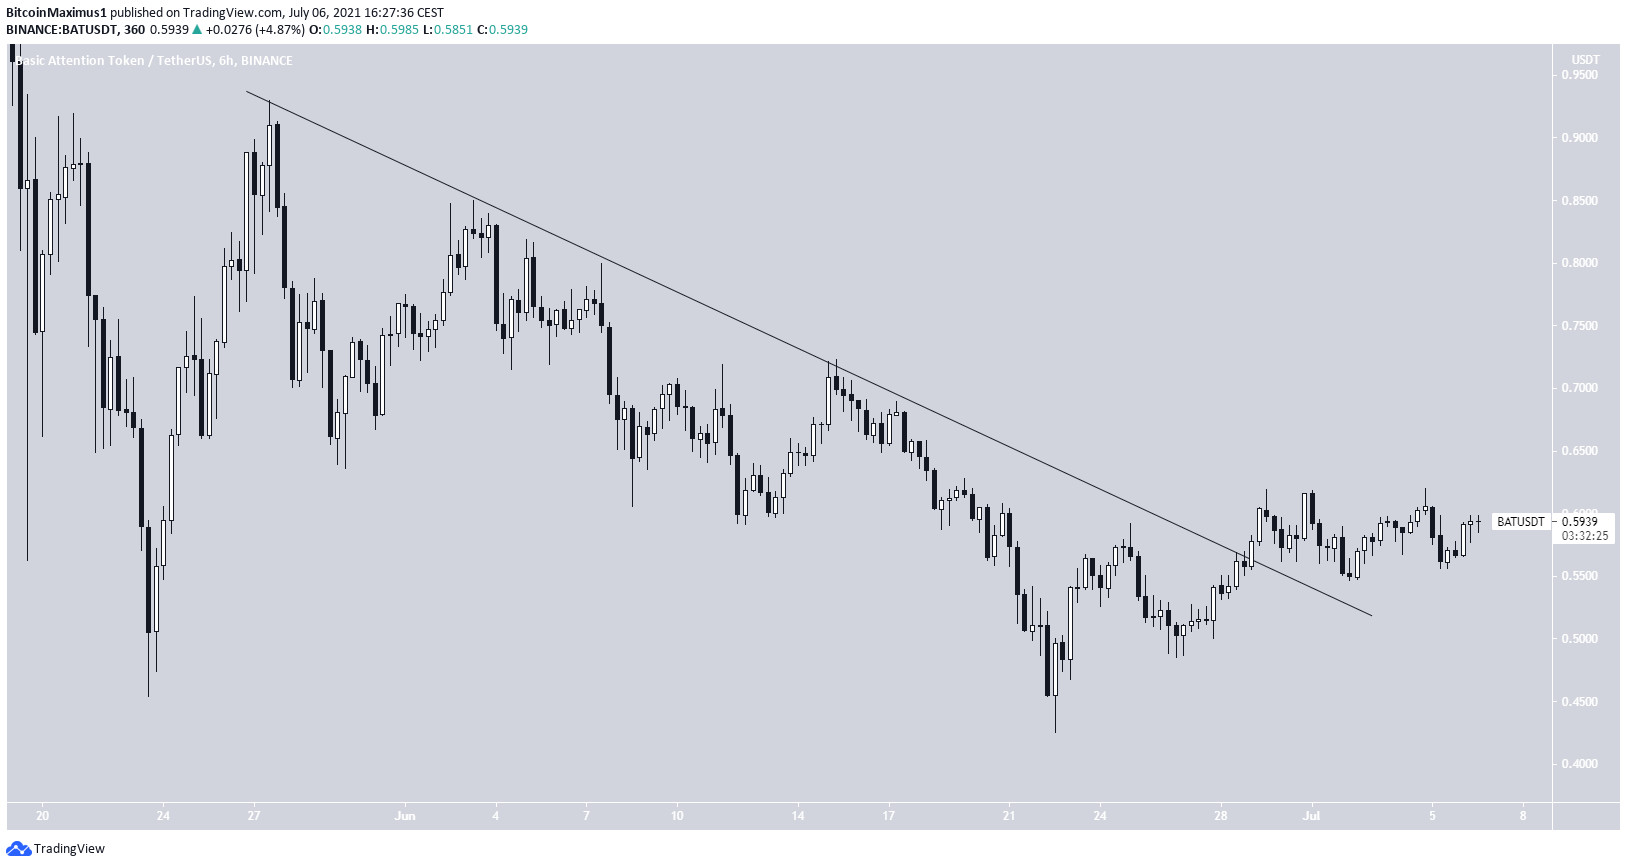
It has been moving upwards since, and broke out from a descending resistance line on June 30.
Double Bottom
BAT has been moving downwards since April 9, when it reached an all-time high price of $1.69. Afterwards, it created a lower high on May 7 and resumed its downward movement at an accelerated pace.
On June 22, the token reached a low of $0.42. Relative to the price on May 23, this created a double bottom pattern. The pattern was made inside the $0.41 horizontal support area, which is the 0.786 Fib retracement support level.
The double bottom is considered a bullish reversal pattern. In addition to this, it was combined with bullish divergence in the MACD, RSI & Stochastic oscillator.
If an upward movement were to follow, the closest resistances would be between $0.89-$1.03.
The shorter-term six-hour chart shows that BAT has broken out from a descending resistance line. This supports the possibility that it will continue increasing towards the previously outlined resistance area.
Wave count
Cryptocurrency trader @Mesawine1 outlined a BAT chart, stating that a re-test of the $0.60 level would offer a good entry opportunity.
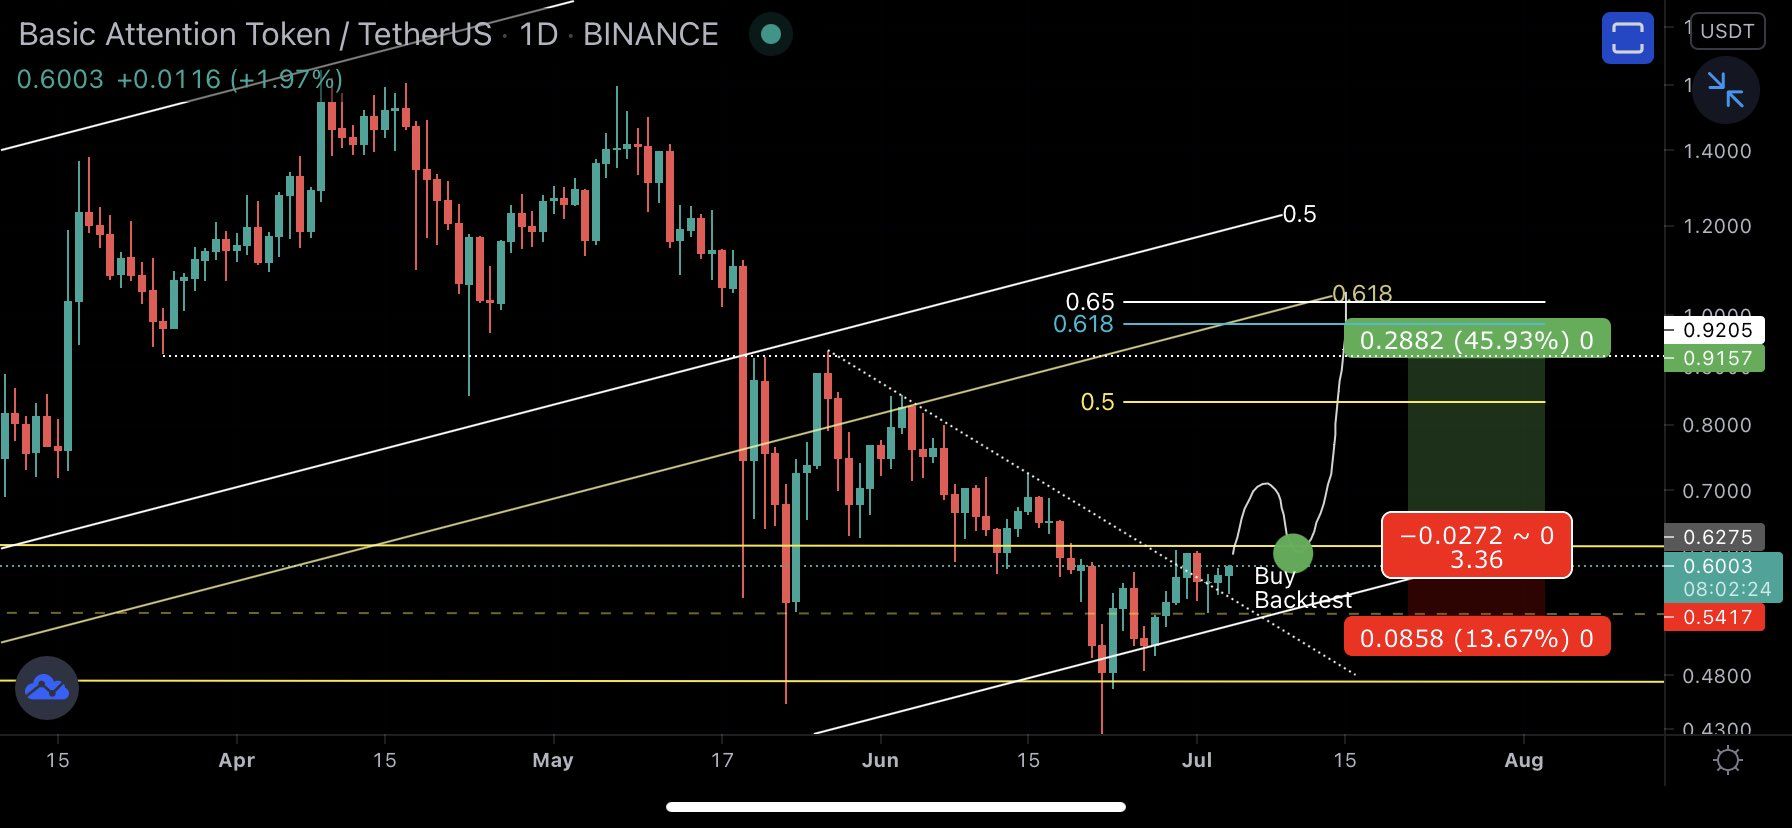
As seen above, BAT has already broken out from the descending resistance line.
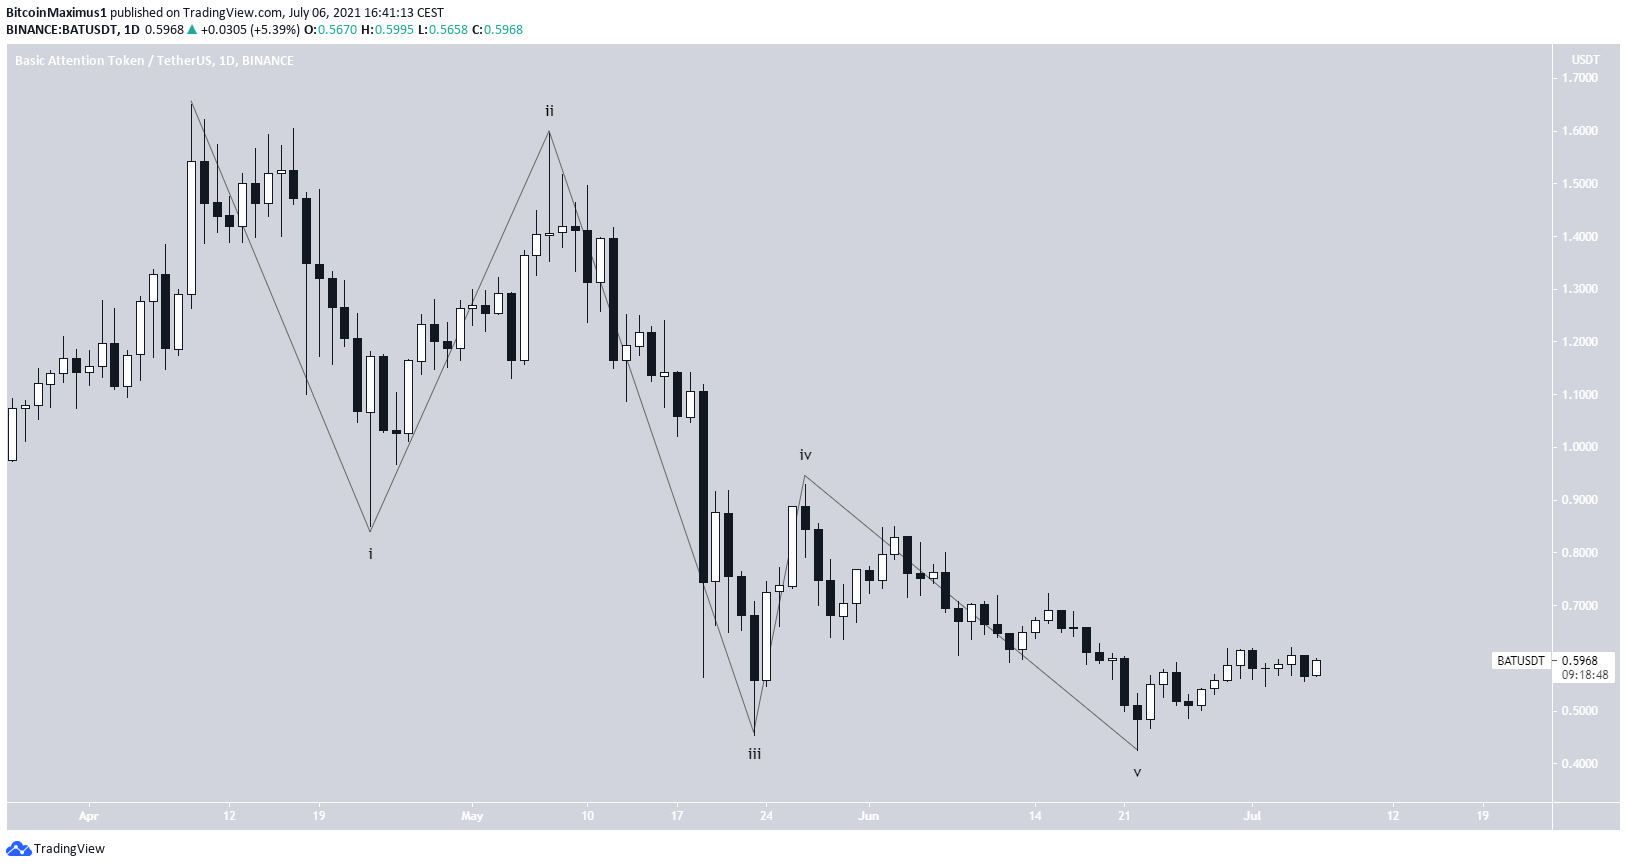
Furthermore, the downward movement looks like a completed bearish impulse. However, due to the overlap, it has to be a diagonal.
Nevertheless, this indicates that the most likely movement would be a bounce towards the previously outlined $0.89-$1.03 resistance area. However, the direction of the long-term trend is unconfirmed.
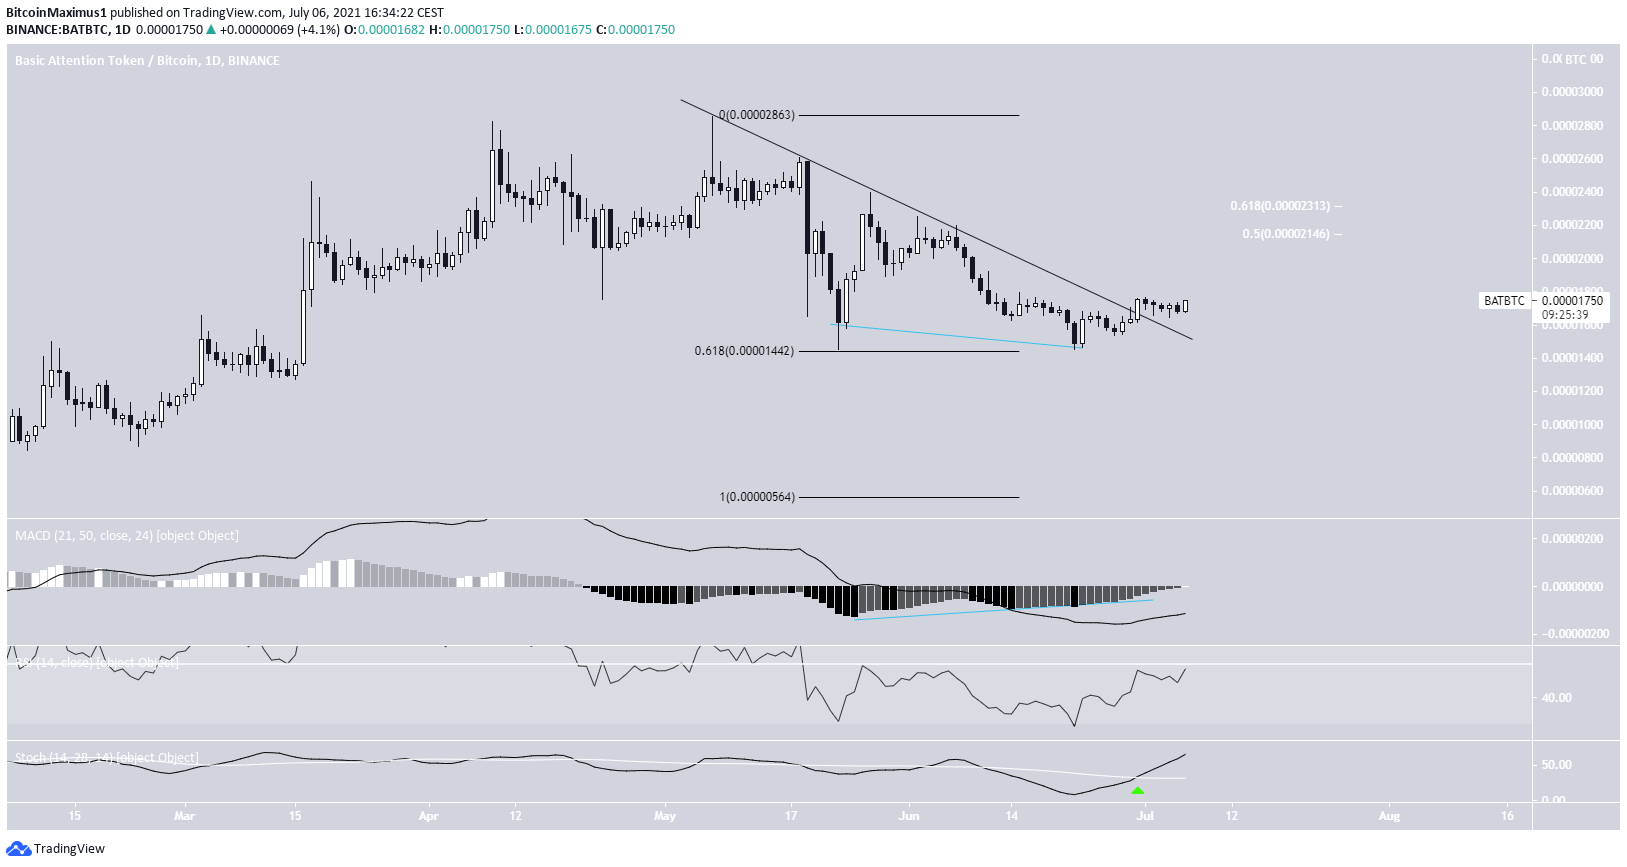
BAT/BTC
The BAT/BTC chart is more decisively bullish.
After creating a double bottom at the 1440 satoshi support area (0.618 Fib retracement), BAT broke out from a descending resistance line.
In addition to this, technical indicators are bullish. The Stochastic oscillator has made a bullish cross and the MACD histogram is positive.
The closest resistance area is between 2145-2313 satoshis, the 0.5-0.618 Fib retracement resistance levels.
For BeInCrypto’s latest bitcoin (BTC) analysis, click here.
