


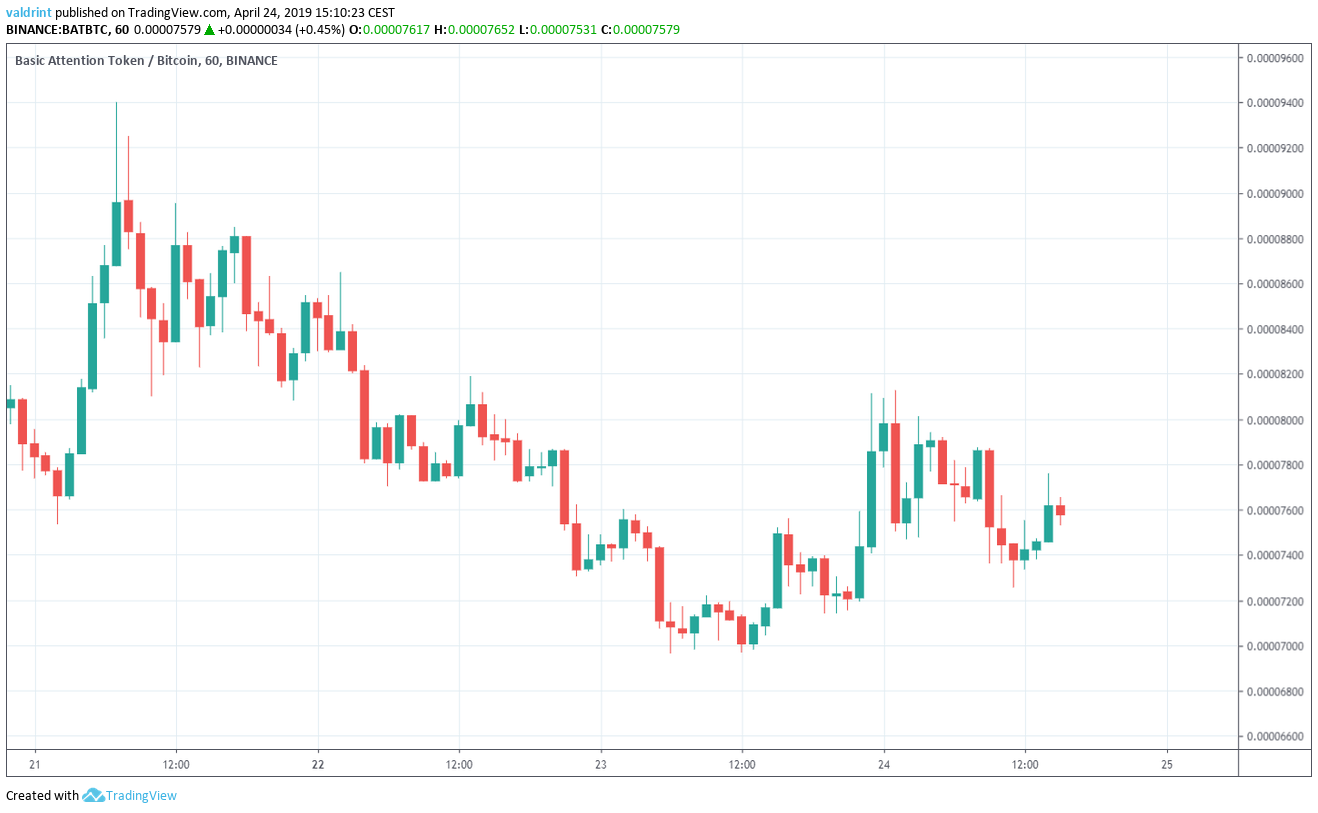
On Apr 21, 2019, the price of BAT reached a high of 9400 satoshis. A gradual decrease. By Apr 23, lows of under 7000 satoshis had been reached.
BAT then initiated a slight upward move with. Highs of over 8000 satoshis were reached on Apr 23 and 24.
Price has since dropped to around 7600 satoshis.
Will BAT be able to rise to 10000 satoshis or will price continue dropping?
Let’s find out:
Basic Attention Token (BAT): Trends And Highlights For April 24, 2019
- BAT/BTC reached a high of 9400 satoshis on Apr 21.
- Basic Attention Token is trading inside a descending wedge.
- The moving averages have made a bearish cross.
- There is support near 7000 and resistance near 8200 satoshis.
Tracing the Current Trading Pattern
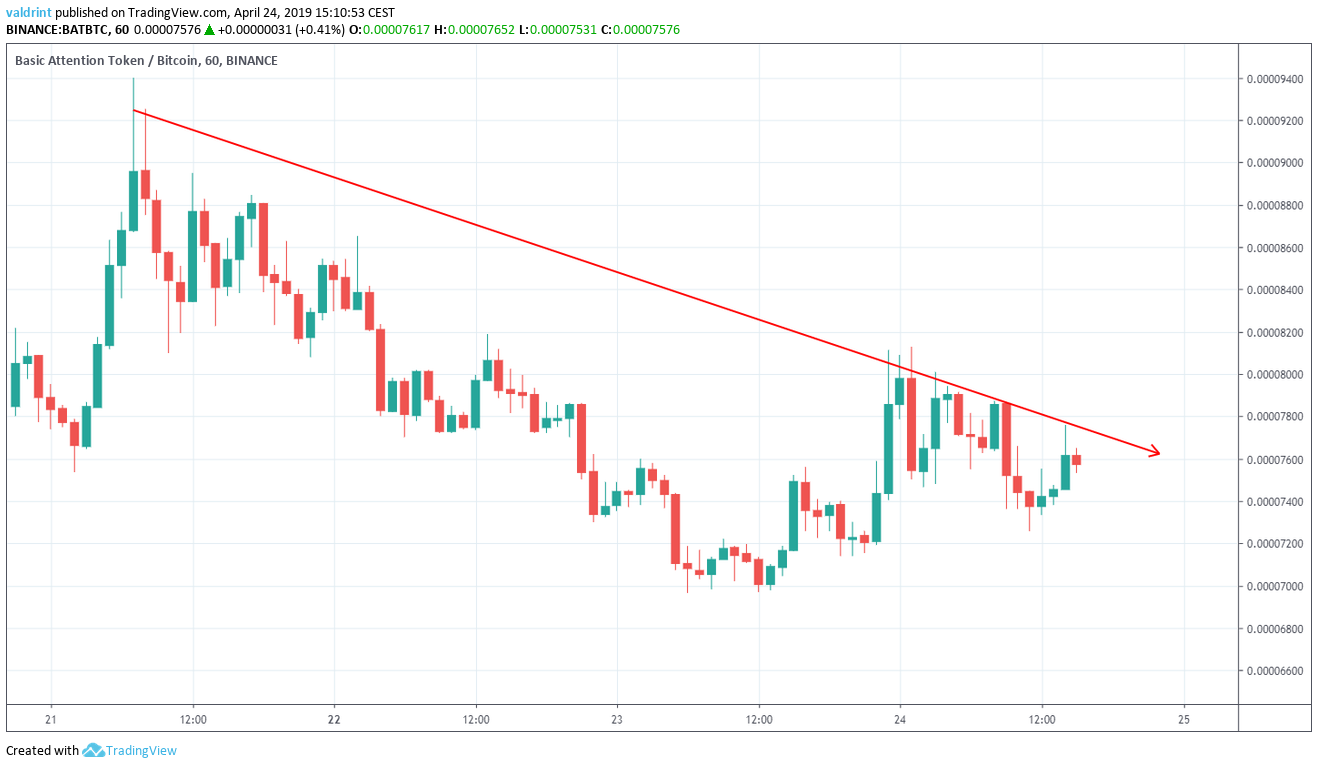
On Apr 21, the price made a high of 9400 satoshis. Since then, it has been decreasing, creating several lower highs in the process.
Tracing these highs gives us a descending resistance line:
On Apr 21, the price reached a low of 7535 satoshis. Several market cycles have been completed and the price has made several lower lows.
Tracing these lows gives us a descending support line. The resistance and support lines combine to create a descending channel:
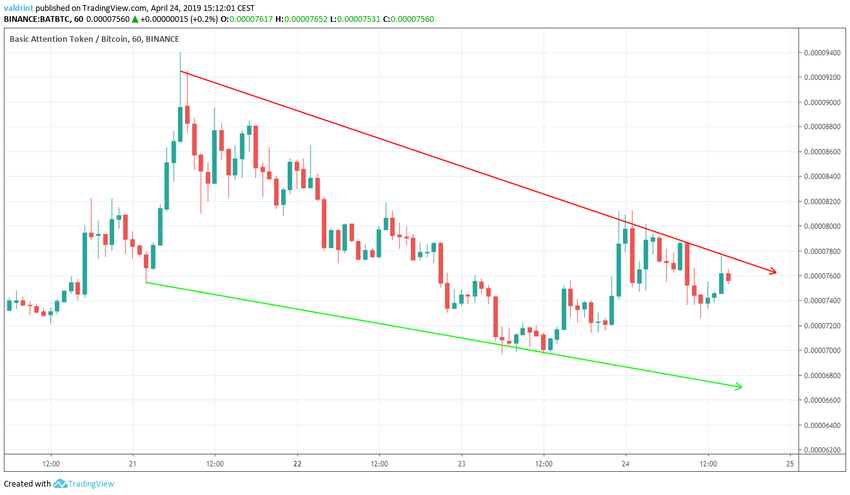
It is likely that the price will continue trading inside the confines of this channel until a decisive move occurs.
In order to figure out the direction of the move, we need to incorporate technical indicators into a longer time frame.
Technical Indicators
In this section, the price of BAT is analyzed at six-hour intervals from Apr 18 to Apr 24 alongside the 10- and 20-period moving averages.
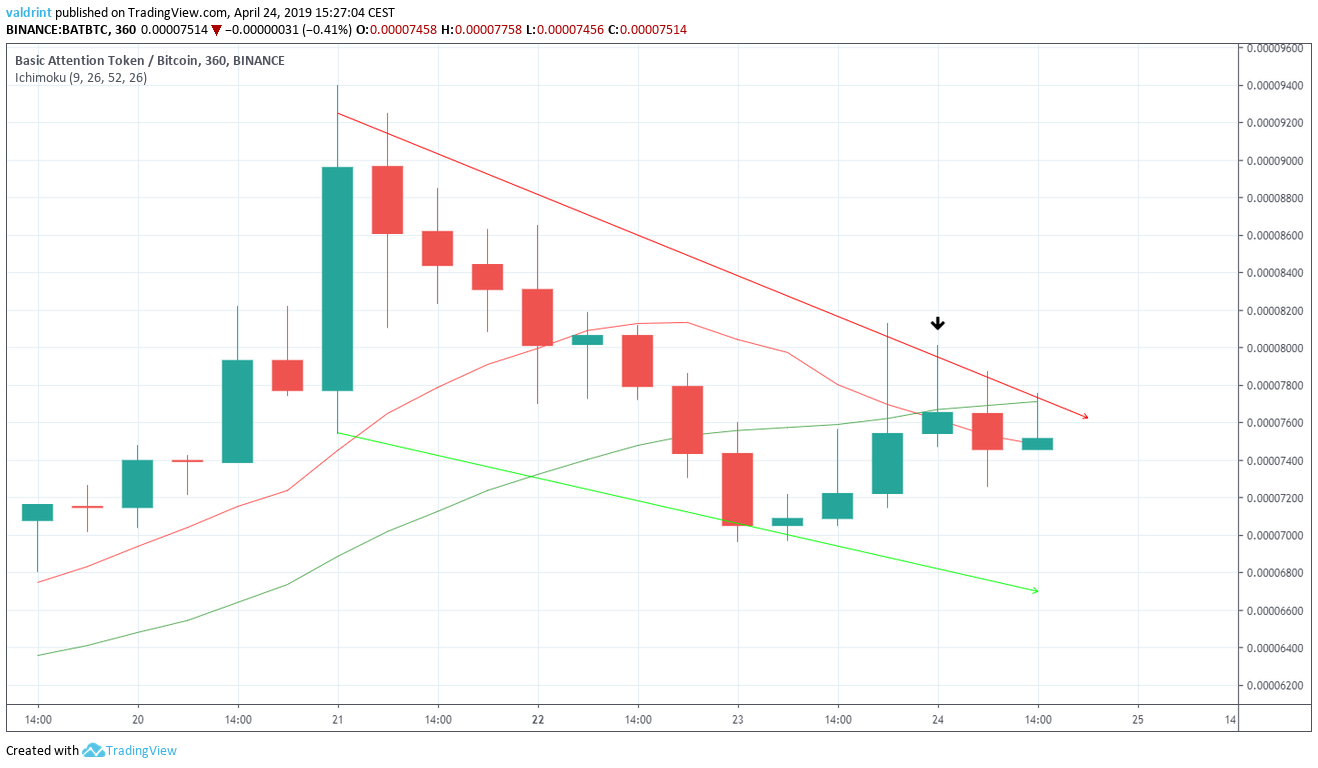
Furthermore, we can see that the past five candles have all had long upper wicks.
This indicates that there is significant selling pressure in the market.
The use of this indicator and the candlestick characteristics make it likely that the price will decrease towards the support line of the wedge.
Future Movement
In this section, we incorporate support and resistance areas into the analysis to determine possible future price levels.
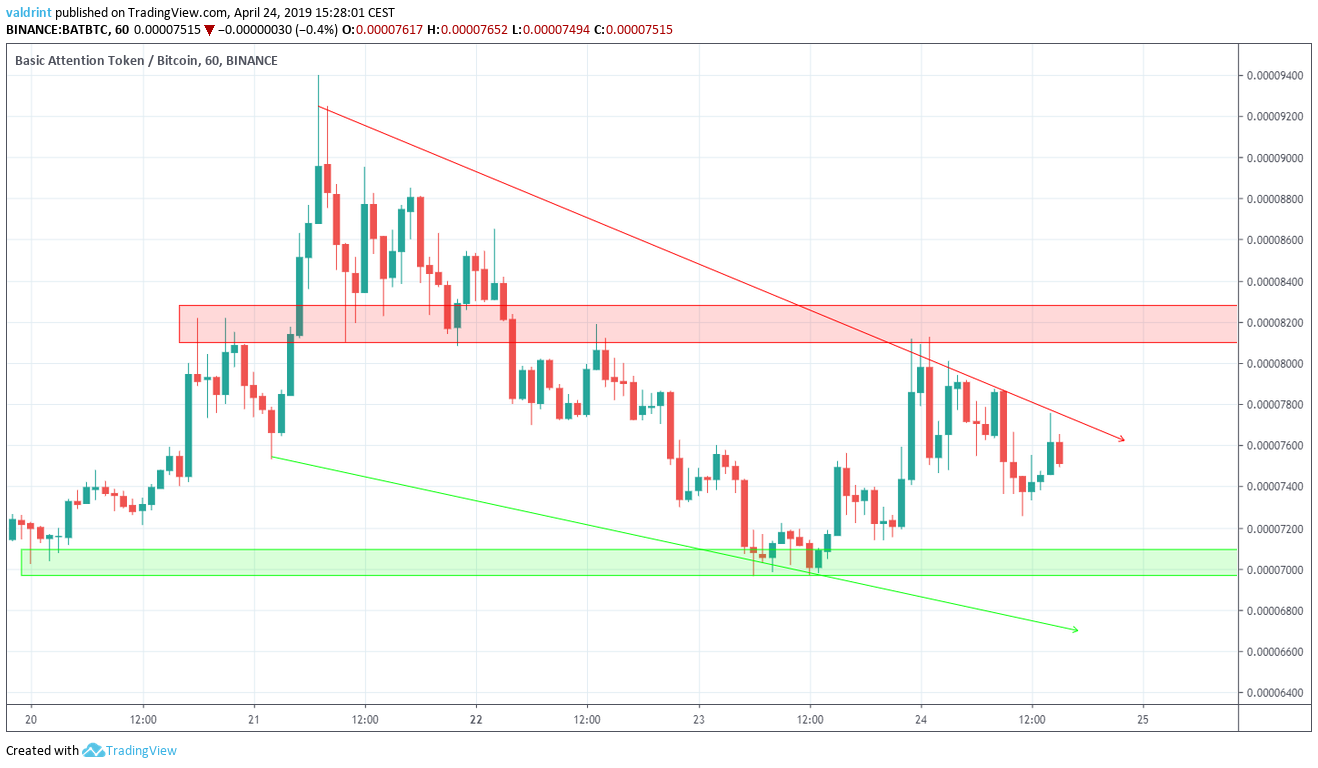
The closest support area is found near 7000 satoshis. If the price decreases towards the support line of the wedge, it will eventually reach this area. We believe this to be likely.
The closest resistance area is found near 8200 satoshis. If the price breaks out of the wedge, it is likely to provide a reversal. We do not believe this to be likely.
Summary of Analysis
Based on our analysis, it is likely that the price of BAT will decrease towards the support line of the wedge. We believe it is likely that it will reach the support area outlined above. This means that price is mmore likely to drop toward 7000 satoshis than push back toward the highs we saw three days ago.
Do you think the price of BAT will reach the support line of the wedge? Let us know your thoughts in the comments below!
Interested in 2019, 2020, and 5 year Bitcoin price predictions? Click on the green button below:
Disclaimer: This article is not trading advice and should not be construed as such. Always consult a trained financial professional before investing in cryptocurrencies, as the market is particularly volatile.


