


Basic Attention Token (BAT) bounced at a long-term horizontal support level and broke out from a shorter-term resistance line afterward.
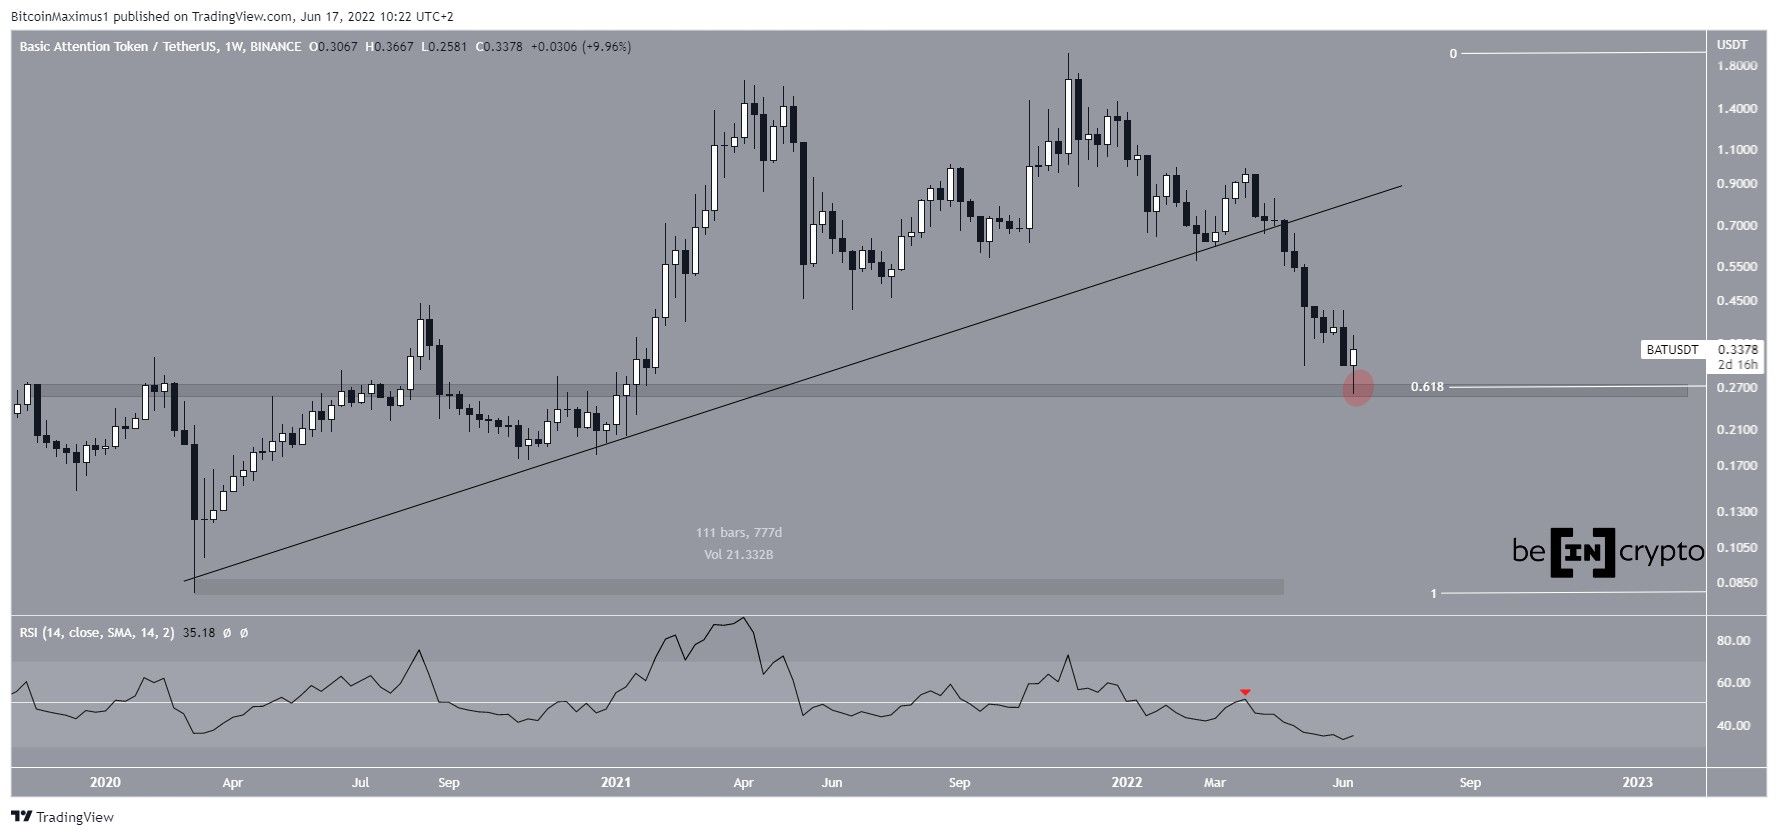
BAT has been falling since reaching an all-time high price of $1.92 in Nov 2021. The downward movement has so far led to a low of $0.25 on June 13. This amounted to a drop of 86% measuring from the all-time high.
More importantly, it caused a breakdown from a long-term ascending support line which had been in place since the March 2020 low. Prior to the breakdown, the line had been in place for 777 days.
Afterward, the price bounced at the $0.265 horizontal support area. The area had acted as resistance throughout 2019 and 2020 and has now seemingly turned to support. Furthermore, it is the 0.618 Fib retracement support level when measuring the entire upward movement, increasing its validity.
Additionally, the RSI has fallen below 50 (red icon), another sign of a bearish trend.
Potential bounce
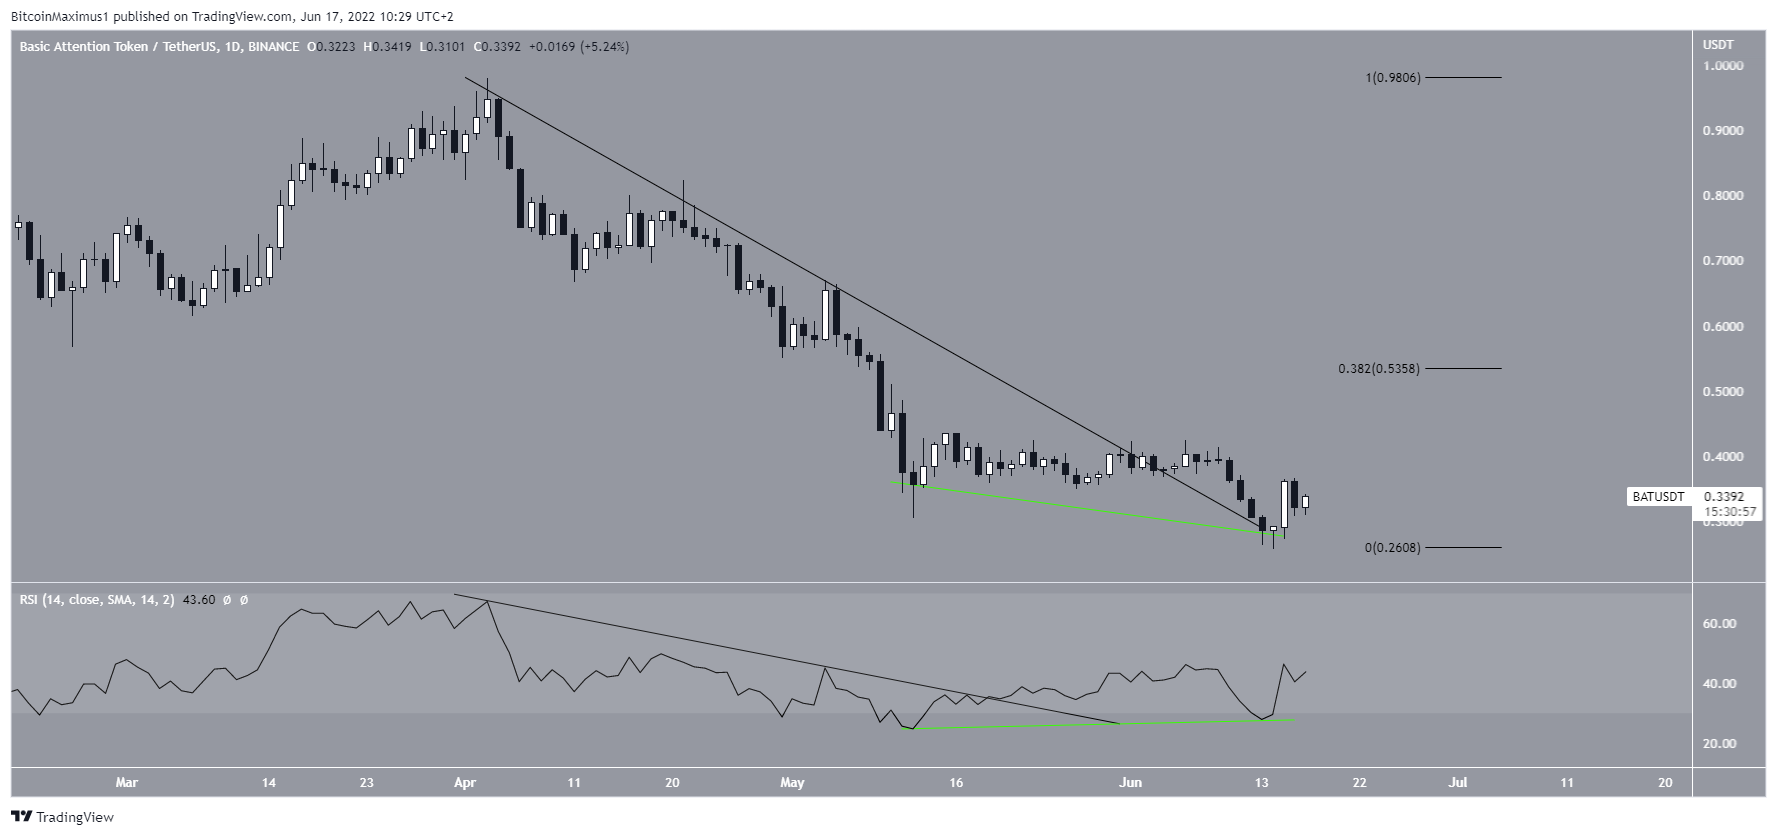
The daily chart supports the possibility of a bounce.
Firstly, the price has broken out from a descending resistance line that had been in place since the beginning of April. Afterward, it validated it as support.
Secondly, the RSI has both broken out from a descending resistance line and generated bullish divergence (green line). This increases the legitimacy of the price breakout.
If the upward movement continues, the closest resistance area would be at $0.52. This is the 0.382 Fib retracement resistance level when measuring the entire downward movement.
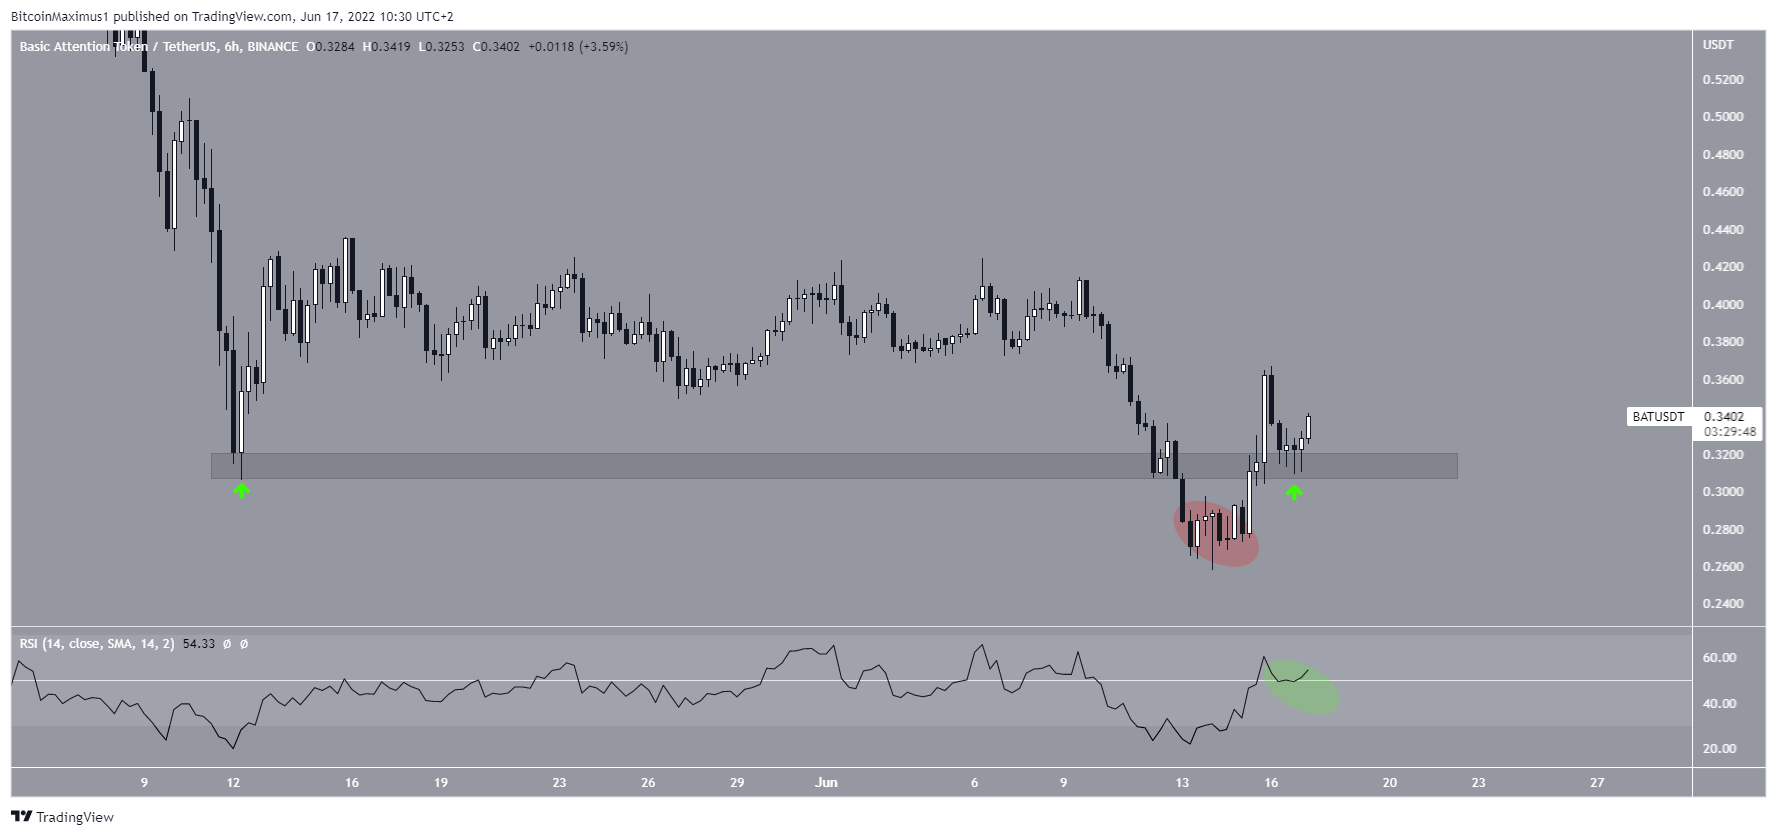
The six-hour chart shows that the price has reclaimed the $0.315 horizontal area after previously deviating below it (red circle). Such deviations are often followed by bullish trend reversals.
The RSI movement above 50 (green circle) also supports this scenario.
BAT wave count analysis
Cryptocurrency trader @thetradinghubb tweeted a chart of BAT, stating that the price has begun a short-term upward movement.
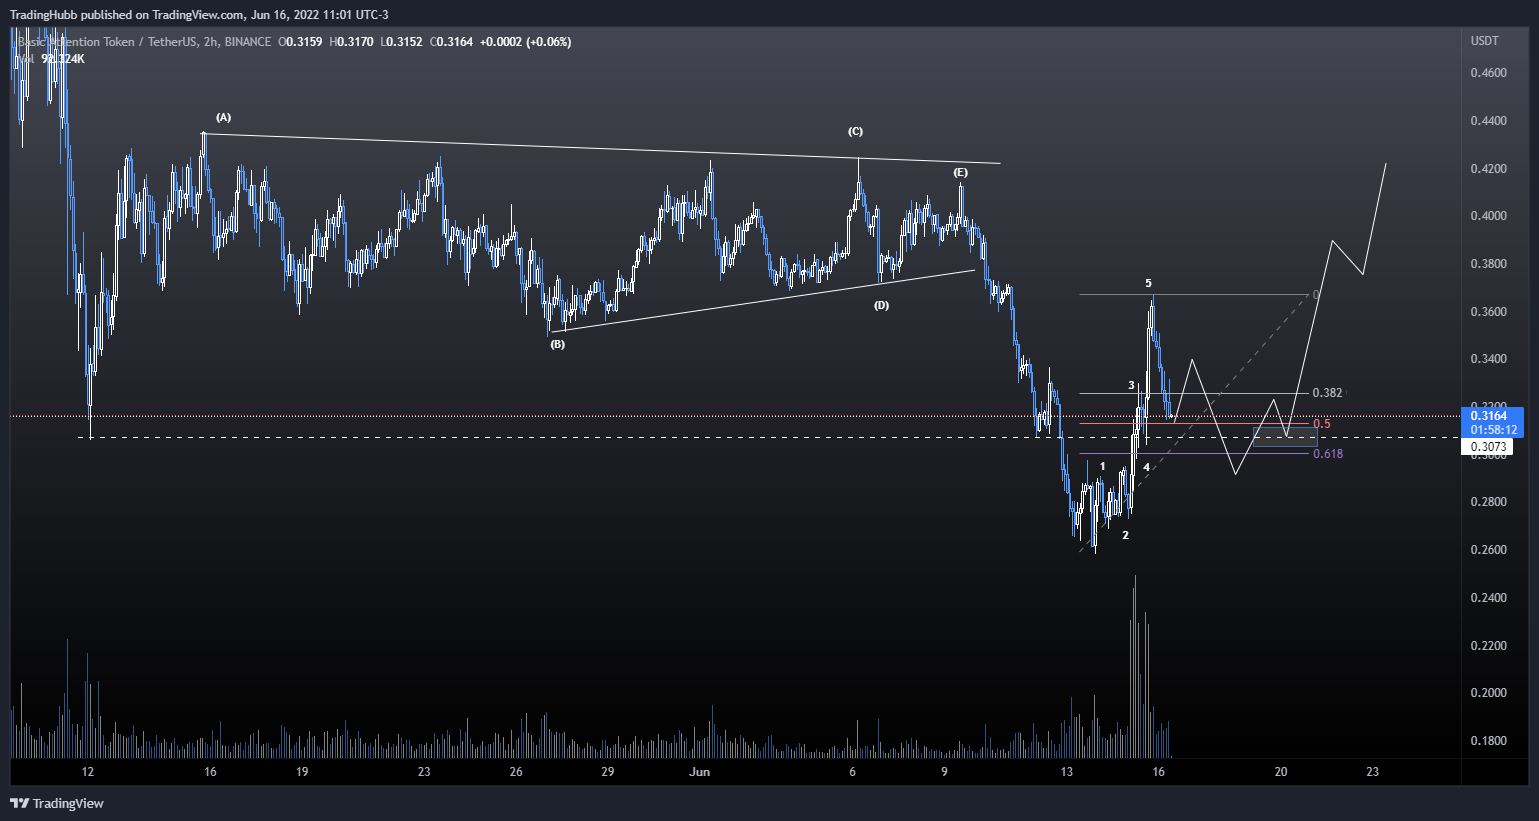
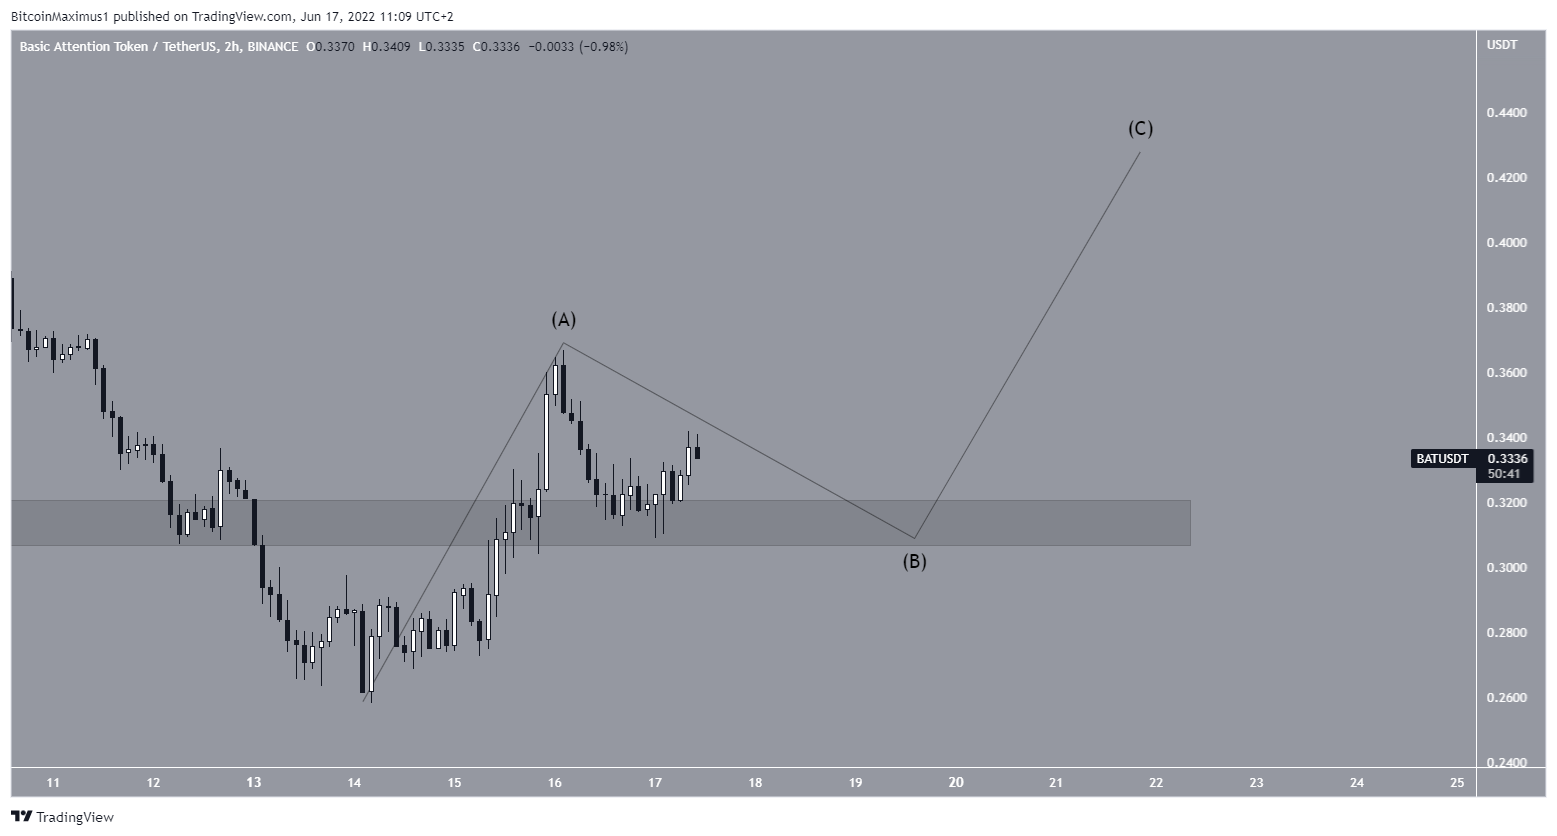
The short-term count supports the deviation scenario, since it indicates that the movement that caused it is either an A wave or the beginning of a new upward movement.
In the case it is an A wave, it would mean that the price is currently in wave B. Afterward, an upward movement that has at least the length of A would be expected.
While the exact high depends on the low of wave B, an increase that takes the price towards $0.43 would be expected.
For Be[in]Crypto’s latest bitcoin (BTC) analysis, click here


