


Basic Attention Token (BAT) has confirmed the beginning of a new upward movement that could take it to a new all-time high price.
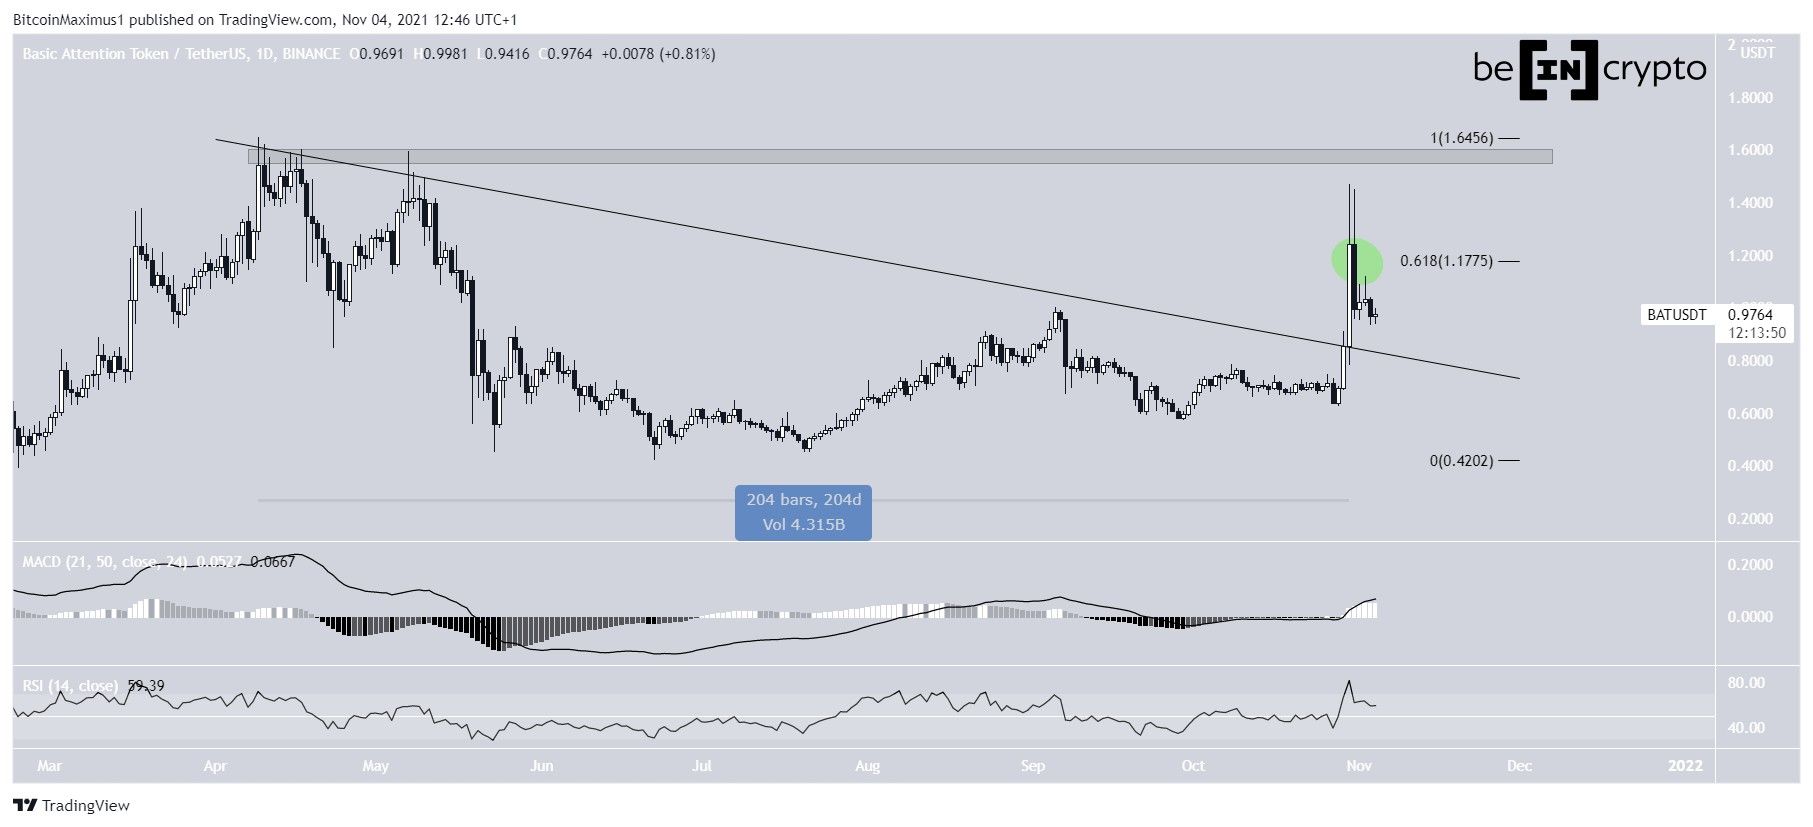
BAT broke out from a descending resistance line on Oct 30, and increased by 43% the same day. The breakout was significant both because of its magnitude and the fact that the resistance line had been in place since the April all-time high. Such breakouts usually confirm that the correction has come to an end.
After breaking out, BAT managed to reach a high of $1.47 before decreasing. The drop left a long upper wick in place, and the token has been decreasing since.
Therefore, it only caused a deviation above the 0.618 Fib retracement resistance at $1.17, which is still the closest resistance area.
BAT is now attempting to find support prior to the resumption of the upward movement, which is supported by technical indicators.
The MACD, which is created by a short- and a long-term moving average (MA), is positive and increasing. This means that the short-term trend is increasing at a faster rate than the long-term one.
The RSI, which is a momentum indicator, is above 50. This is a sign of bullish momentum that often accompanies upward movements.
If BAT manages to move above the $1.17 resistance, the next resistance area would be at $1.58, very close to the all-time highs.
Future movement
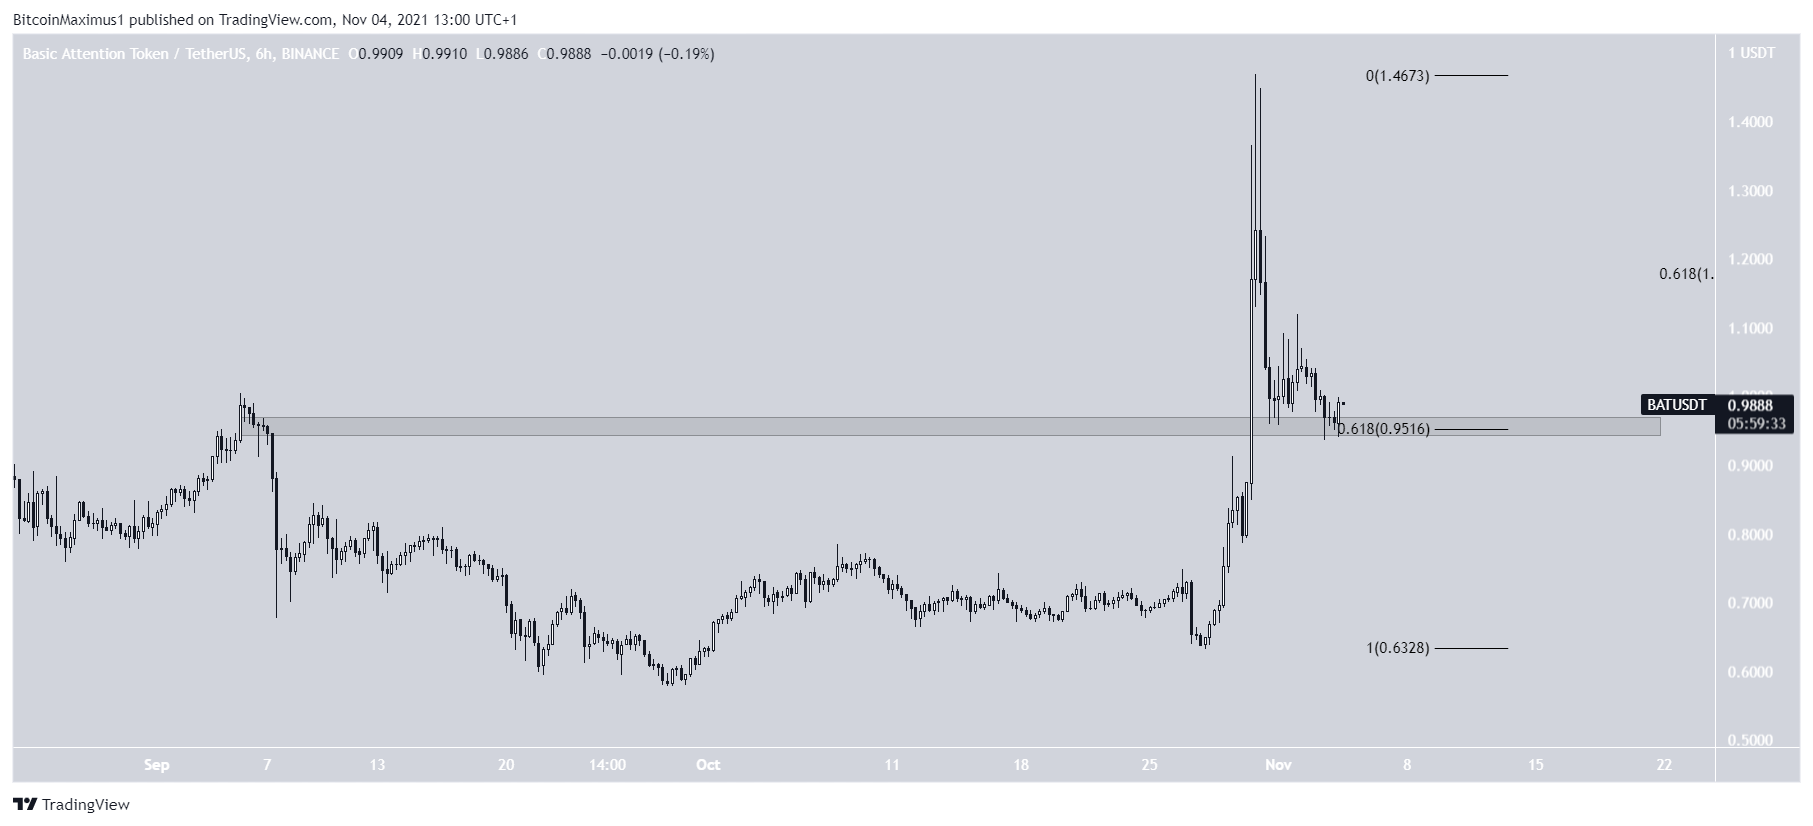
The shorter-term six-hour chart shows that BAT is currently at a confluence of support levels at $0.95. This area coincides with both the 0.618 Fib retracement support level and the previous resistance area, which will now potentially act as support.
However, there are no bullish reversal signs in place nor is there a bullish structure visible.
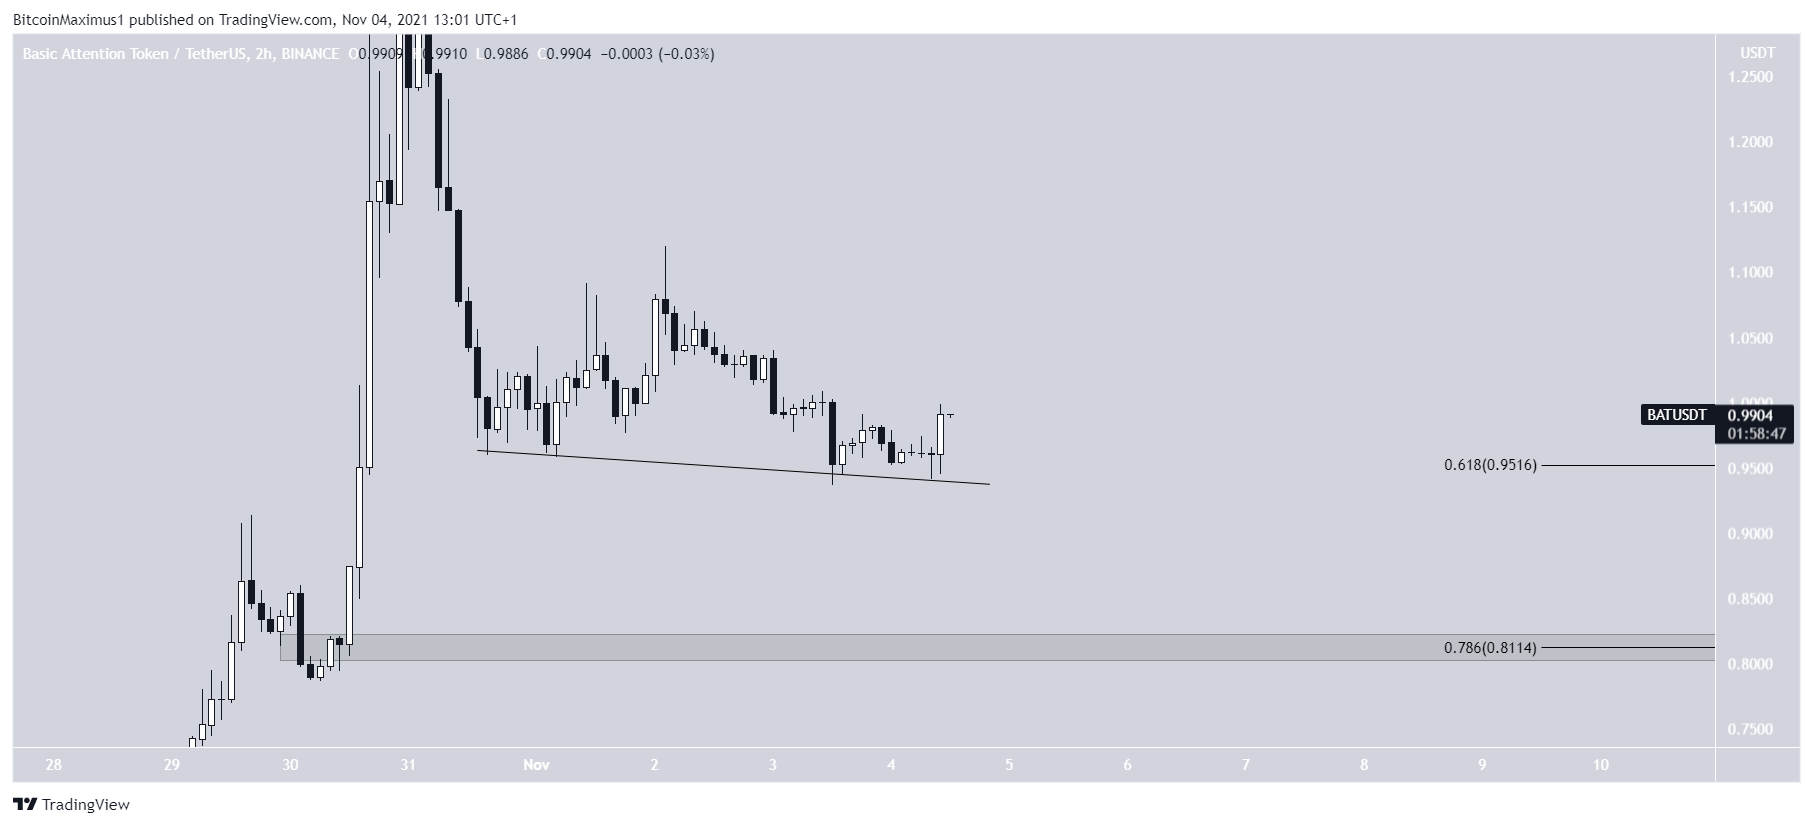
The shorter-term two-hour chart shows that BAT is following a descending support line. Similarly to the six-hour chart, there are no reversal signs in place.
If the token breaks down from the support line, the next support area would be at $0.81. This is the 0.786 Fib retracement support level and a short-term horizontal support area.
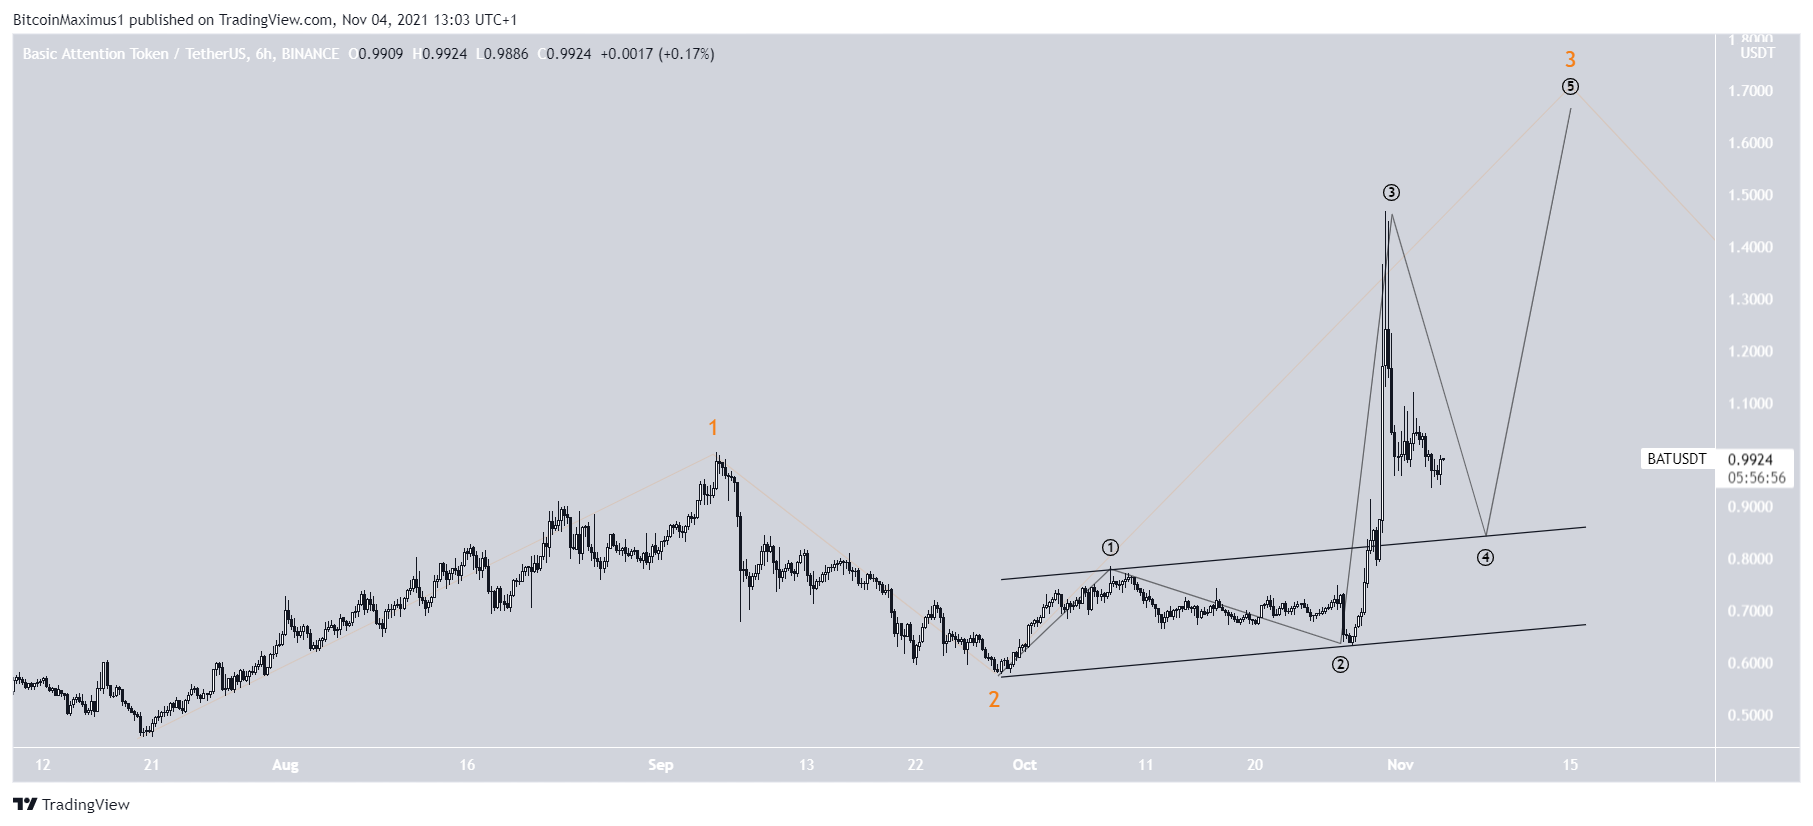
BAT wave count
Cryptocurrency trader @TheTradingHubb tweeted a BAT chart, stating that the token has begun wave three of a five wave upward movement.
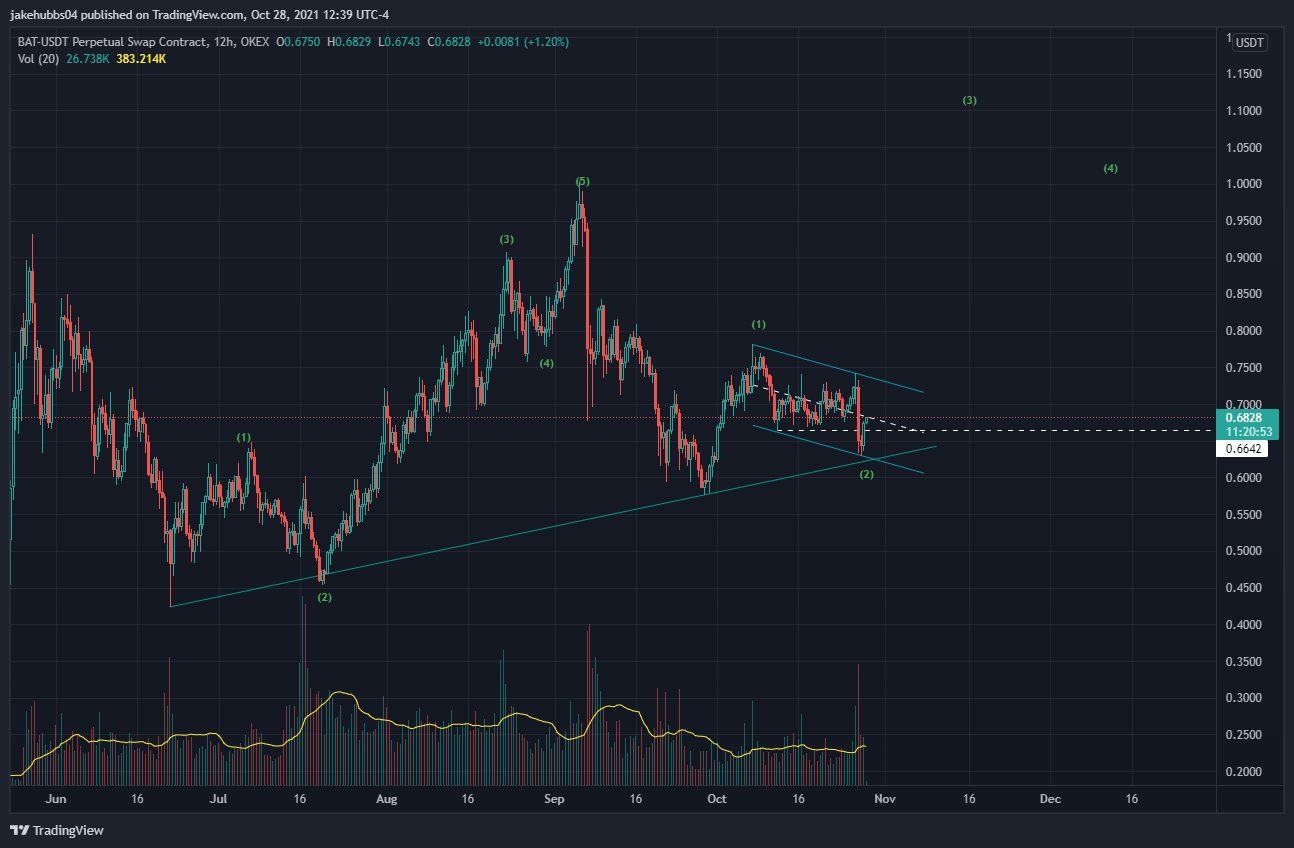
Since the tweet, BAT has already initiated a sharp upward movement. It does seem to be in wave three (orange), which is the sharpest of the five waves. The sub-wave count is given in black.
The current decrease is most likely part of a fourth wave pullback, in which a sharp drop is followed by a similarly sharp upward movement that completes the fifth and final sub-wave.
A fourth wave pullback usually touches the resistance line of the previous parallel channel, which in this case coincides with the previously outlined $0.81 support area.
Therefore, that would be likely to be the low if BAT resumes its descent.
For BeInCrypto’s latest Bitcoin (BTC) analysis, click here.
What do you think about this subject? Write to us and tell us!


