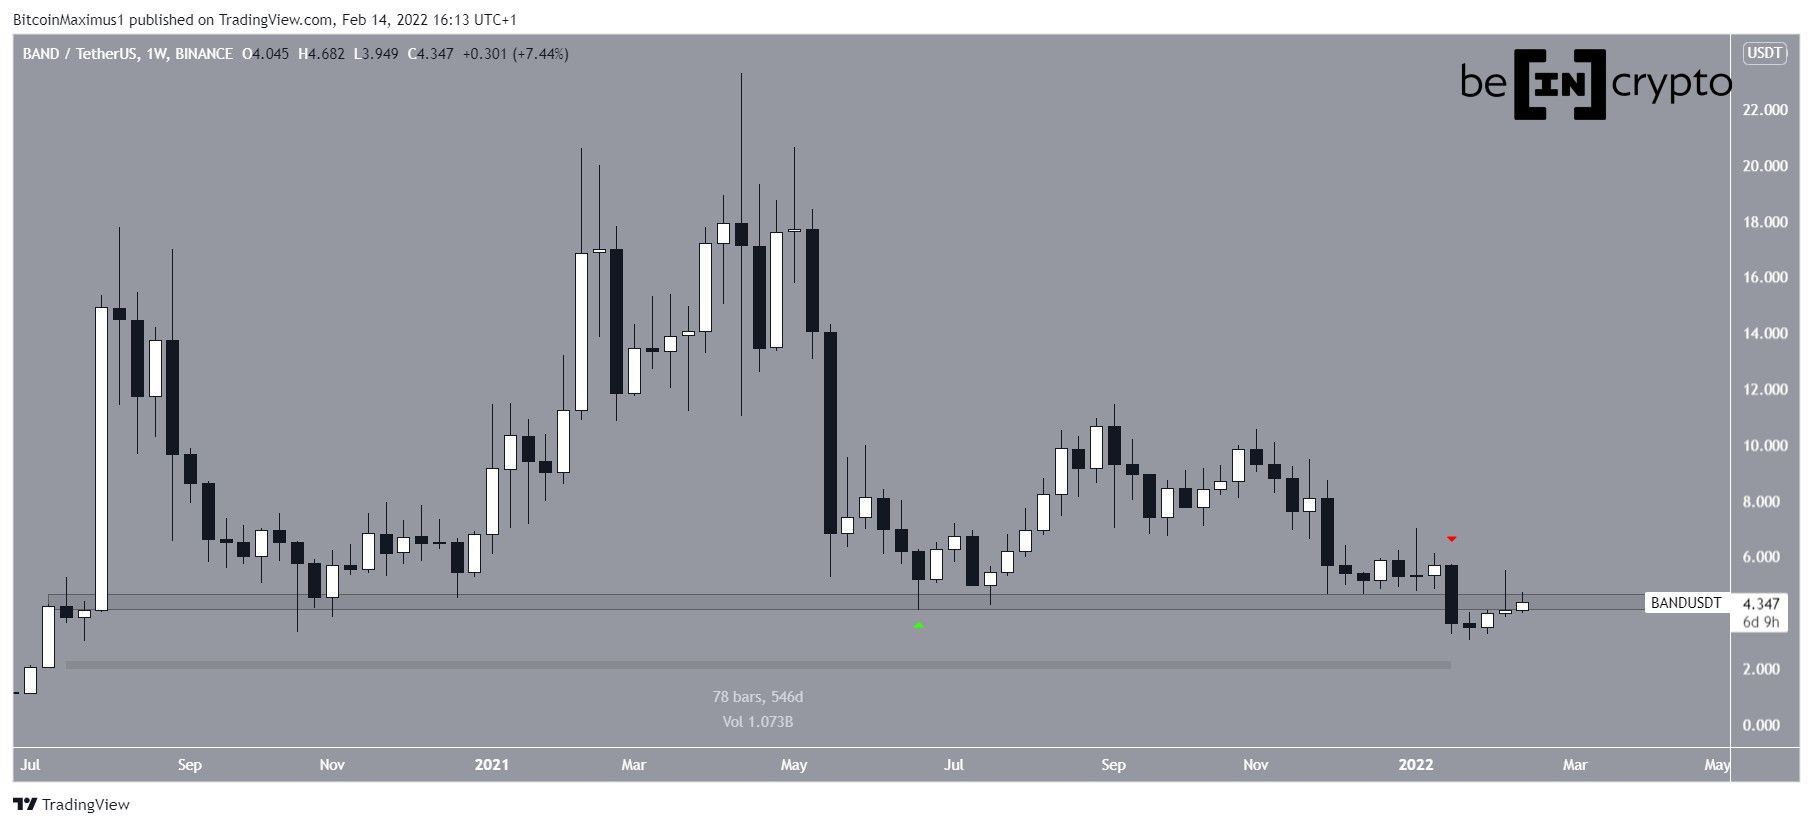
Band Protocol (BAND) has broken down from a crucial horizontal level, but is currently attempting to reclaim it.
BAND has been falling since reaching an all-time high price of $22.30 on April 15. Initially, the price bounced at the $4.35 horizontal support area (green icon) and attempted to initiate an upward movement.
However, the increase was short-lived and BAND broke down from the support area on Jan 21 (red icon). Previously, the area had provided support for 546 days.
Currently, BAND is in the process of validating this horizontal level as resistance. Whether it reclaims it or gets rejected will go a long way in determining the direction of the future movement.
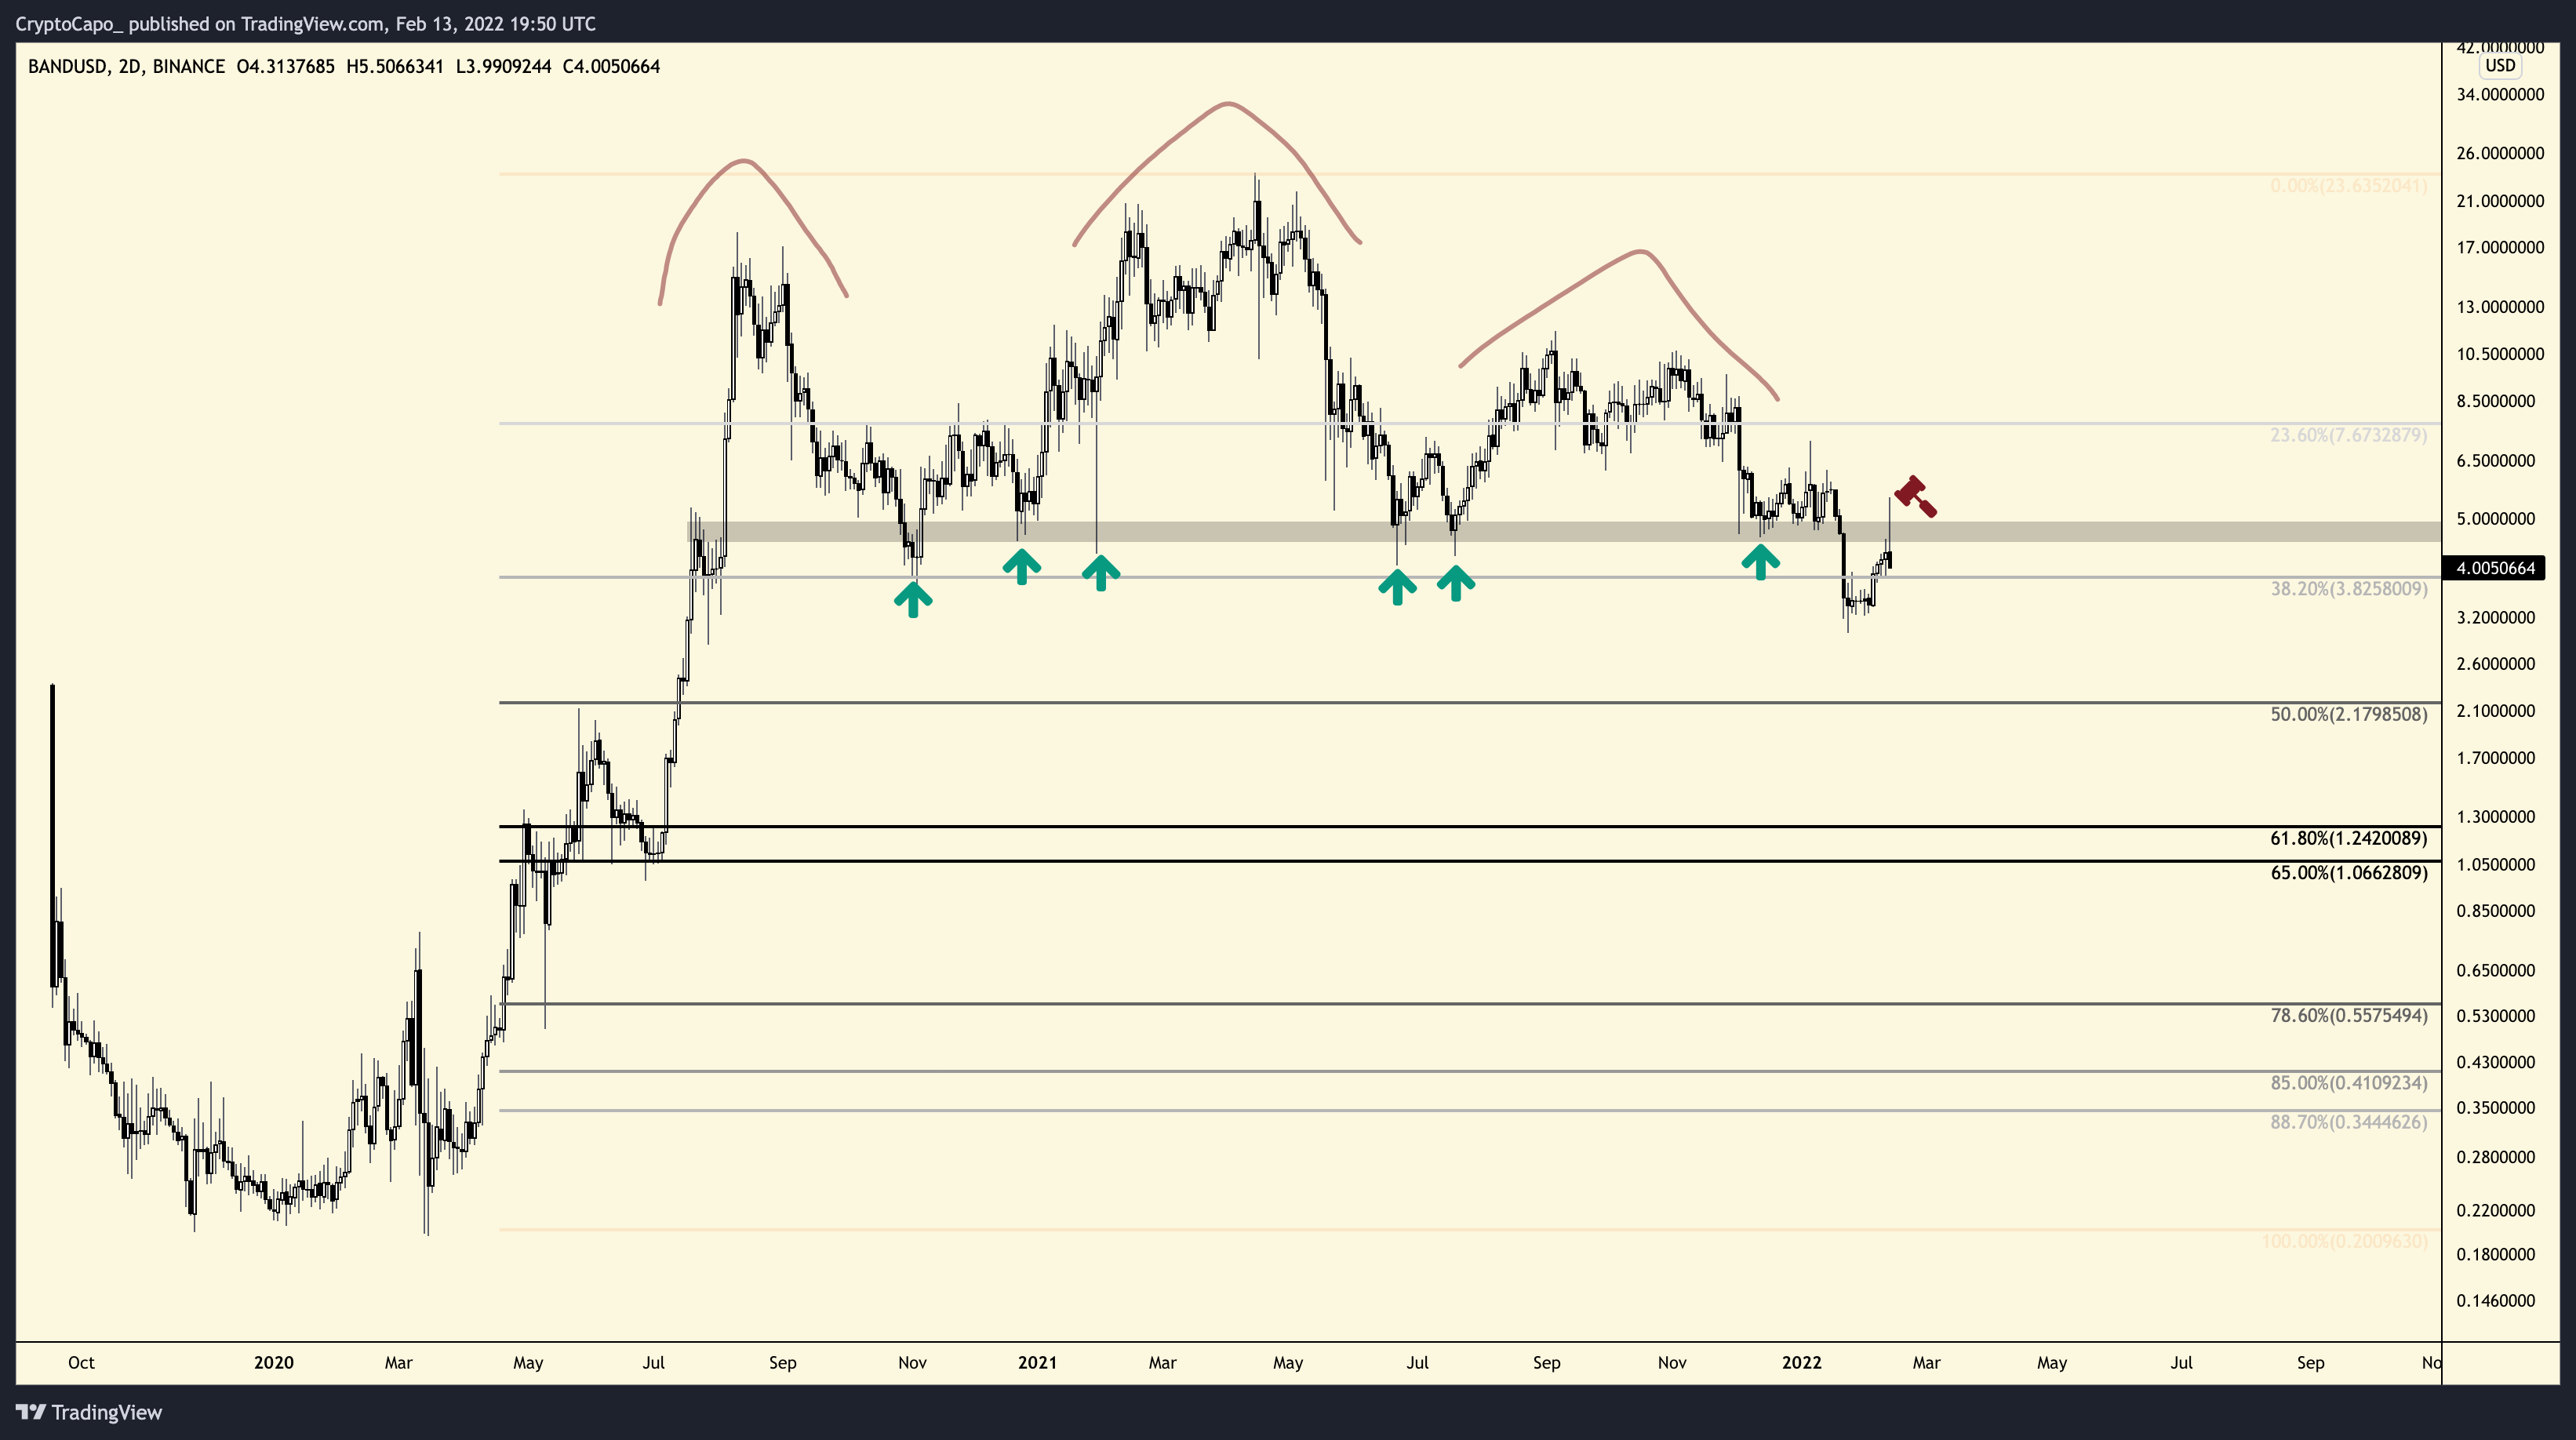
Cryptocurrency trader @CryptoCapo_ tweeted a chart of BAND which shows this same area acting as resistance. Unless the area is reclaimed, the trend will likely remain bearish.
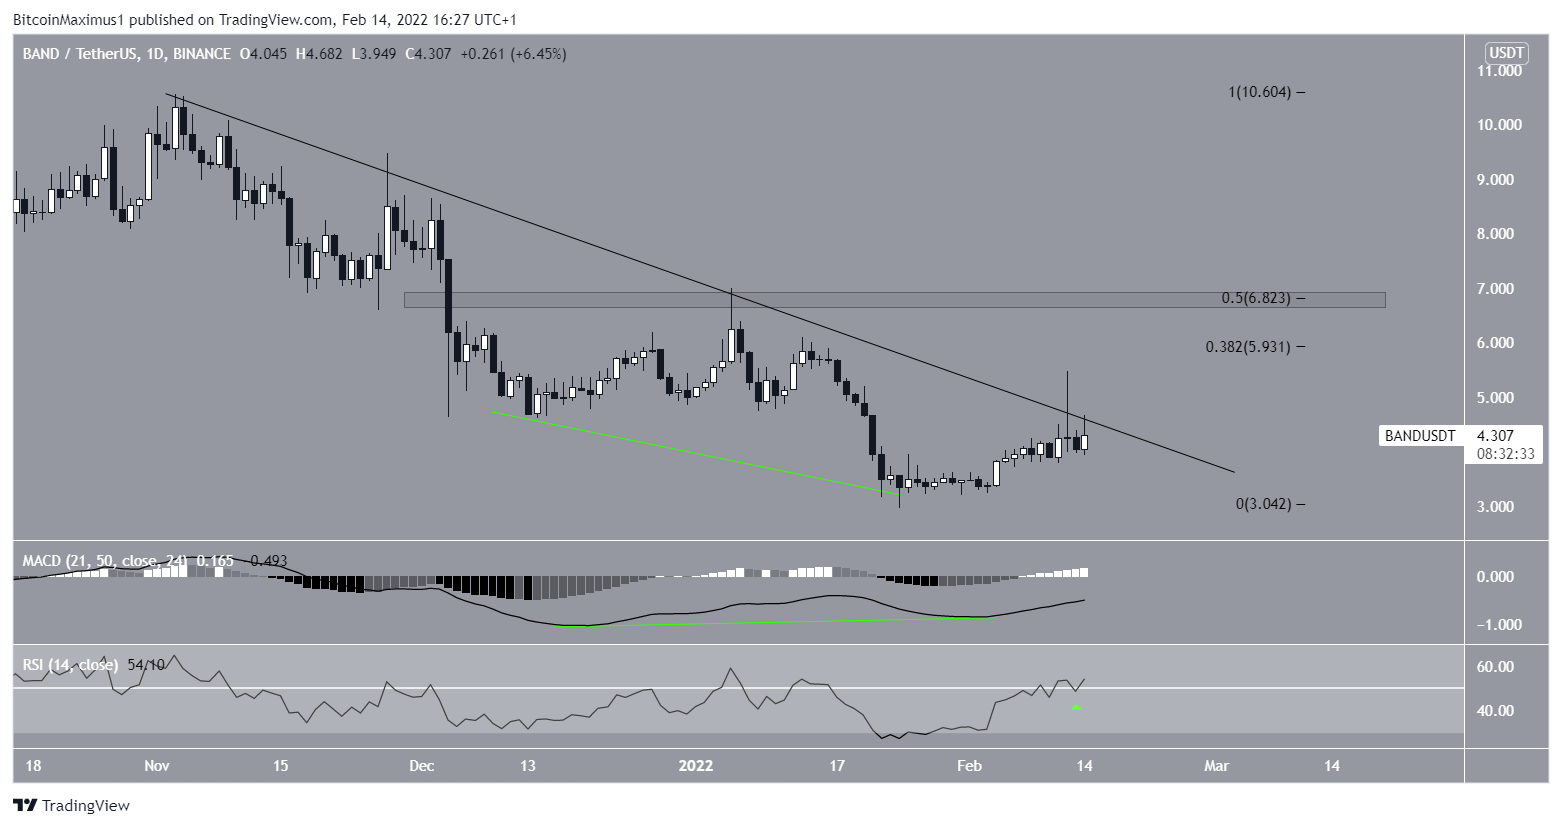
BAND attempts to break out from resistance line
The daily chart shows that BAND is currently making the fourth breakout attempt from a descending resistance line that had previously been in place since Nov 2021.
Technical indicators are showing bullish signs, supporting the possibility of a breakout.
The RSI, which is a momentum indicator, is in the process of moving above 50. This is considered a bullish sign and often occurs during bullish trends.
More importantly, the MACD has generated a very significant bullish divergence (green line). Such divergences often precede upward movements. In this case, it supports the possibility that a breakout from the descending resistance line will transpire.
If one occurs, the next closest resistances would be at $5.93 and $6.82. The former is the 0.382 Fib retracement resistance level, while the latter is both the 0.5 Fib level and a horizontal resistance area.
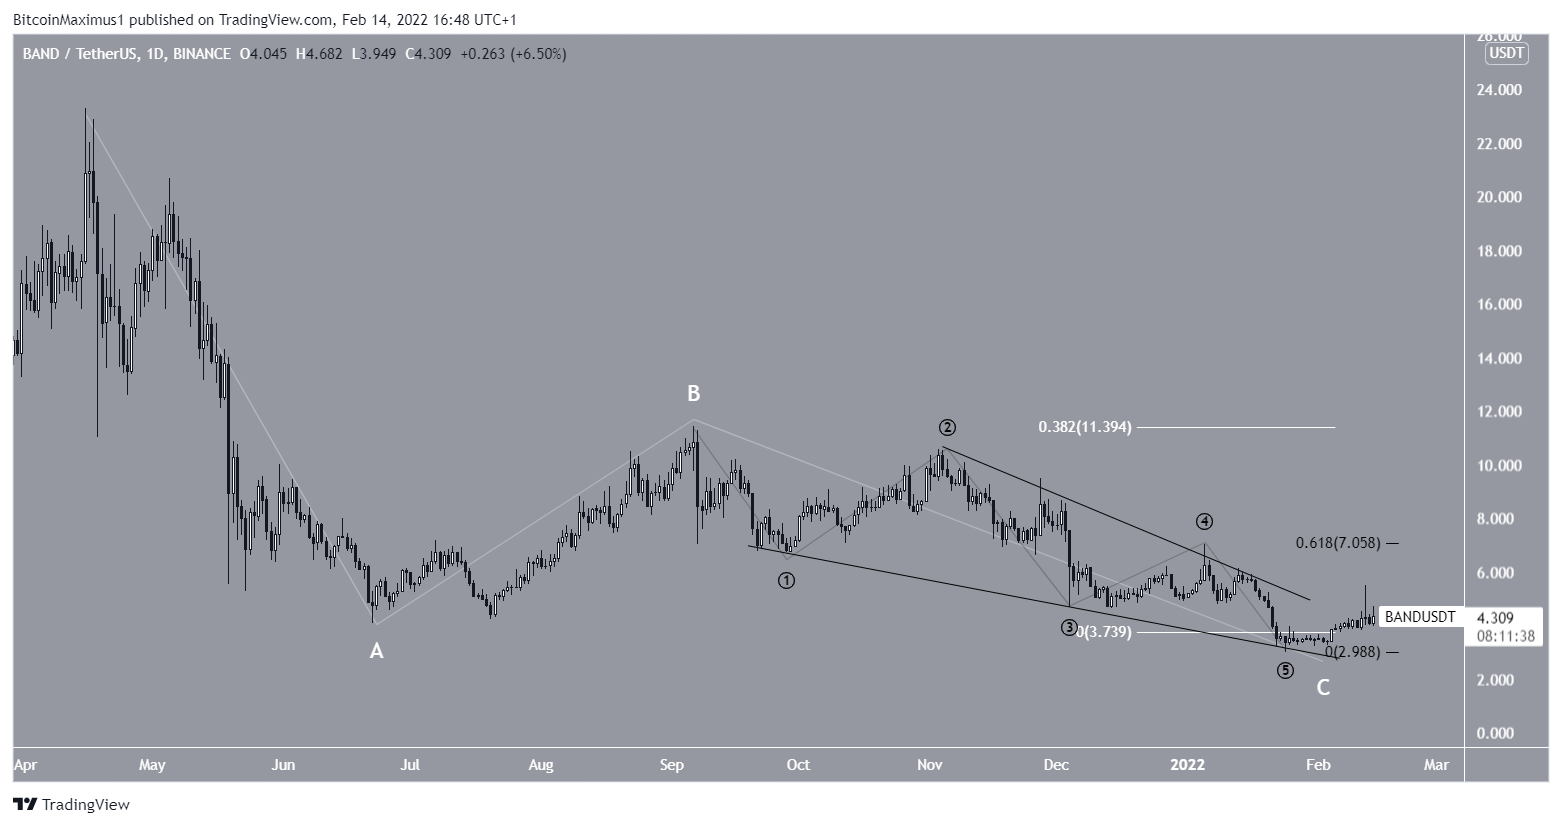
Wave count analysis
Measuring from the aforementioned all-time high price, it is possible that BAND has completed an A-B-C corrective structure (white).
In it, waves A:C have had a 1:0.382 ratio. This is the third most common ratio between the two waves.
The sub-wave count is in black, and shows that wave C took the shape of an ending diagonal.
The ratio for the sub-waves fits perfectly, since sub-wave five has the 0.618 length of the other sub-waves combined. This is very common in such structures.