


The Band Protocol (BAND) price is currently in the process of falling towards the $7.50 support area.
BAND should reach this level again and then begin an upward move potentially towards a new all-time high price.
Breakout and Retest
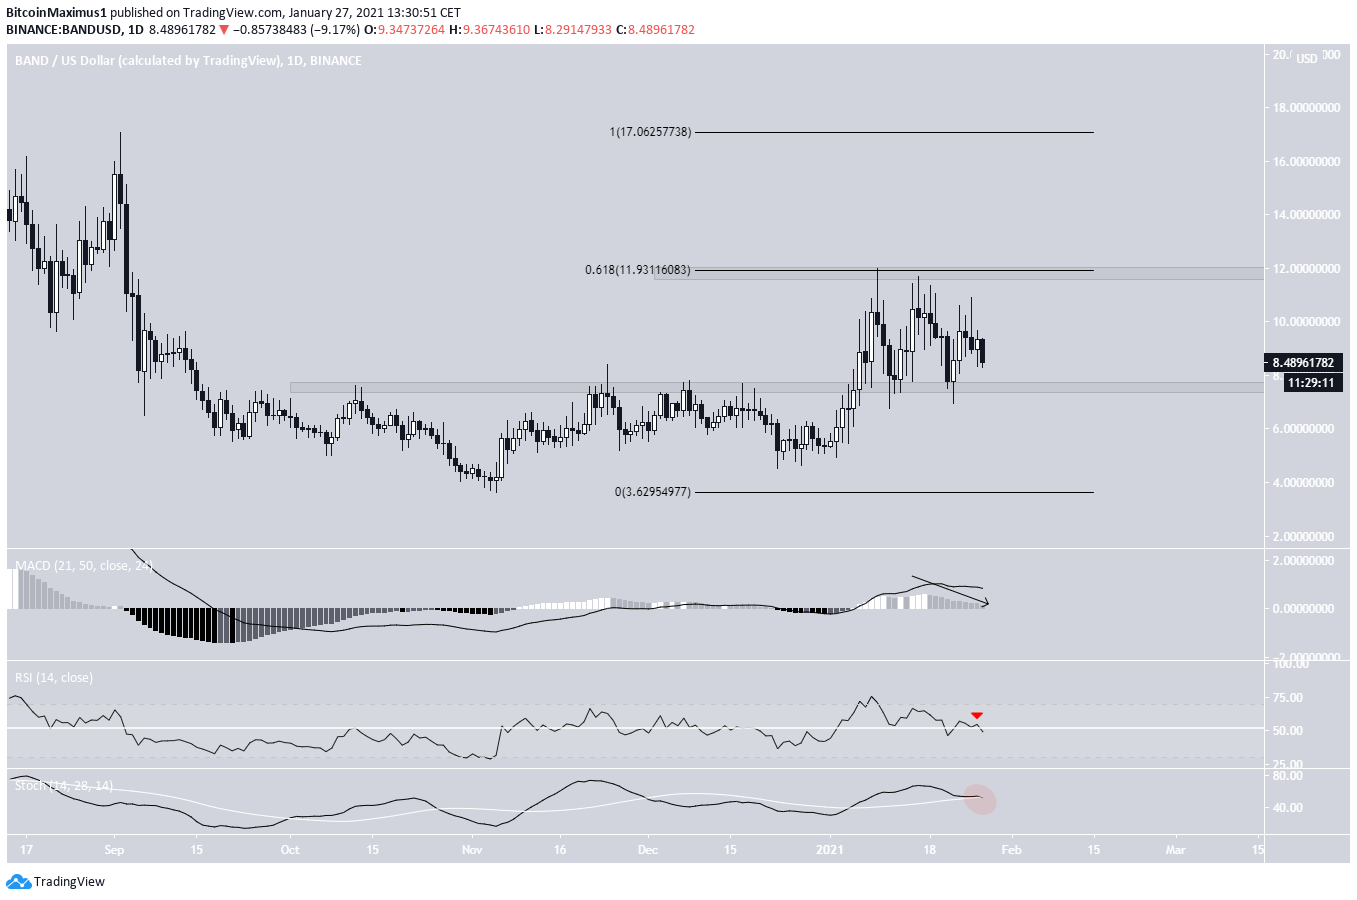
On Jan. 6, BAND broke out from the $7.50 resistance area, which had been in place since September 2020. After reaching a high of $11.99 on Jan. 9, 2021, BAND declined and validated the $7.50 support area.
Since then, BAND has been trading between these two levels, currently sitting close to the support area. Technical indicators have turned bearish. The MACD is falling, nearly crossing into negative territory, the RSI has dropped below 50, and the Stochastic Oscillator has made a bearish cross.
Therefore, another test of the $7.50 area seems likely.
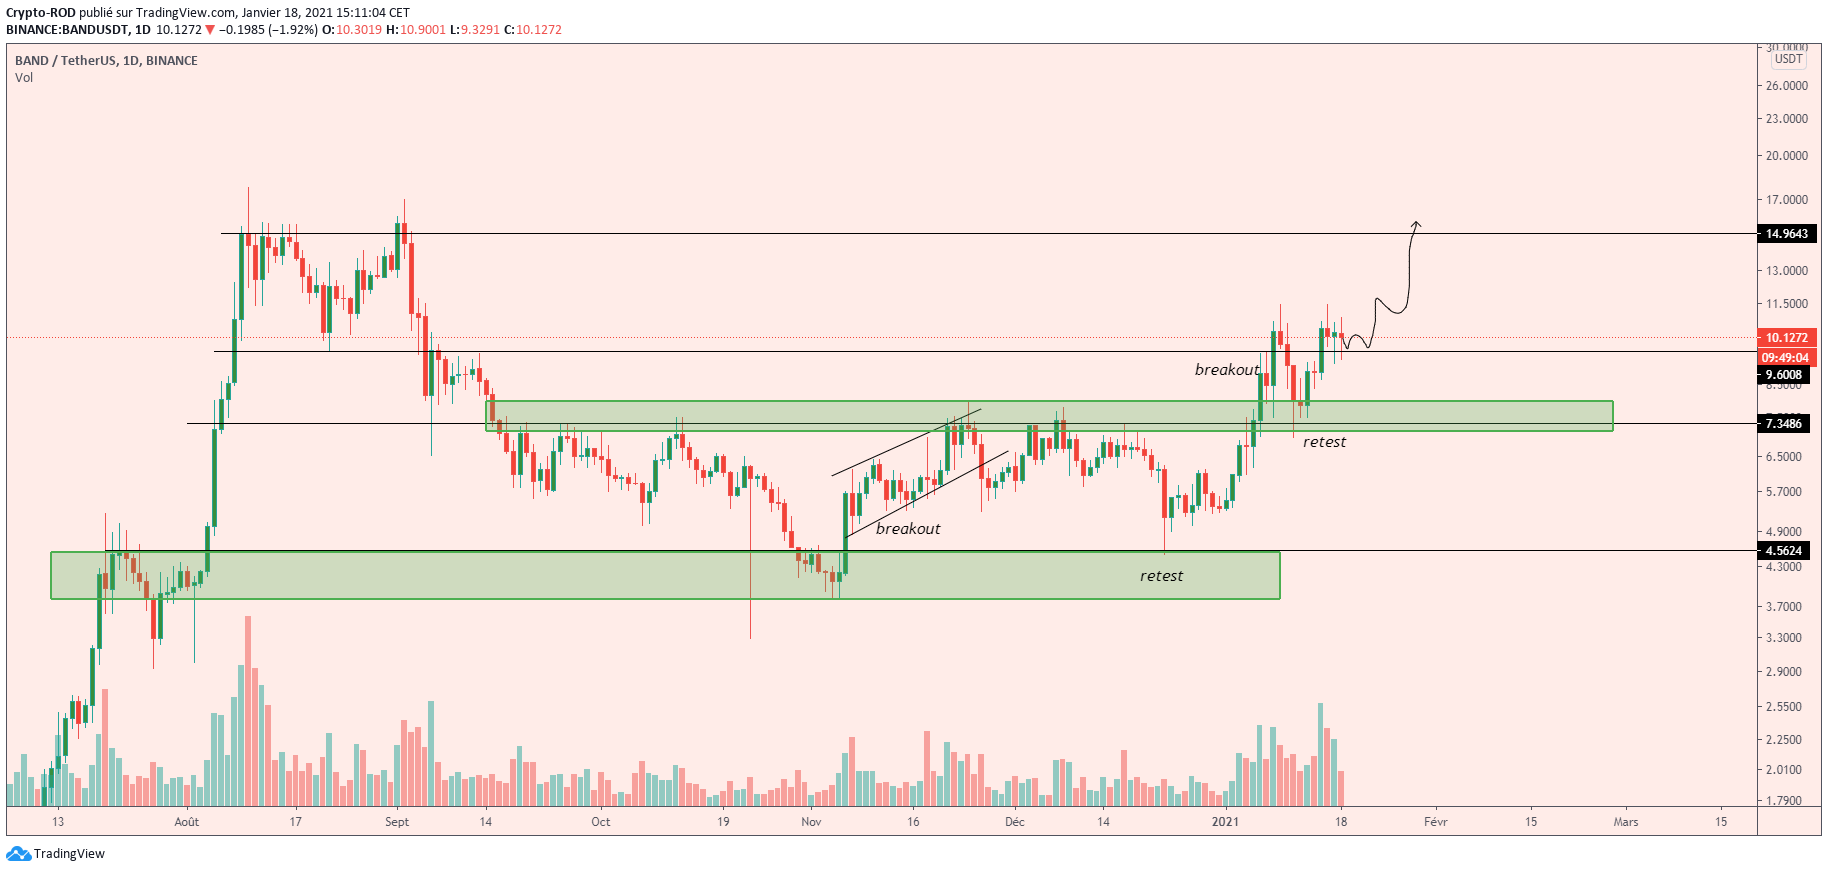
Cryptocurrency trader @Rodmaartin stated that a breakout above the current resistance area would likely take BAND above $14.
However, since this tweet, it has been rejected and is in the process of retesting the support area once more, as outlined above.
Wave Count
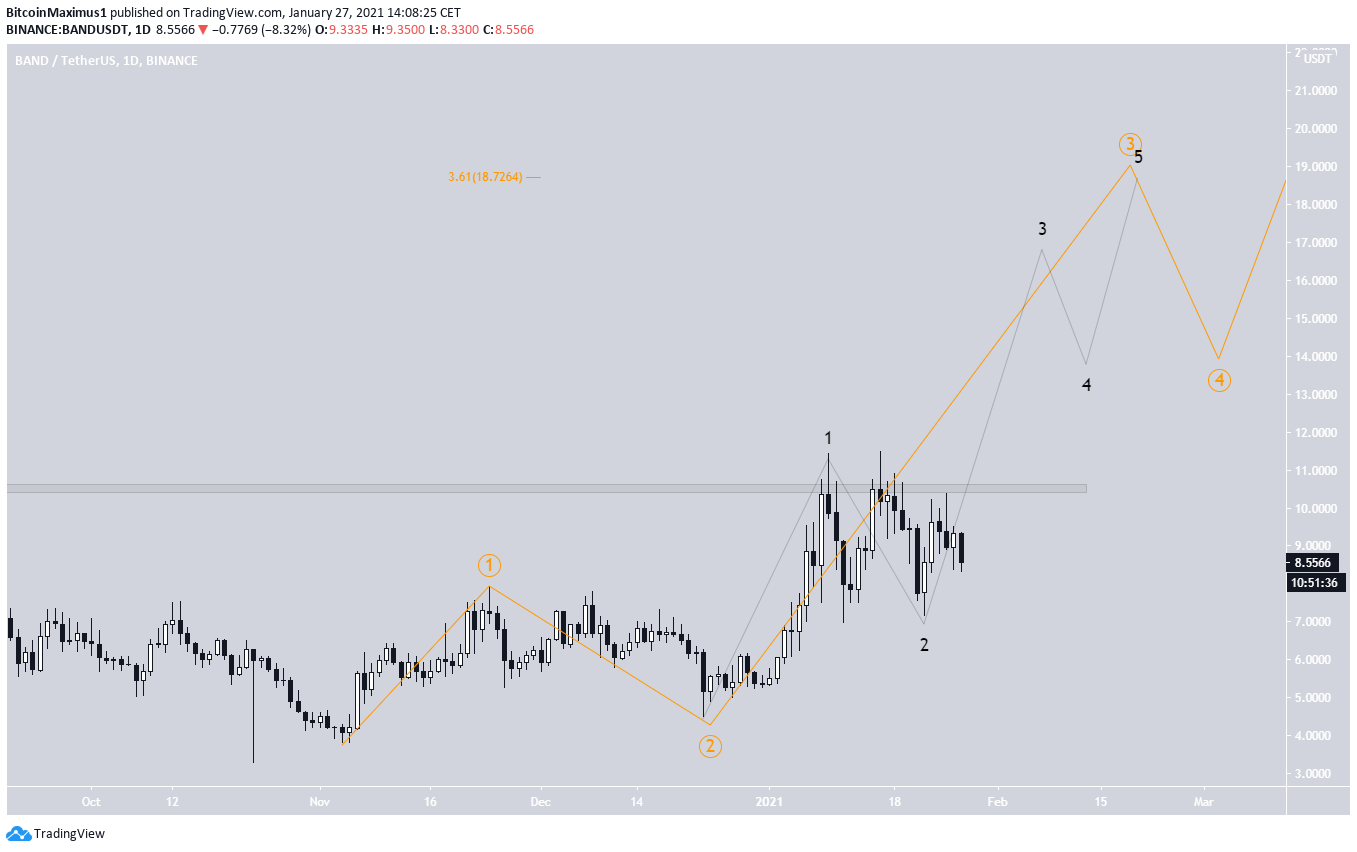
The wave count (shown in orange below) suggests that BAND is currently in wave 3 of a five-wave bullish impulse. The sub-wave count is given in black and shows a 1-2/1-2 wave count.
A likely target for the top of wave 3 is at $18.76, the 3.61 Fib extension of wave 1. However, a more accurate target is likely to be uncovered once more sub-waves develop.
A decline below the wave 2 low of $4.50 would invalidate this particular wave count.
BAND/BTC
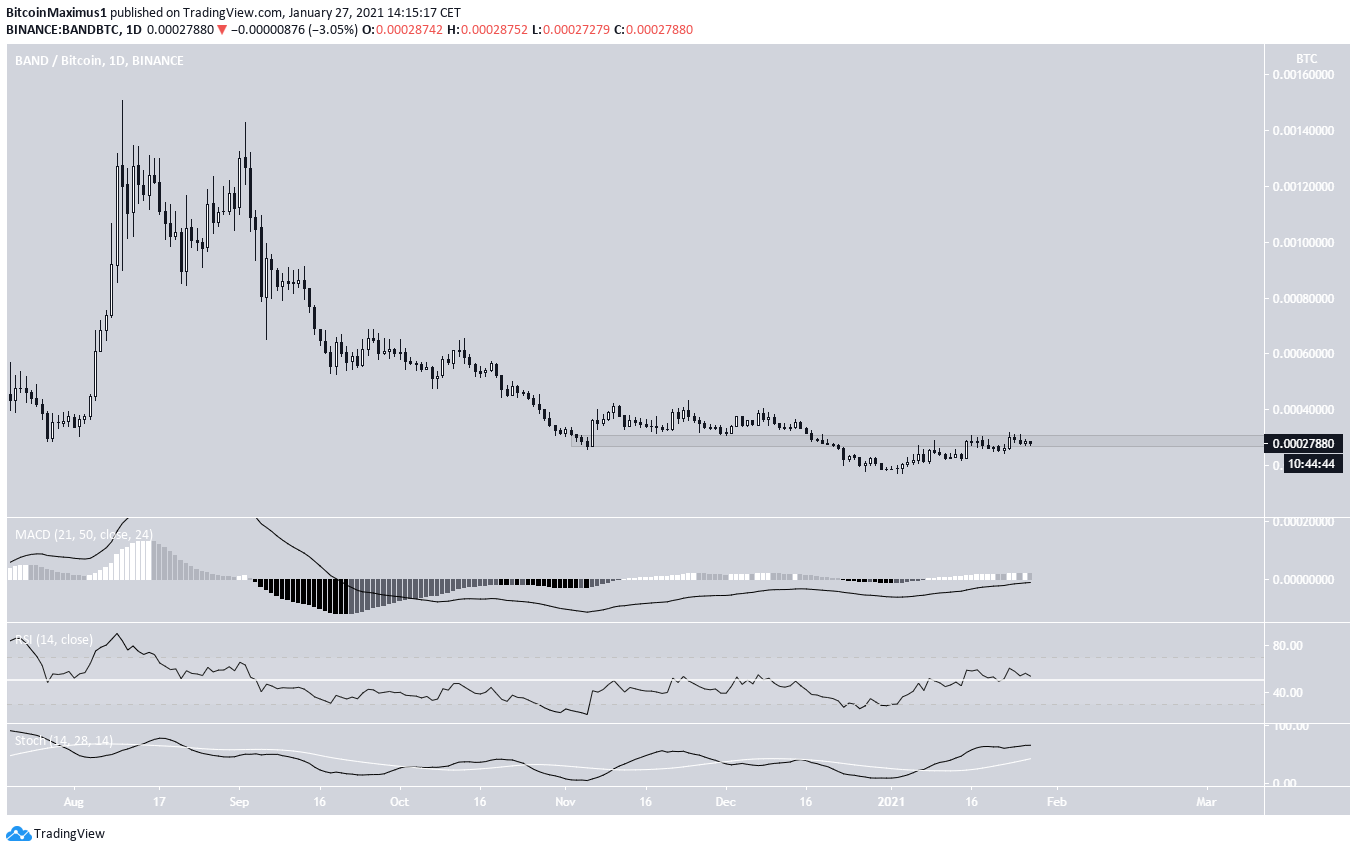
The weekly chart for BAND/BTC shows bullish technical indicators since all three of the: RSI, MACD, and Stochastic Oscillator are moving upwards.
However, BAND has not yet reclaimed the 30,000 satoshi area, which is the previous breakdown level. Despite the bullish indicators, the isn’t bullish until it reclaims the 30,000 satoshi area.
Conclusion
To conclude, BAND should find support soon, possibly retesting the $7.50 area once more before a potential breakout could take it to its all-time high at $17.80.
While the long-term BAND/BTC chart shows signs of a reversal, the trend cannot be considered bullish until the 30,000 satoshi area is reclaimed.
For BeInCrypto’s previous Bitcoin (BTC) analysis, click here!


