

Band Protocol (BAND) has made yet another unsuccessful attempt at moving above the $7.30 resistance area.
However, the price movement and readings from indicators are bullish, suggesting that Band Protocol will be successful in breaking out.
Band Protocol Fails to Move Above Resistance
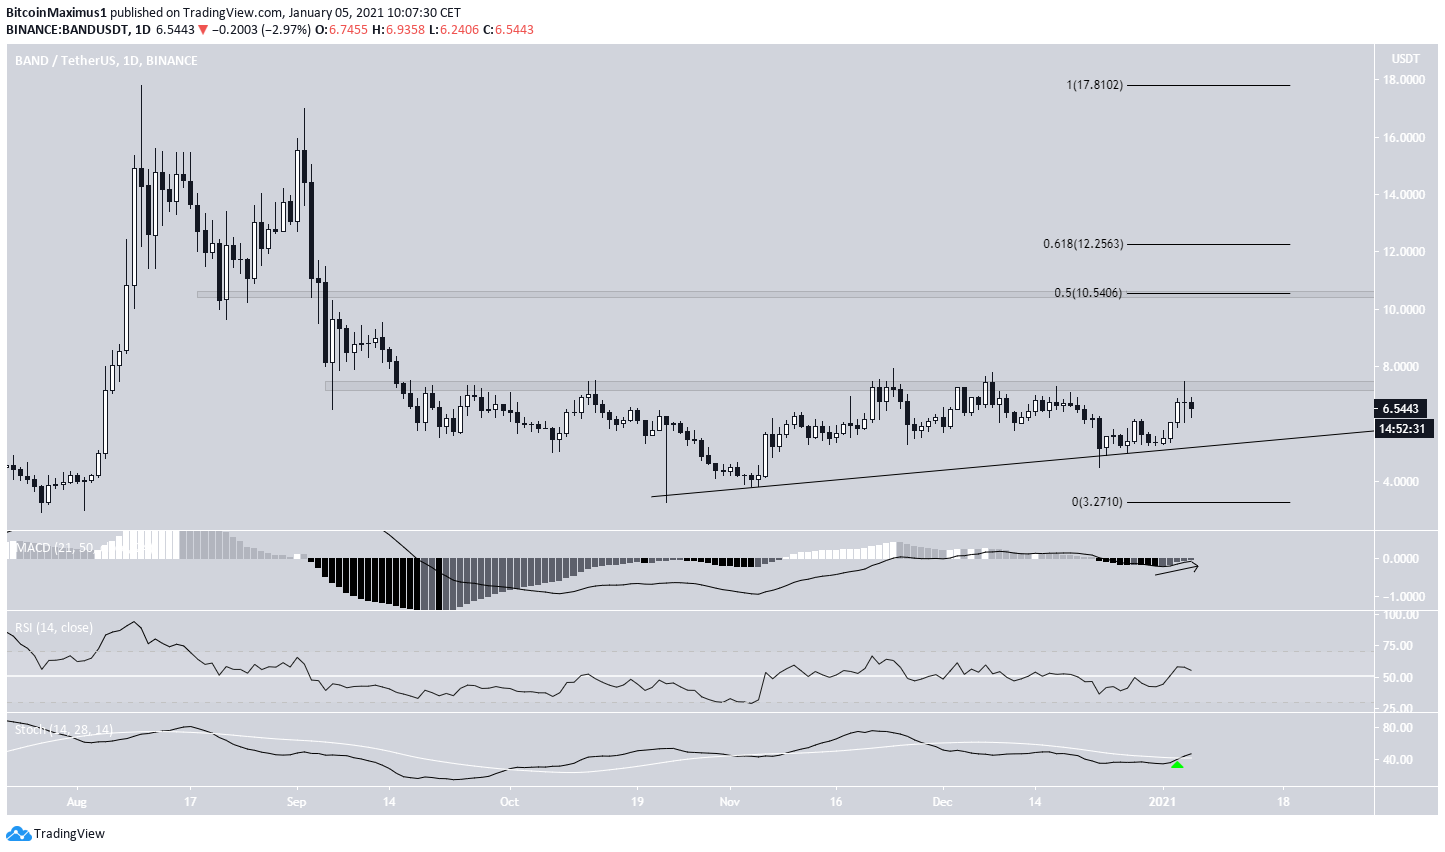
BAND has been facing resistance from the $7.30 area since it first moved below it on Sept. 18. Up to this point, BAND has made five unsuccessful breakout attempts, the most recent being on Jan. 4.
If successful in breaking out, the next resistance areas would be found at $10.55 and $12.25.
While not yet confirmed, it’s possible that BAND is following an ascending support line, which would create an ascending triangle when combined with the aforementioned resistance area. As long as it is trading above this line, the trend is considered bullish.
Technical indicators are also bullish, supporting the possibility that BAND will break out.
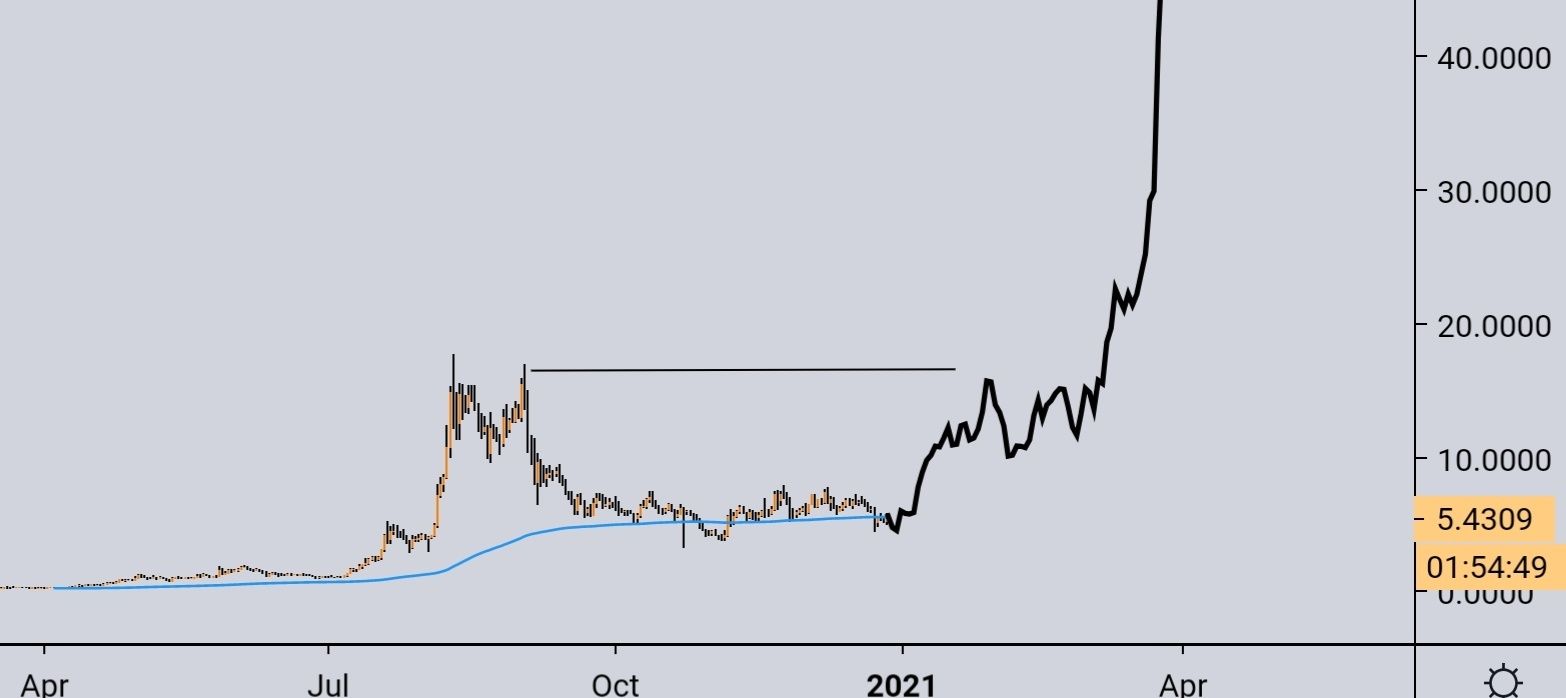
Cryptocurrency trader @BITCOINTRAPPER outlined a BAND chart, stating that they believe it will be the one to lead the Oracle coins and will eventually move towards a new all-time high.
While this is indeed possible, there are numerous resistance levels left to clear for BAND in order to reach a new all-time high.
Short-Term Breakout
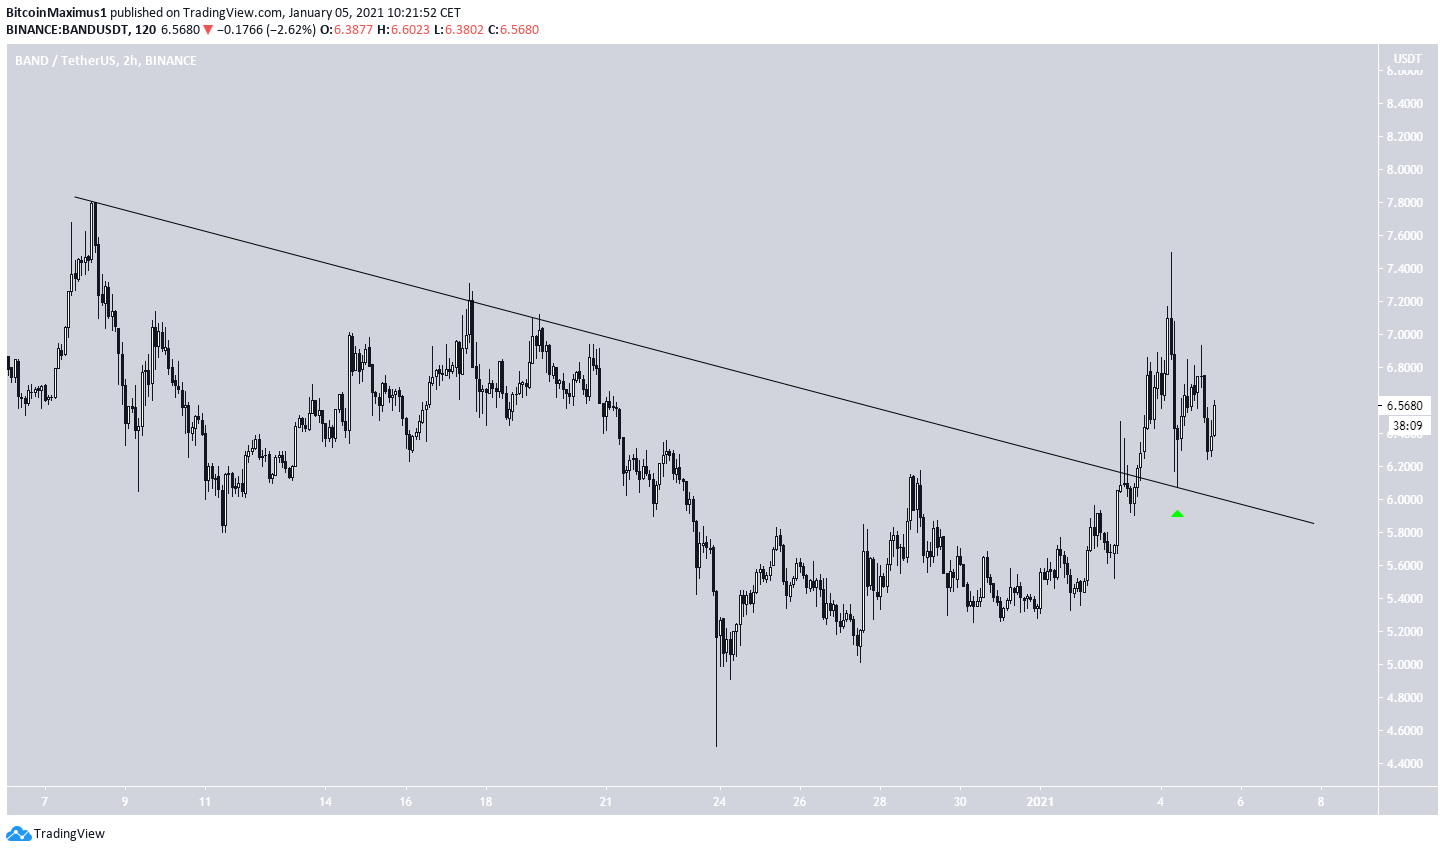
The two-hour chart shows a breakout from a descending resistance line that BAND validated as support after (shown with the green arrow in the image below).
This movement supports the findings from the previous section and suggests that a continuation of the upward move is likely.
BAND Wave Count
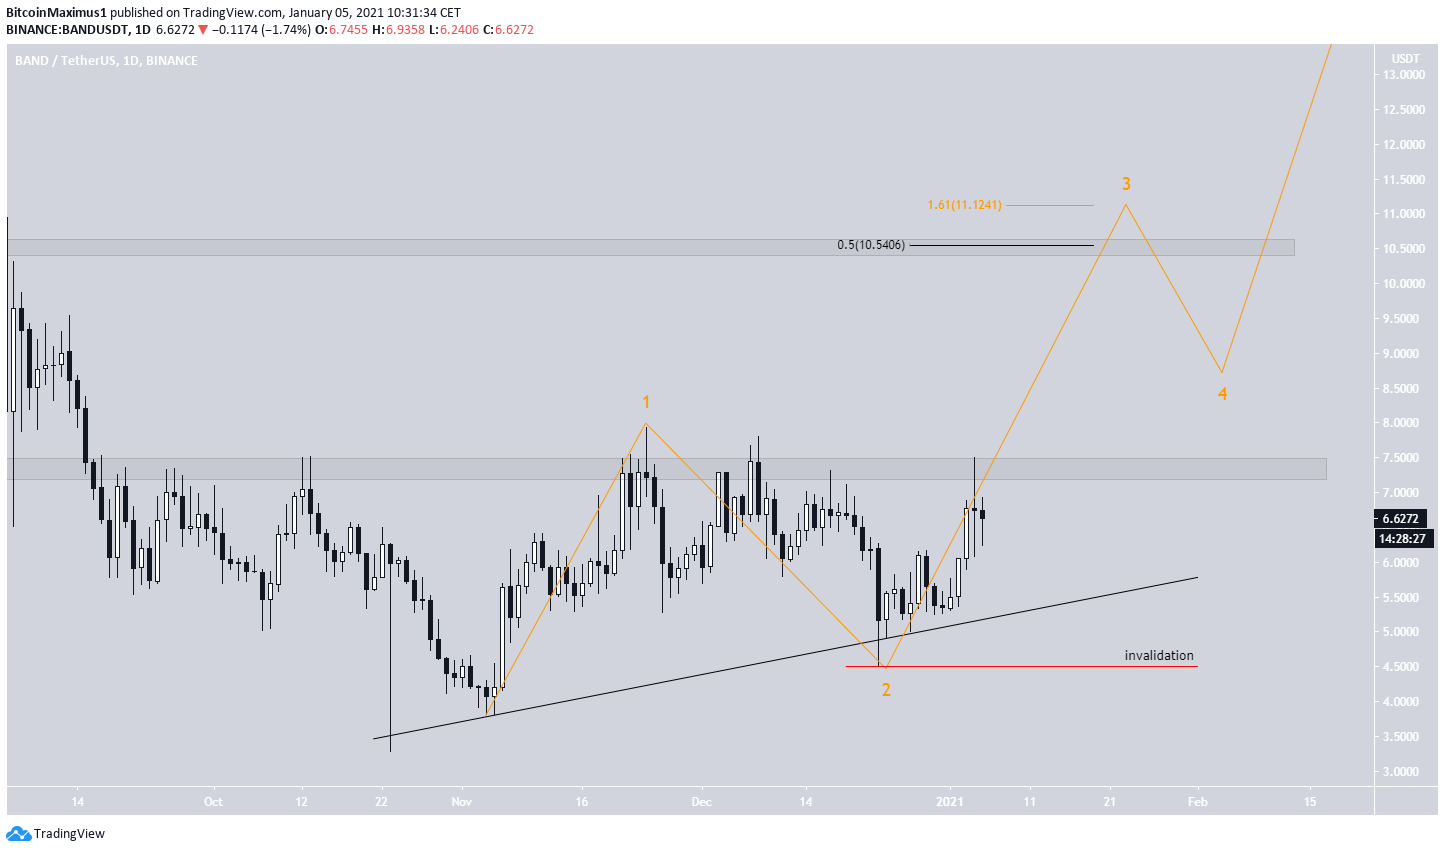
The most likely wave count (shown in orange below) suggests that BAND is currently in wave 3 of a five-wave bullish impulse.
A likely target for the top of wave 3 is found between $10.55-$11.12, which is the previously outlined 0.5 Fib retracement resistance level and the 1.61 Fib extension of wave 1 respectively.
A decrease below the wave 2 low of $4.50 (red line) would invalidate this particular wave count.
Conclusion
Band Protocol is expected to break out above the current resistance area and gradually move towards the next resistance levels at $10.55 and $12.25.
A decrease below $4.50 or a breakdown from the ascending support line would invalidate this scenario.
For BeInCrypto’s latest Bitcoin (BTC) analysis, click here!
Disclaimer: Cryptocurrency trading carries a high level of risk and may not be suitable for all investors. The views expressed in this article do not reflect those of BeInCrypto.
Disclaimer
In line with the Trust Project guidelines, this price analysis article is for informational purposes only and should not be considered financial or investment advice. BeInCrypto is committed to accurate, unbiased reporting, but market conditions are subject to change without notice. Always conduct your own research and consult with a professional before making any financial decisions. Please note that our Terms and Conditions, Privacy Policy, and Disclaimers have been updated.
