


Balancer (BAL) has created a short-term bullish pattern, which is expected to lead to a short-term increase. However, the direction of the long-term trend is uncertain.
BAL has been falling since reaching an all-time high price of $75.09 on May 4. The downward movement continued until a low of $10.40 was reached on Jan 24.
BAL increased at a very gradual pace until March 25, when it accelerated the rate of increase. This caused a breakout from a descending wedge, in which the price had been trading since Sept. The price reached a high of $21.98 before falling.
Despite the breakout, BAL is still trading 80% below its all-time high price.
If the upward movement continues, the closest significant resistance area would be at $34. The area has not been reached since Sept 2021.
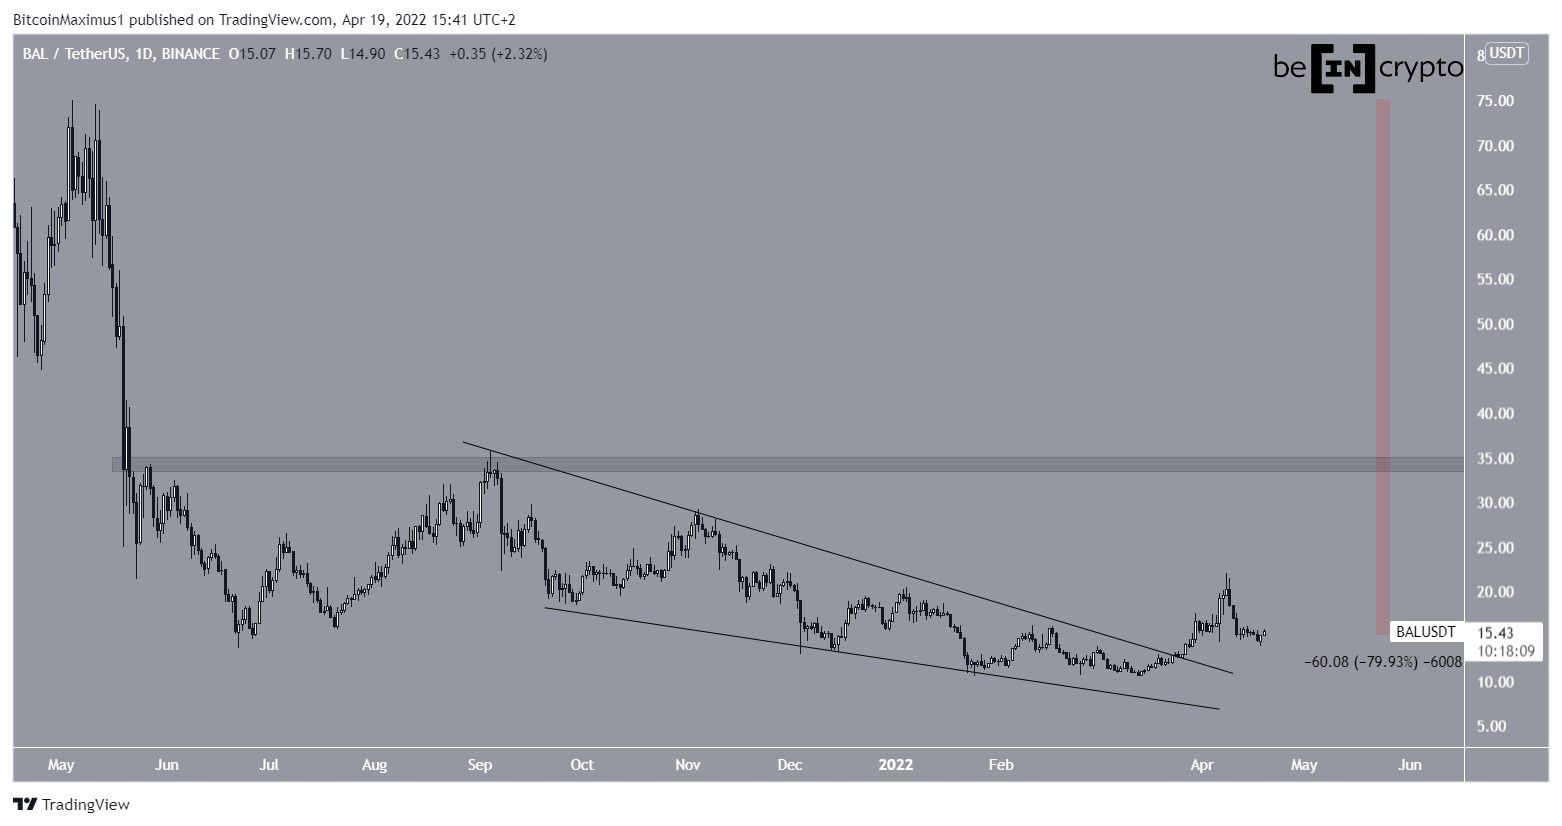
BAL breaks out
A closer look at the daily time frame shows that the ongoing breakout was preceded by bullish divergence in both the RSI and MACD (green lines). Such divergences usually precede bullish trend reversals, as was the case with BAL.
Despite the early April drop, technical indicators are still bullish. The first reason for this is that the trendline of the divergence is intact in both the RSI and MACD. The second one is that the RSI is holding on above 50 while the MACD is still positive.
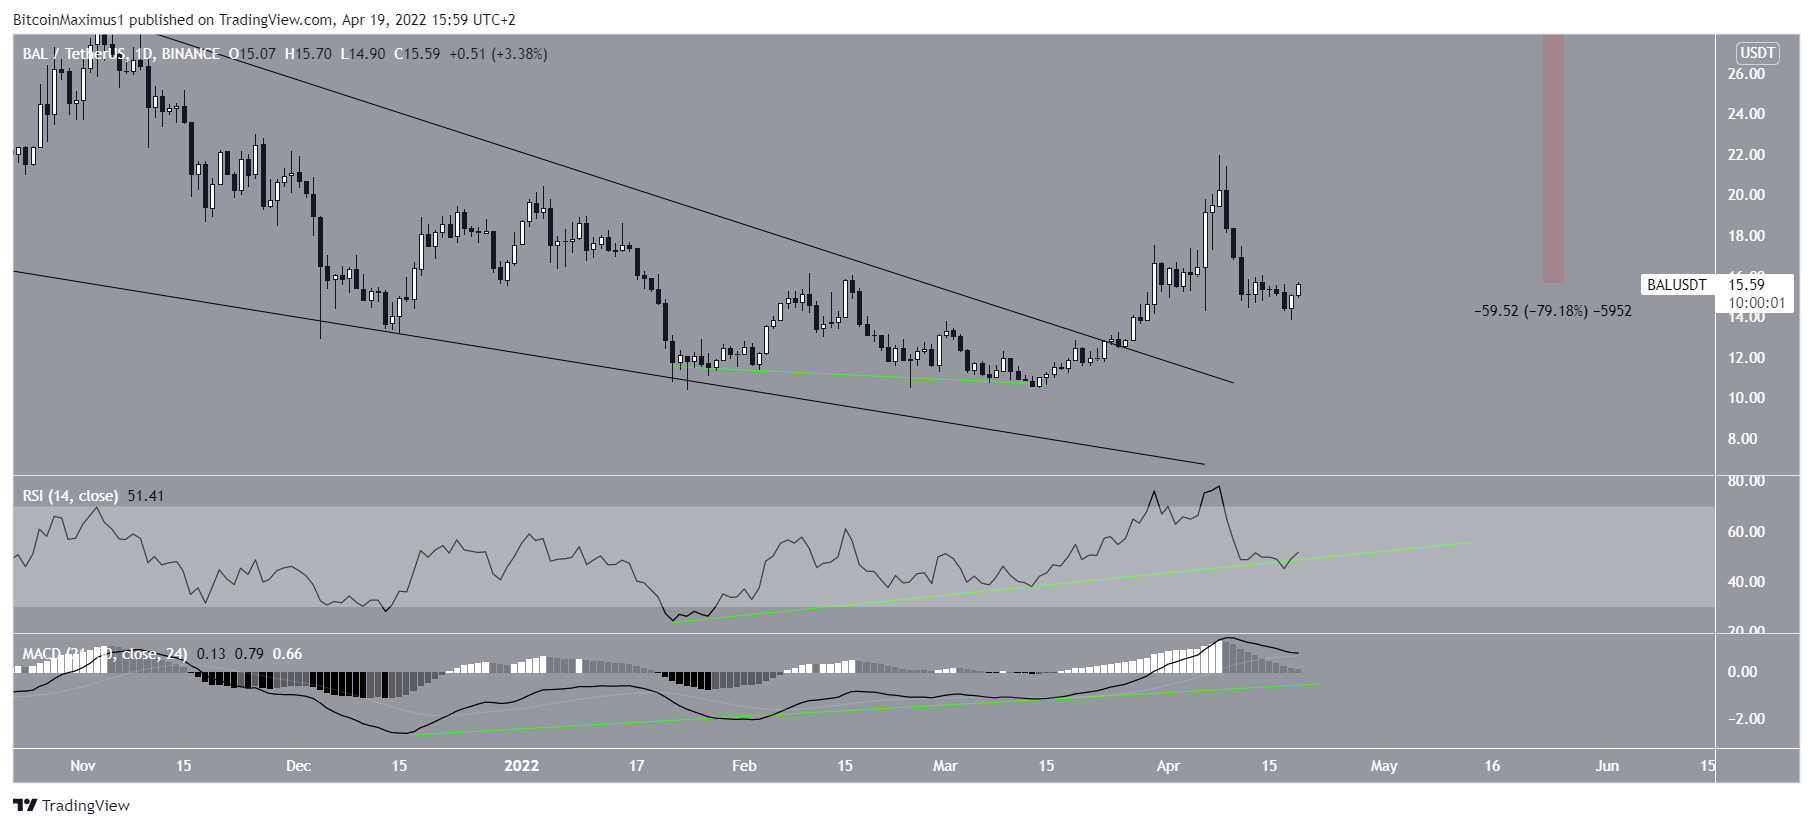
Short-term movement
Cryptocurrency trader @TheEuroSniper tweeted a chart of BAL, stating that the price could increase all the way to $16.80.
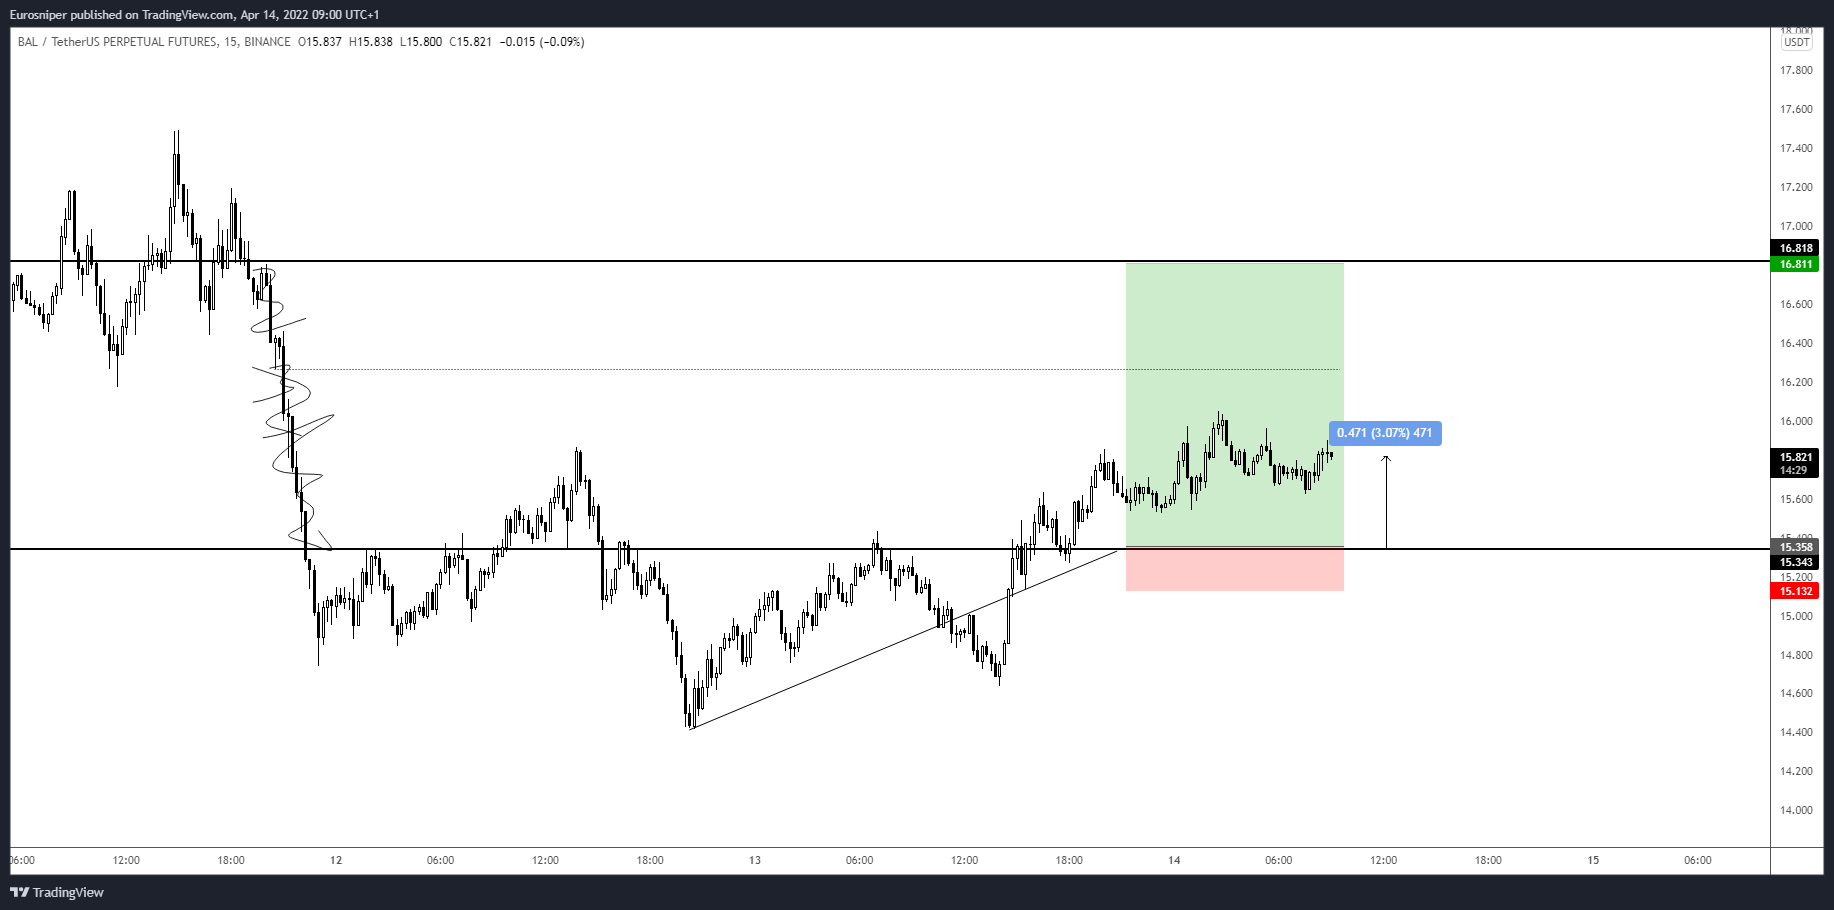
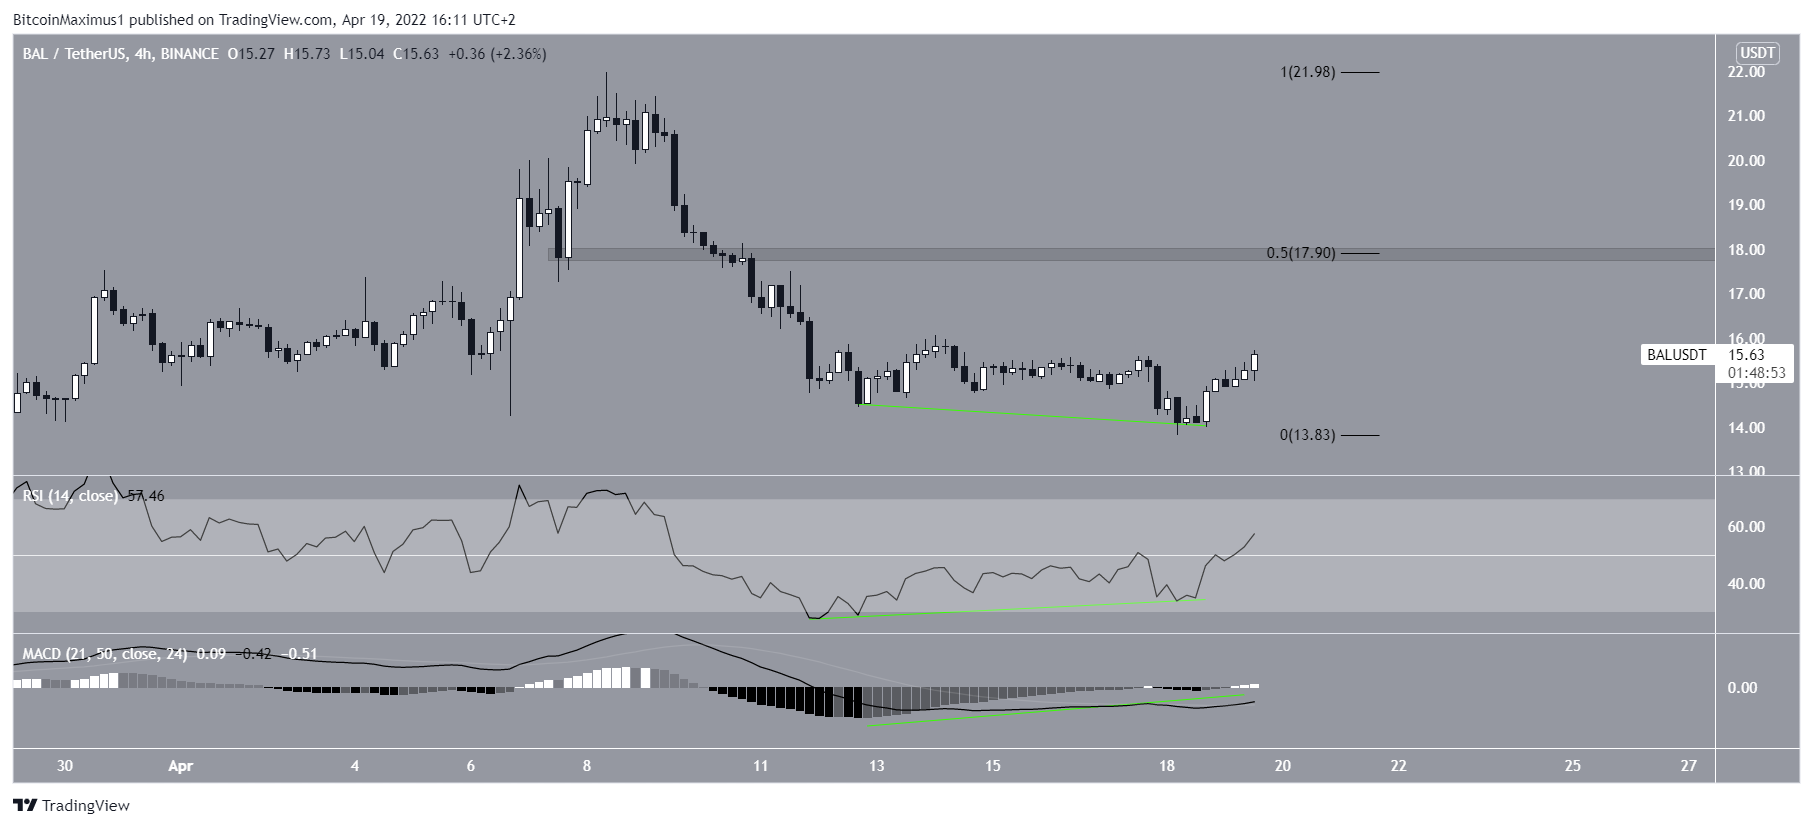
Even though BAL has been falling since April 8, it seemingly created a double bottom pattern between April 14 and 18. Besides being a bullish pattern, the double bottom was combined with bullish divergences in both the RSI and MACD.
If the upward movement continues, the next closest resistance area would be at $15.90. This is a horizontal resistance area and the 0.5 Fib retracement resistance level when measuring the entire drop.
For Be[in]Crypto’s latest Bitcoin (BTC) analysis, click here


