


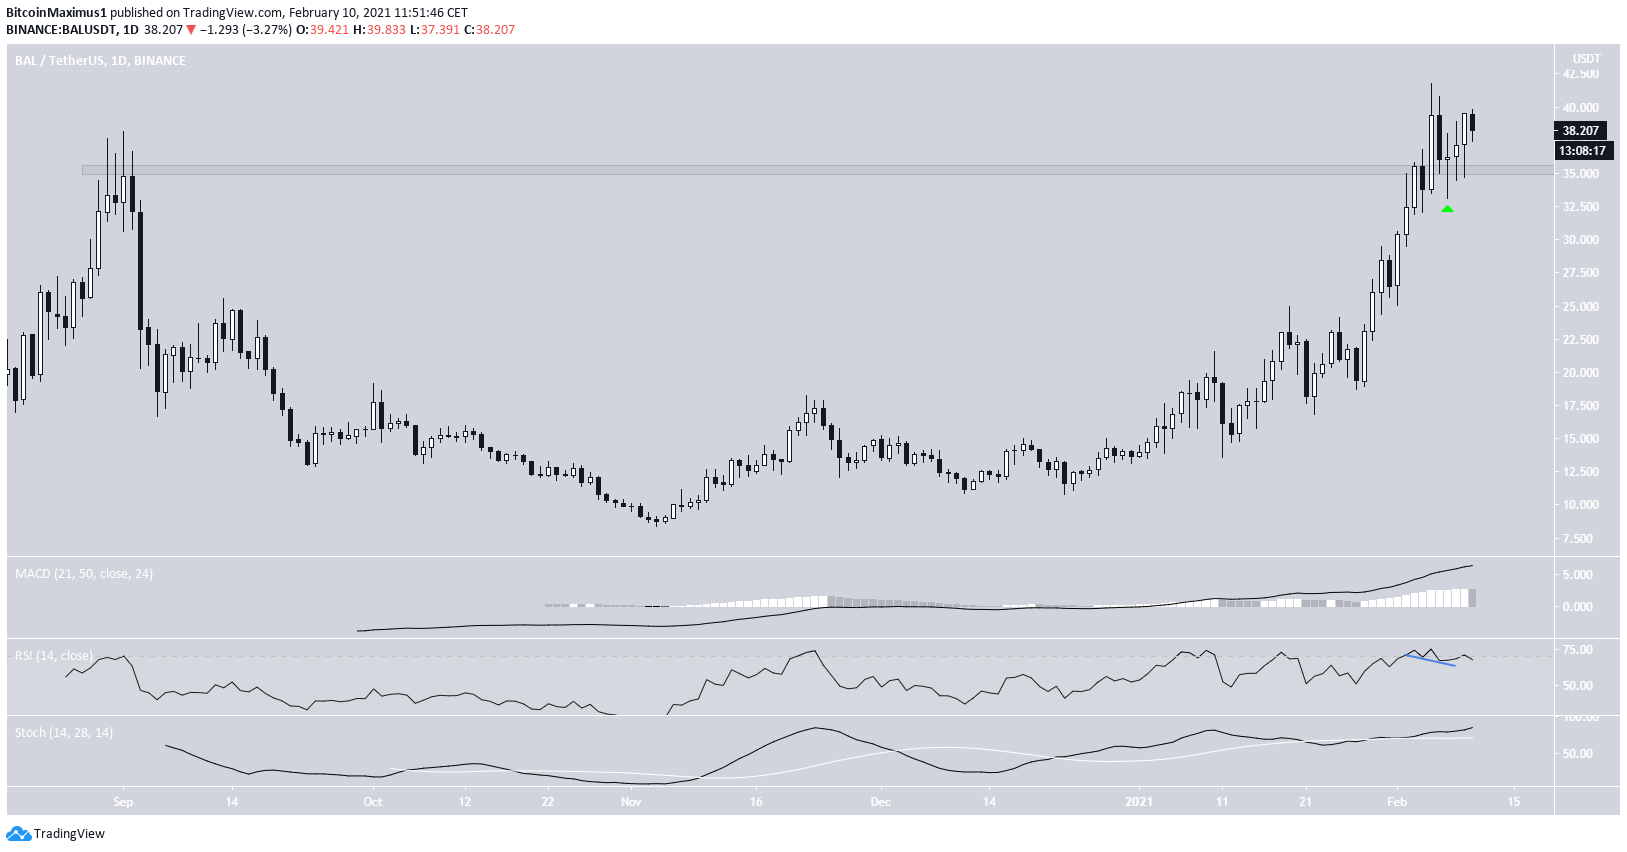
On Feb. 5, the Balancer (BAL) price reached an all-time high price of $41.50.
While BAL has been falling since, the move served to validate the breakout level as support, and it should continue higher once more.
All-Time High
BAL has been moving upwards since it reached a low of $8.37 on Nov. 4, 2020. Following the all-time high, it fell slightly and validated the previous resistance area at $35.50, confirming it as support. As long as price action is trading above this level, the trend is bullish.
Technical indicators are also bullish, supporting the continuation of the upward move. While the RSI has declined below 70, it has also generated hidden bullish divergence, a strong sign of trend continuation.
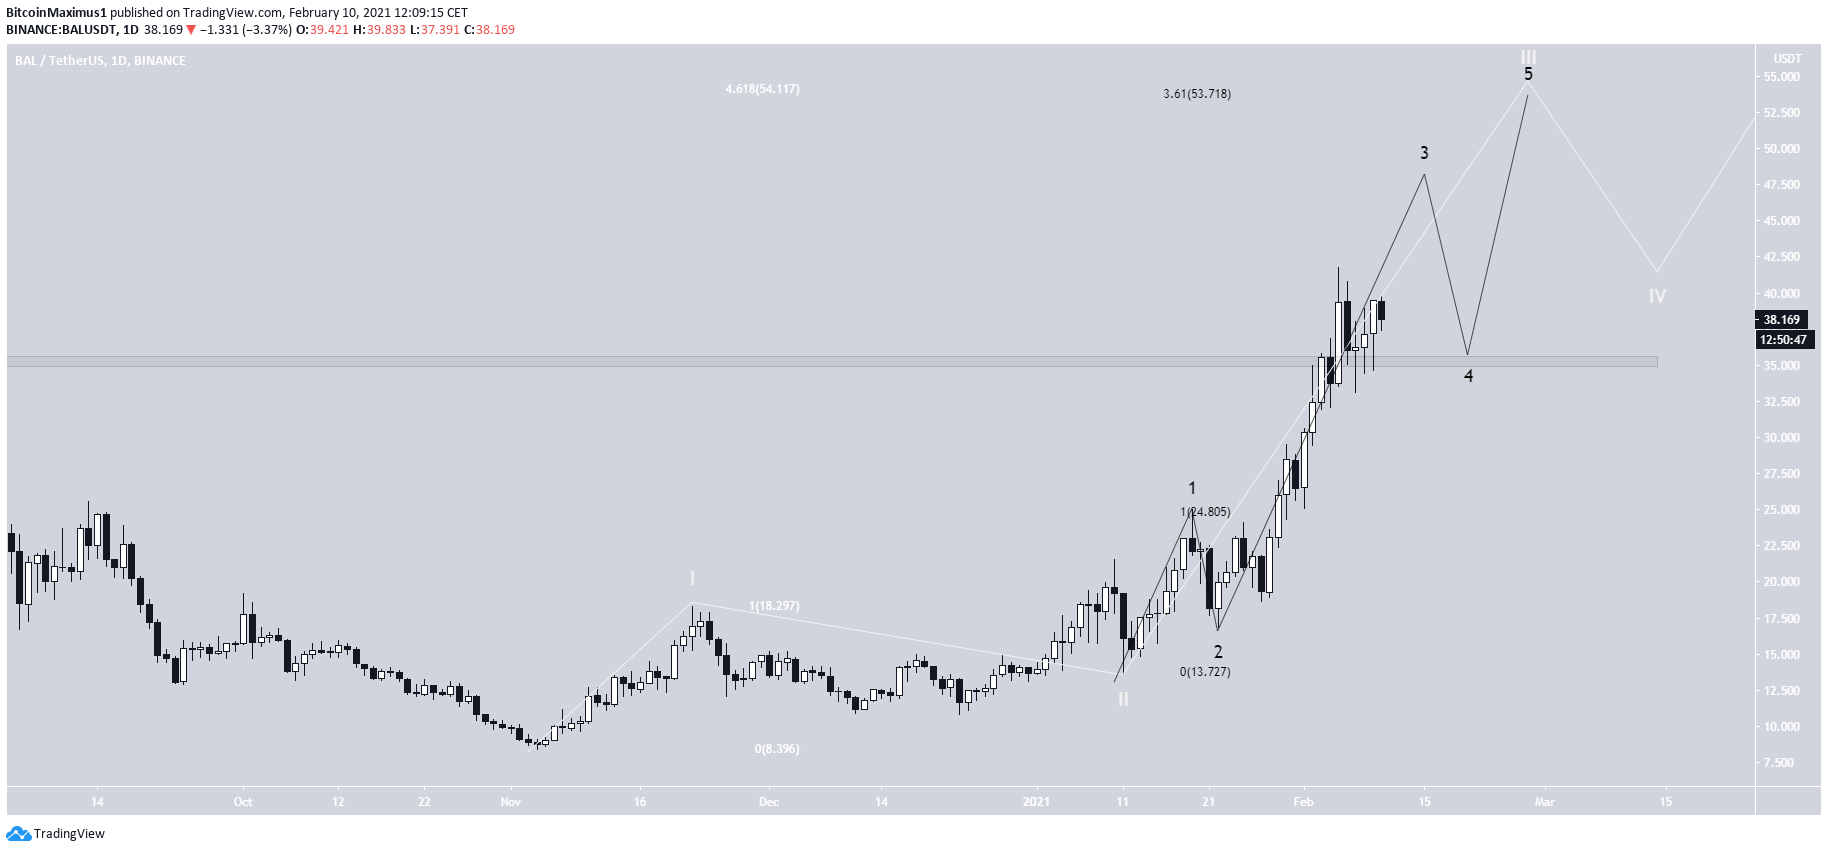
Wave Count
Cryptocurrency trader @PostyXBT outlined a BAL chart, stating that the price could rally all the way to $50.
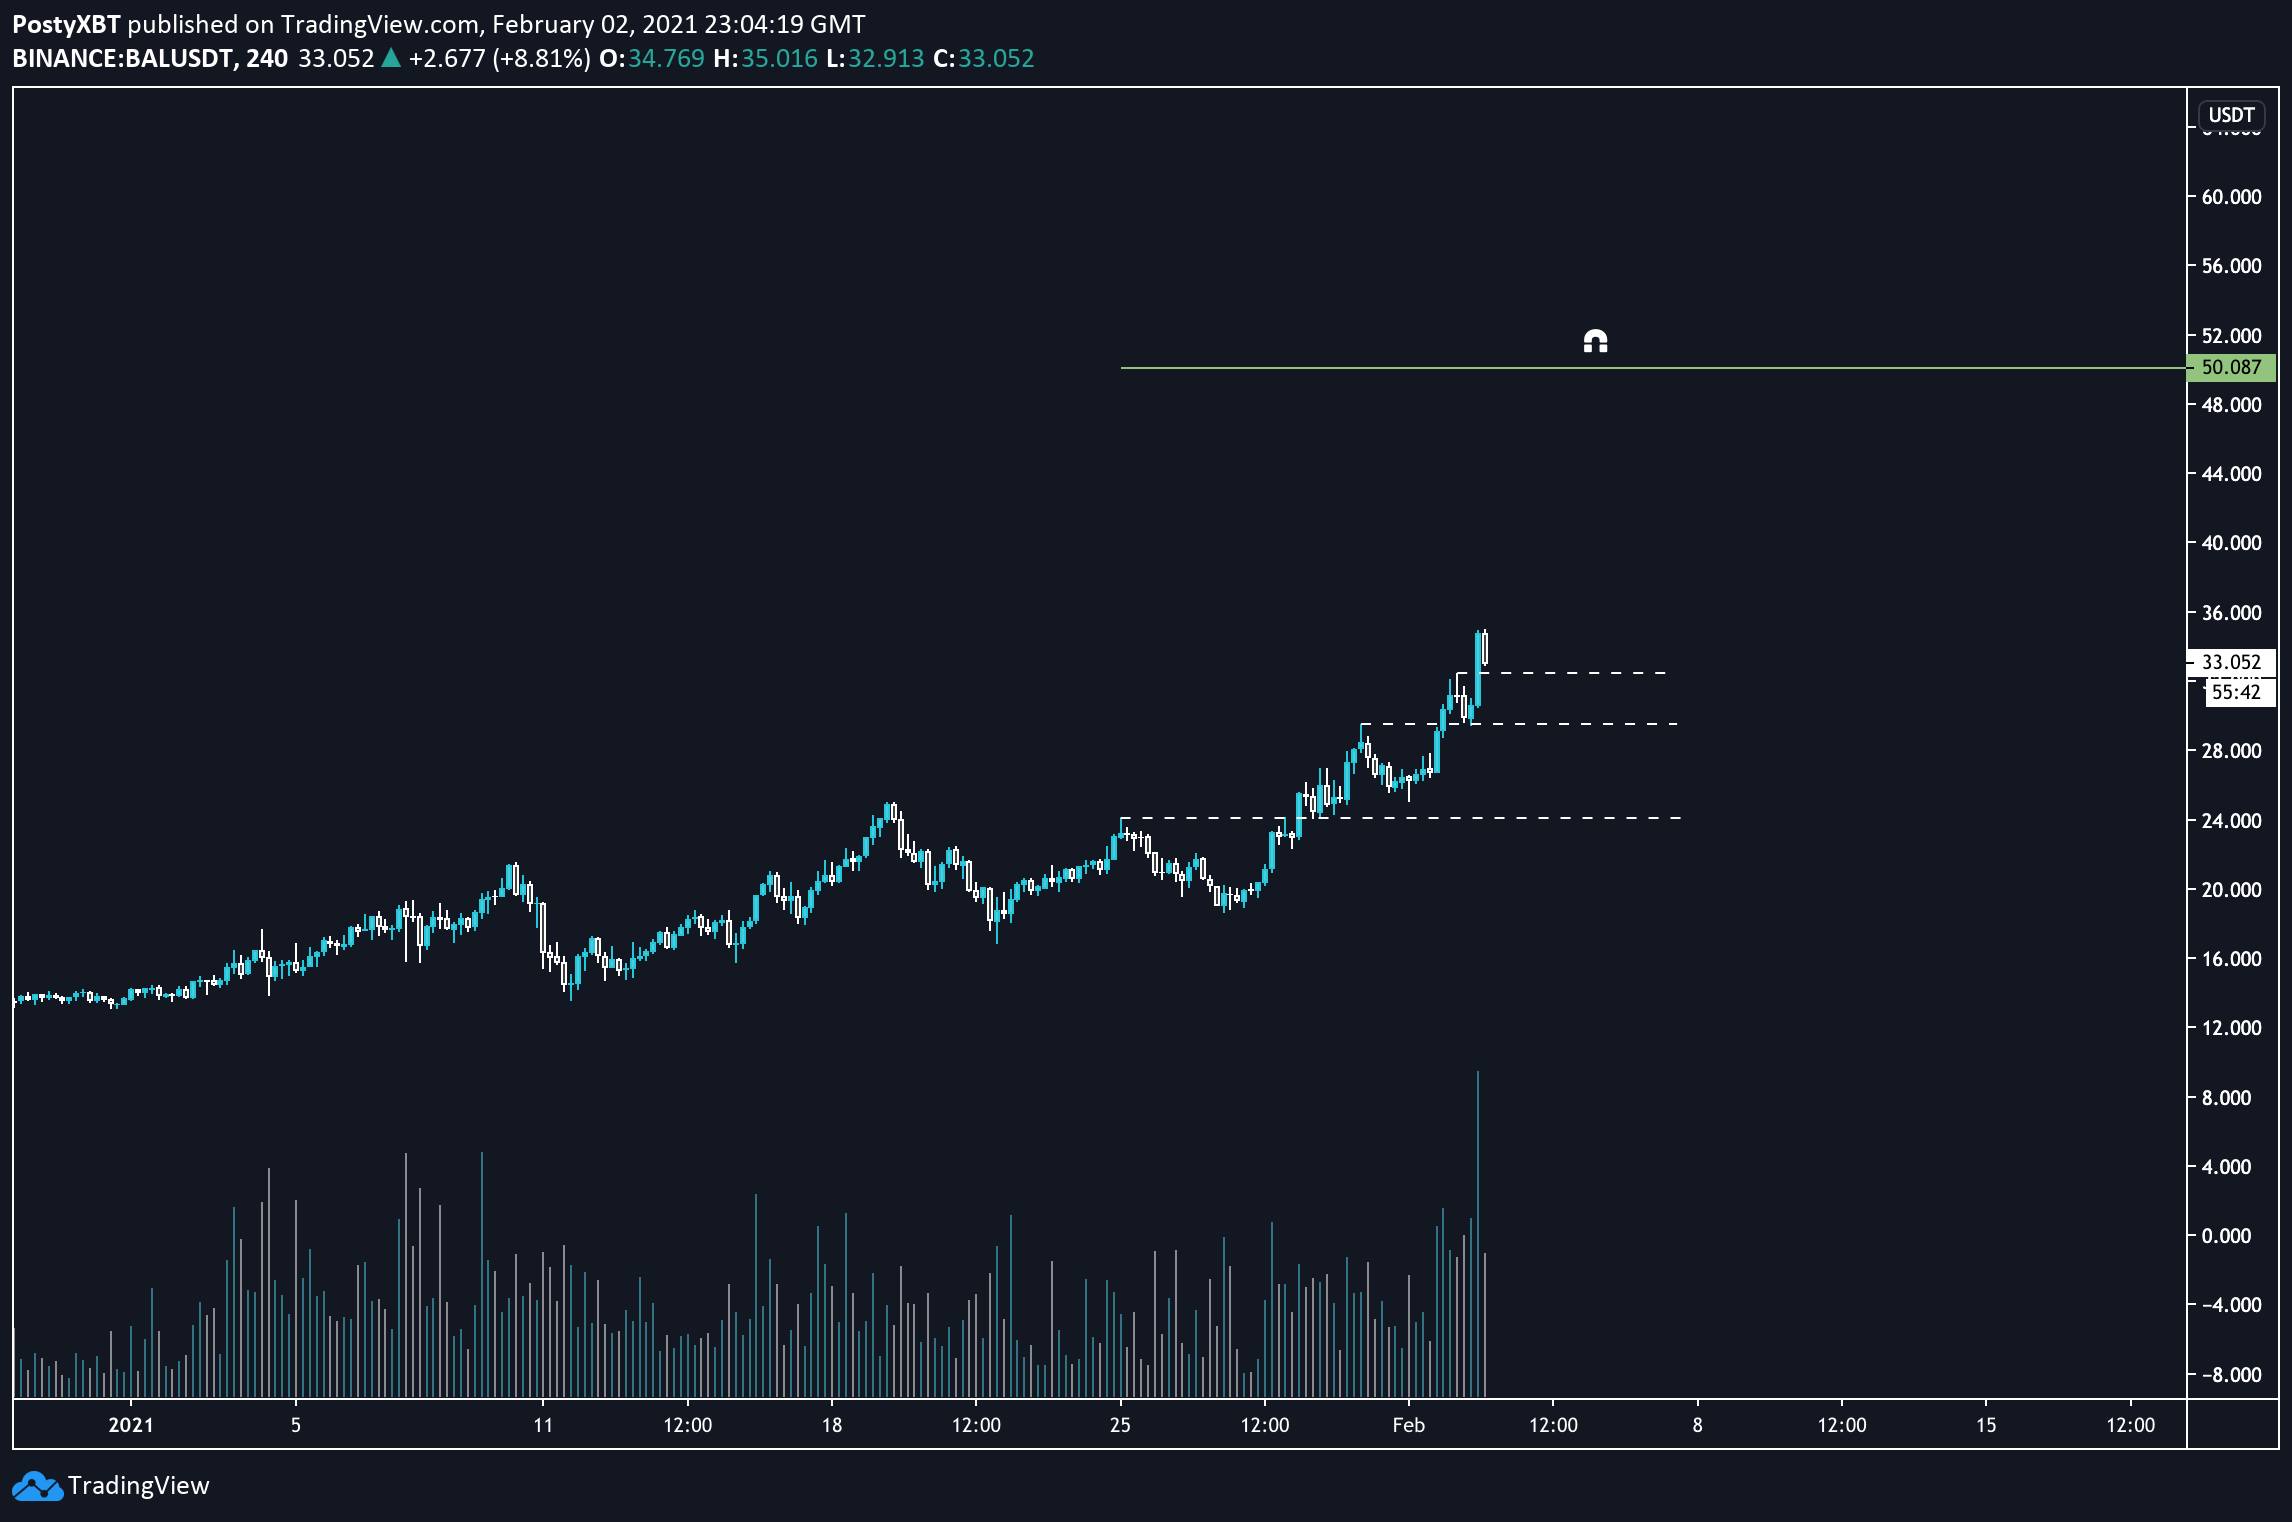
The wave count also aligns with this possibility since it suggests that BAL is in a long-term wave three (white) that began with the previous Nov. 4 low.
The sub-wave count is given in black, showing that it is in either sub-wave three or four. The most likely target for the top of the move is between $53-$54, found using a fib extension on wave one and sub-wave one.
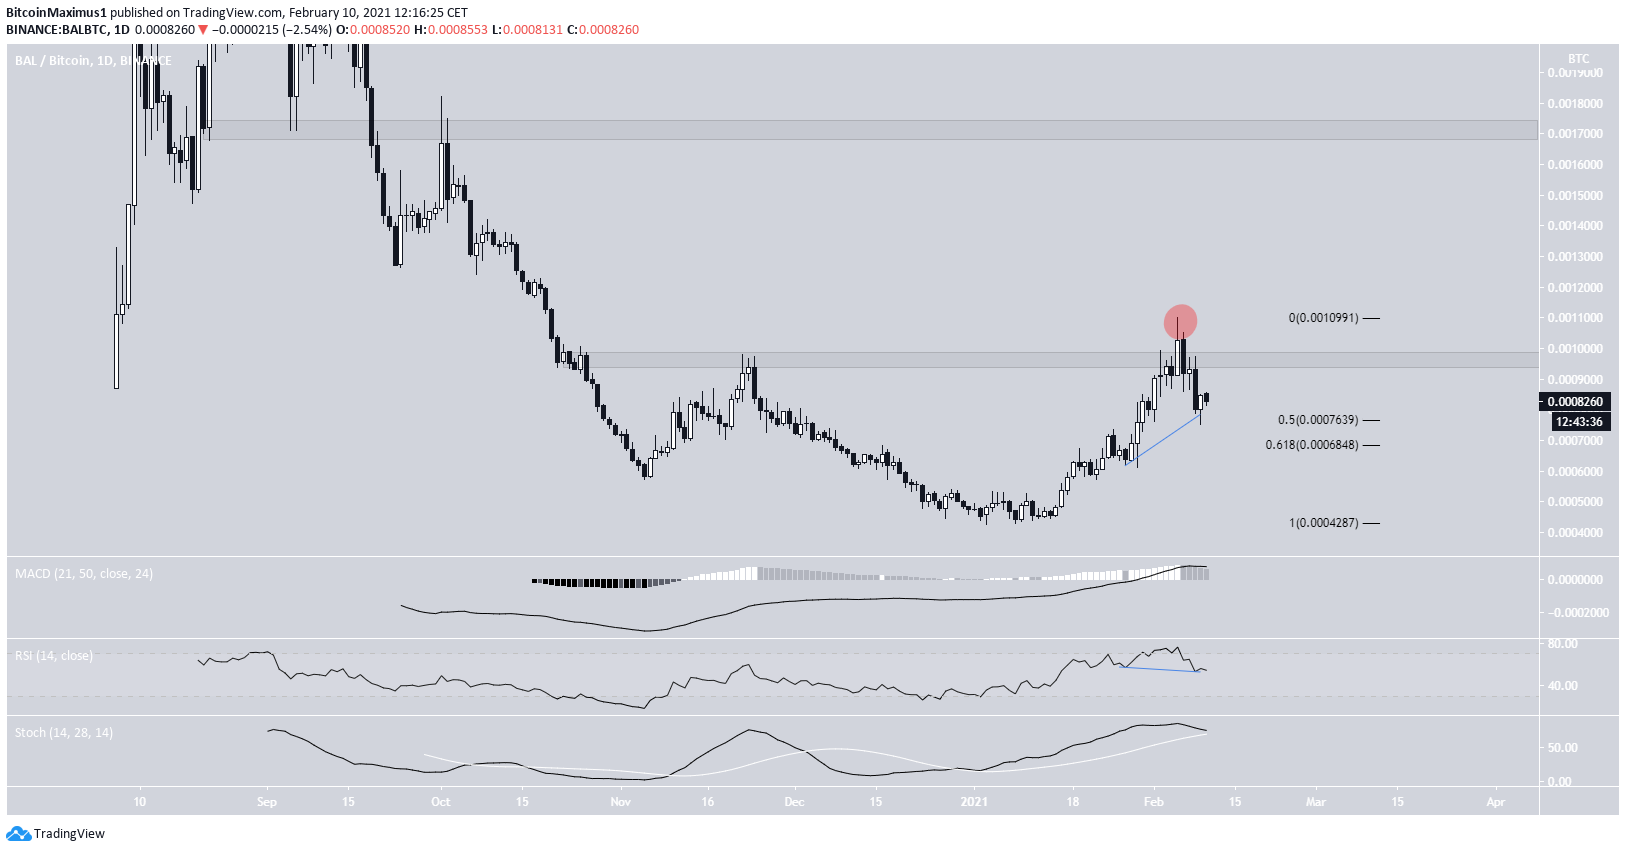
BAL/BTC
The BAL/BTC chart shows that despite an ongoing upward movement since the beginning of the year, BAL failed to break out above the 95,000 satoshi resistance area. Instead, it deviated above it (red circle) and fell right back below.
While technical indicators are neutral/bearish, there is a significant hidden bullish divergence developing in the RSI. If it manages to create a higher low near the current support level (0.5-0.618 Fib), it should move upwards gradually and eventually break out.
If so, the next closest resistance area would be at 17,500 satoshis.
Conclusion
To conclude, both the BAL/USD and BAL/BTC pairs are likely to move upwards, the former towards $53 with the latter towards 9,500 and possibly 17,500 satoshis.
For BeInCrypto’s latest Bitcoin (BTC) analysis, click here.


