
Axie Infinity (AXS) has been moving upwards since June 18 but has yet to break out from a descending resistance line.
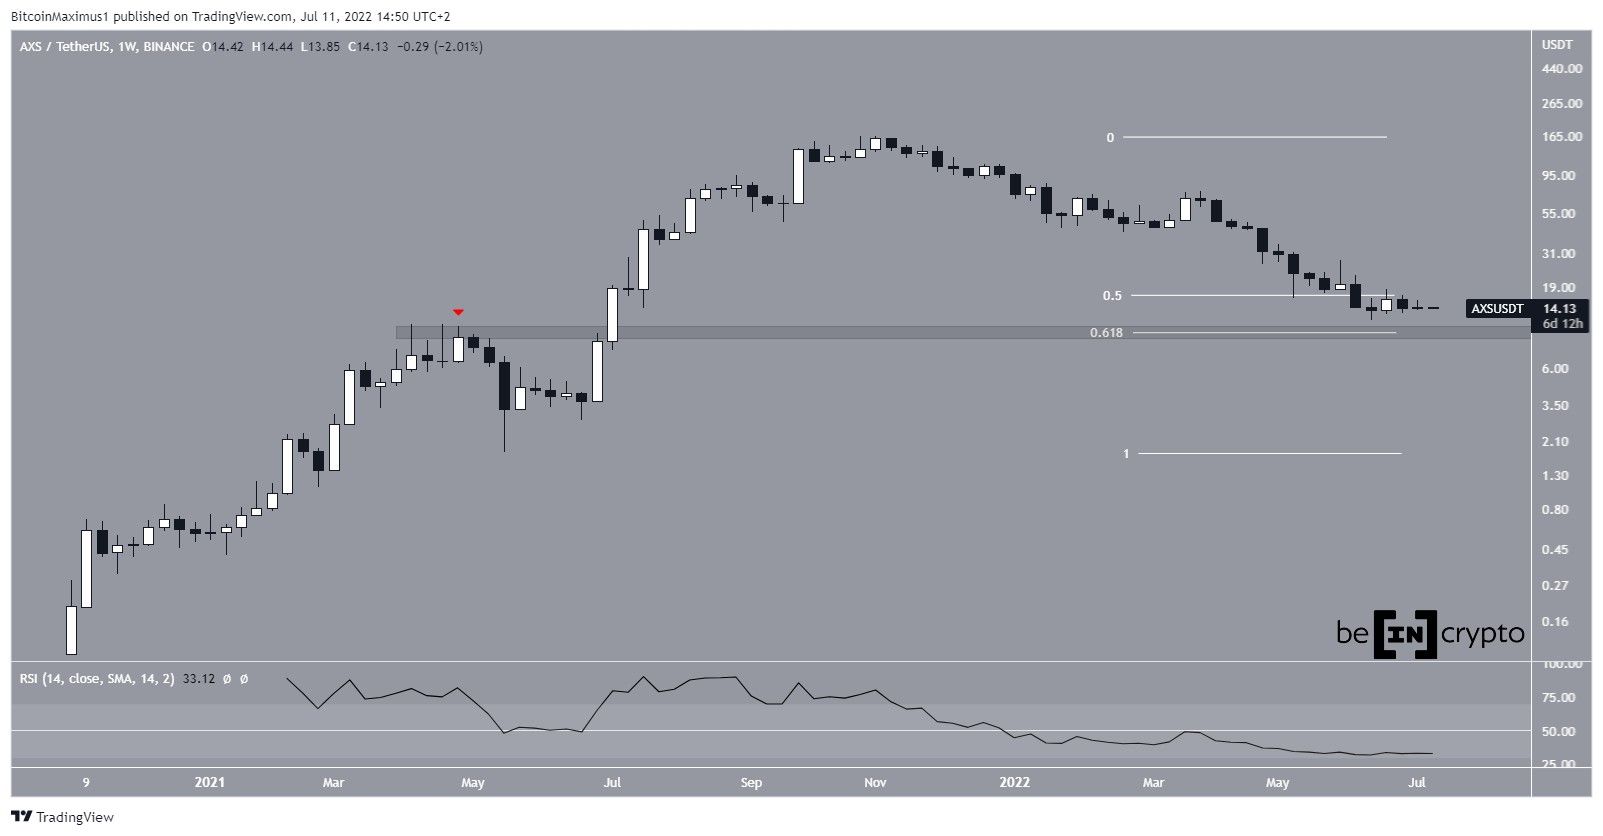
AXS has been falling since reaching an all-time high price of $166.09 in Nov. So far, the downward movement has led to a low of $11.85 in June 2022. This amounted to a decrease of 92% since the all-time high.
So far, the price has fallen below the 0.5 Fib retracement support level and validated it as resistance afterwards. However, it is trading very close to the 0.618 Fib retracement support level at $10.
This is a crucial horizontal level, since it previously provided resistance in May 2021 (red icon). So, due to the confluence of both a horizontal and Fib support level, the area could initiate a bounce.
Despite this proximity to support, technical indicators are not yet bullish. While the weekly RSI reached an all-time low of 30, it has not generated any bullish divergence nor has it reached its oversold territory yet.
Daily RSI generates bullish divergence
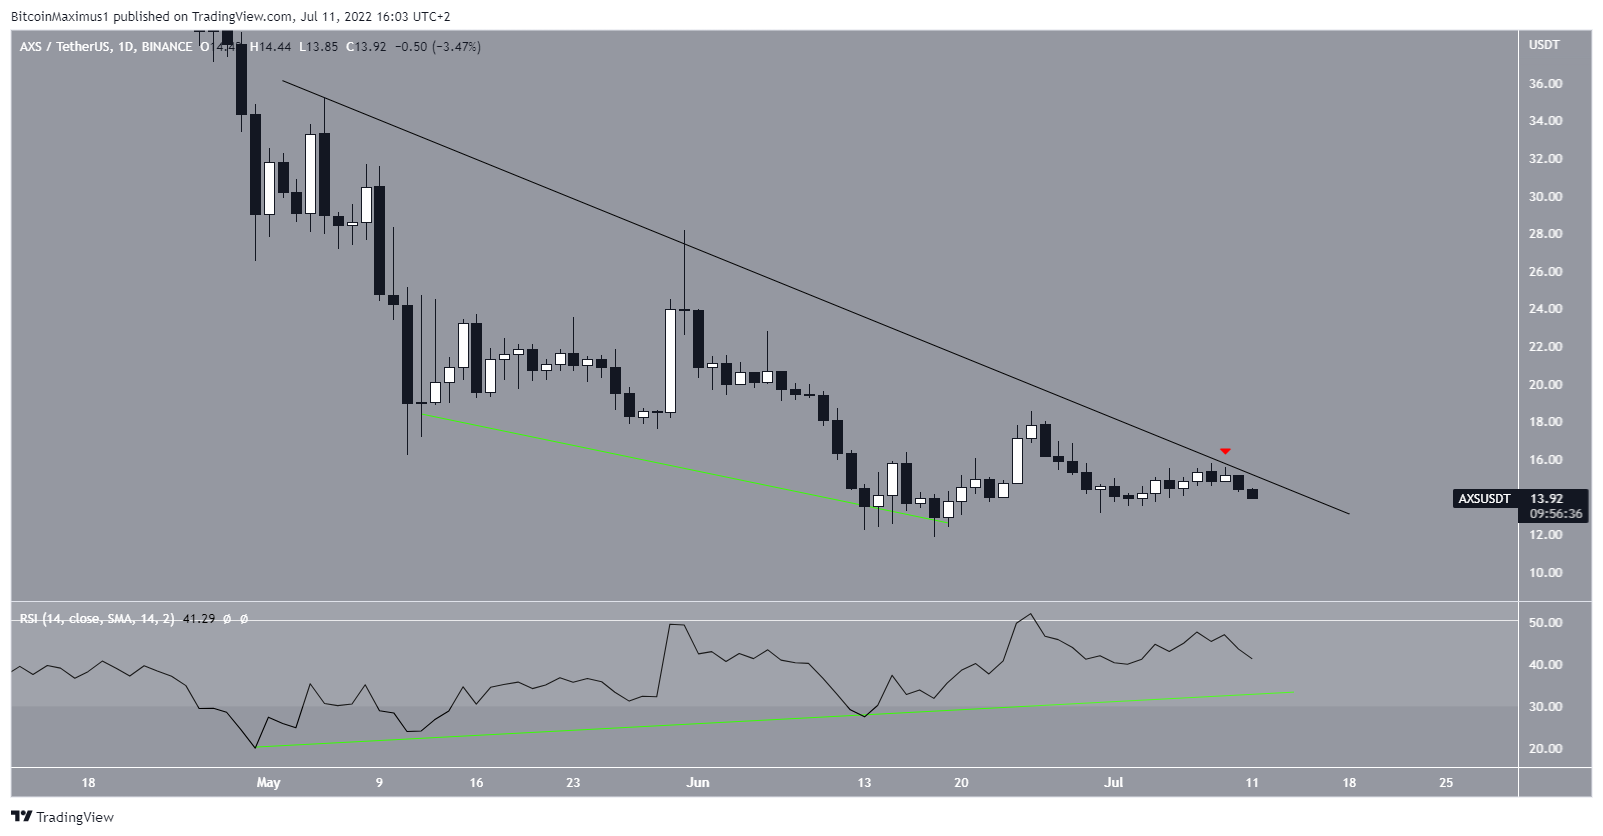
The daily chart shows that the price has been following a descending resistance line since May 5. Most recently, the line caused a rejection on July 9 (red icon), creating two successive daily bearish candlesticks.
A bullish development is that the daily RSI generated bullish divergence between May 14 and June 16. But, this was not the catalyst for a significant upward movement and failed to cause a breakout from the descending resistance line.
If the divergence trendline (green line) fails to hold, new lows would be expected.
Future AXS movement
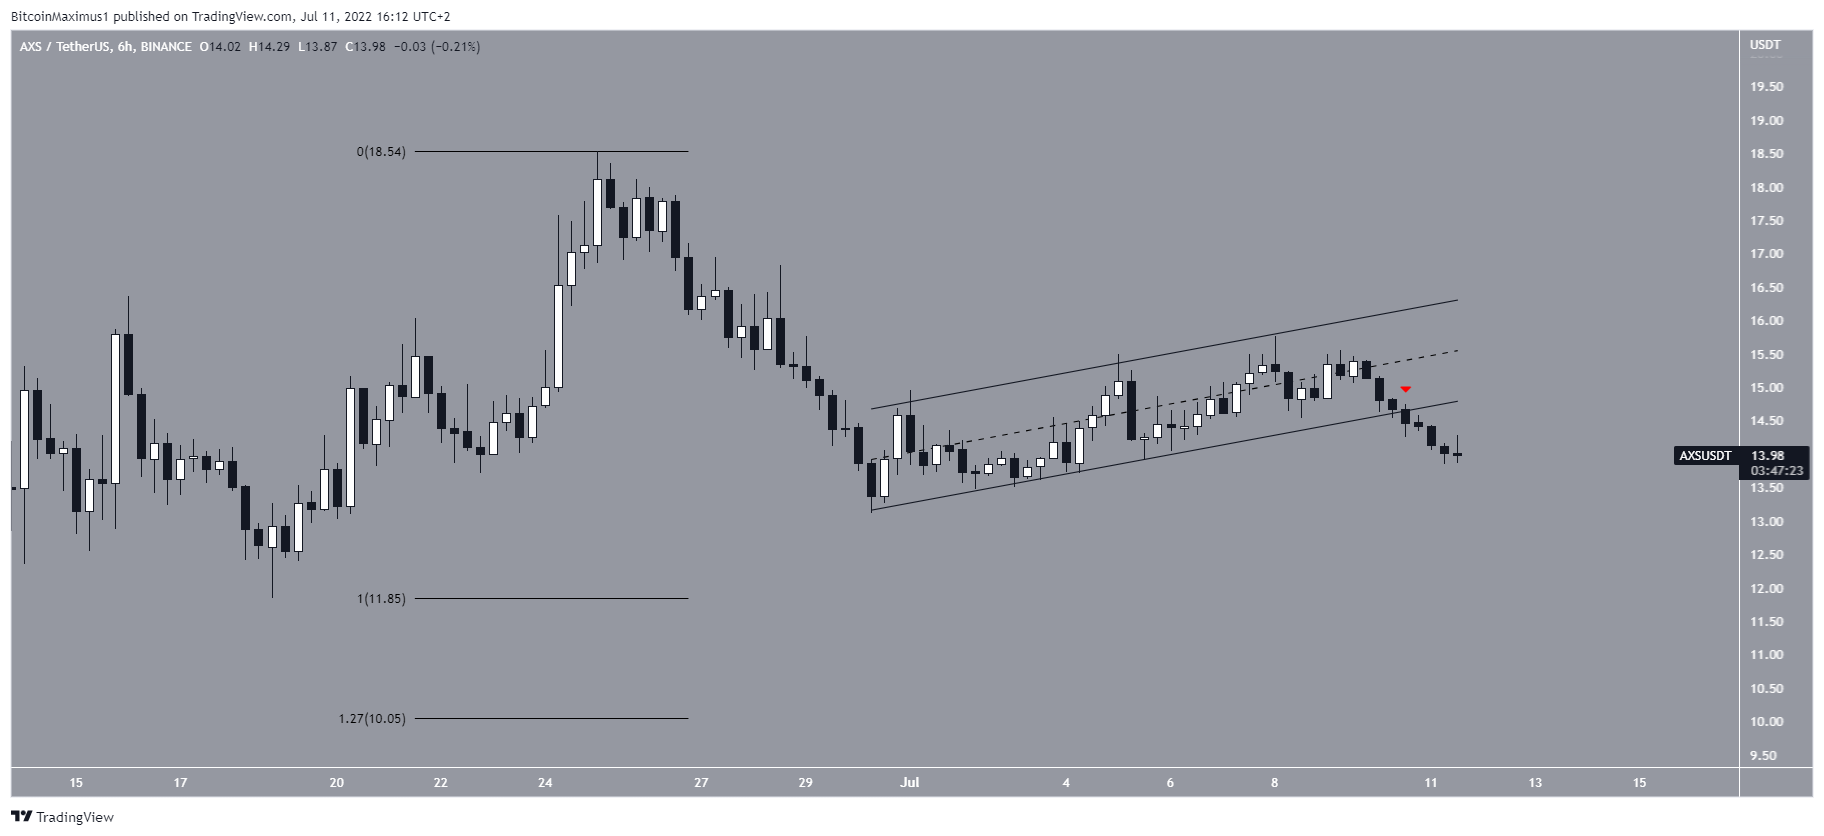
The six-hour chart shows that the price has broken down from an ascending parallel channel. Such channels usually contain corrective movements, meaning that a breakdown from it would be likely. Additionally, this suggests that the prevalent trend is downwards, since the upward bounces are considered corrective.
Using the external 1.27 Fib retracement on the most recent bounce gives a target of $10 for the ensuing bottom. This also coincides with the previously outlined long-term support area.
For Be[in]Crypto’s latest bitcoin (BTC) analysis, click here.
