


The daily RSI for Axie Infinity (AXS) has generated bullish divergence, supporting the continuation of the ongoing bounce.
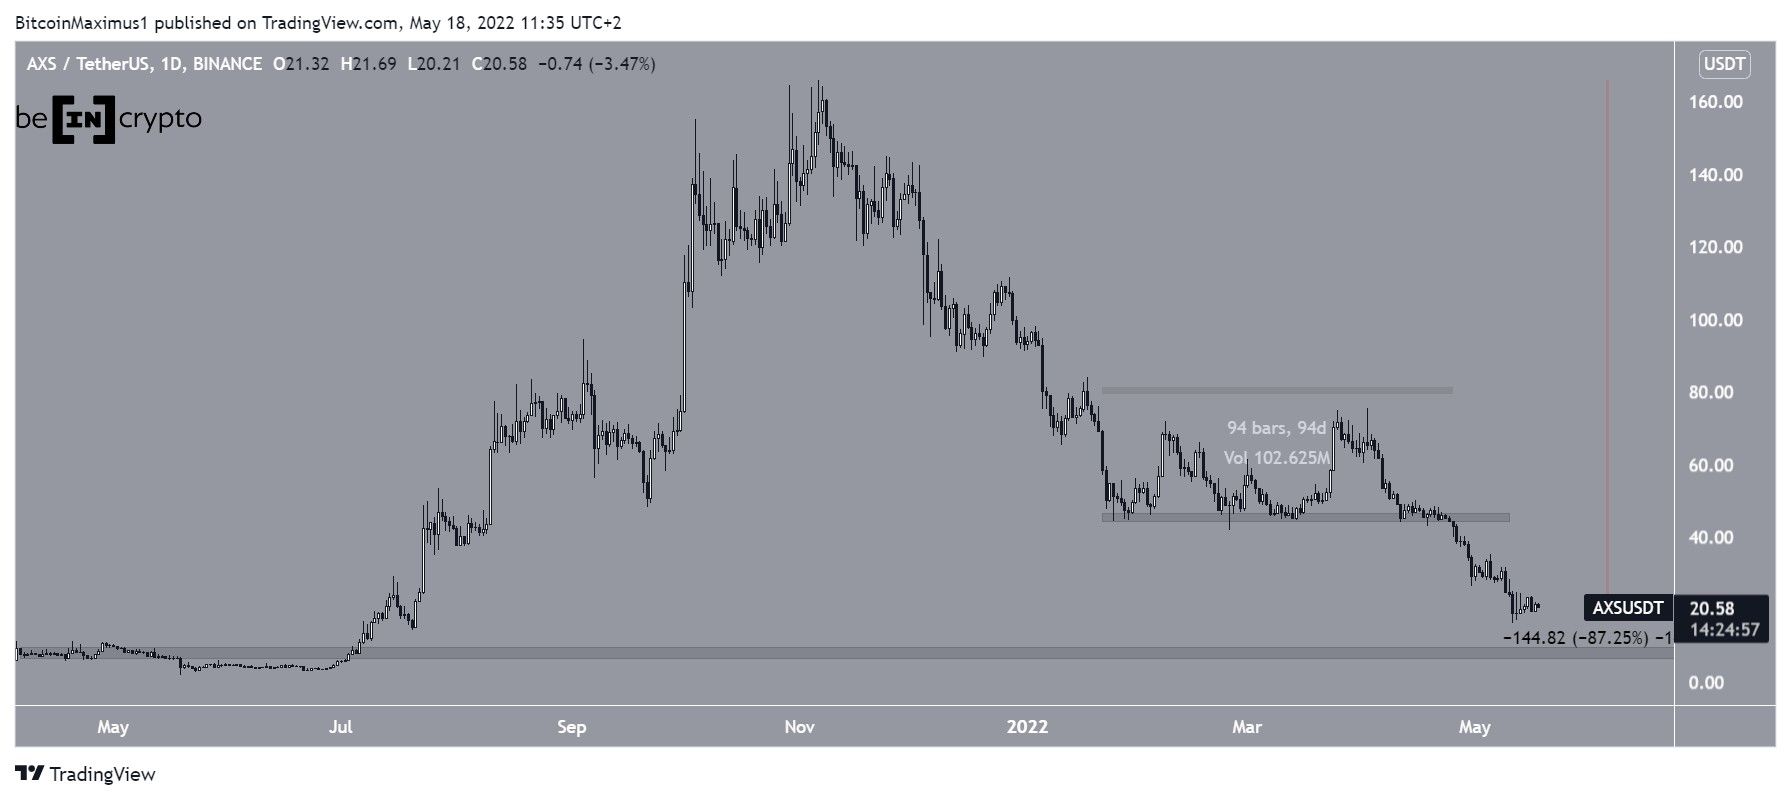
AXS has been falling since reaching an all-time high price of $166.09 on Nov 6.
At the beginning of Jan, the price bounced above the $46 horizontal support area. However, the upward movement could not be sustained and a breakdown transpired on April 25. Prior to the breakdown, the support area had been in place for 94 days. Now, the $46 area is expected to provide resistance.
The ongoing downward movement has so far led to a low of $16.20 on May 11. Measuring from the all-time high, AXS has fallen by 87%.
If the decrease continues, the next closest support would be at the April to May 2021 lows at $8.
Cryptocurrency trader @PostyXBT tweeted a chart of AXS, stating that even though there is no bullish market structure in sight, a bounce could transpire.
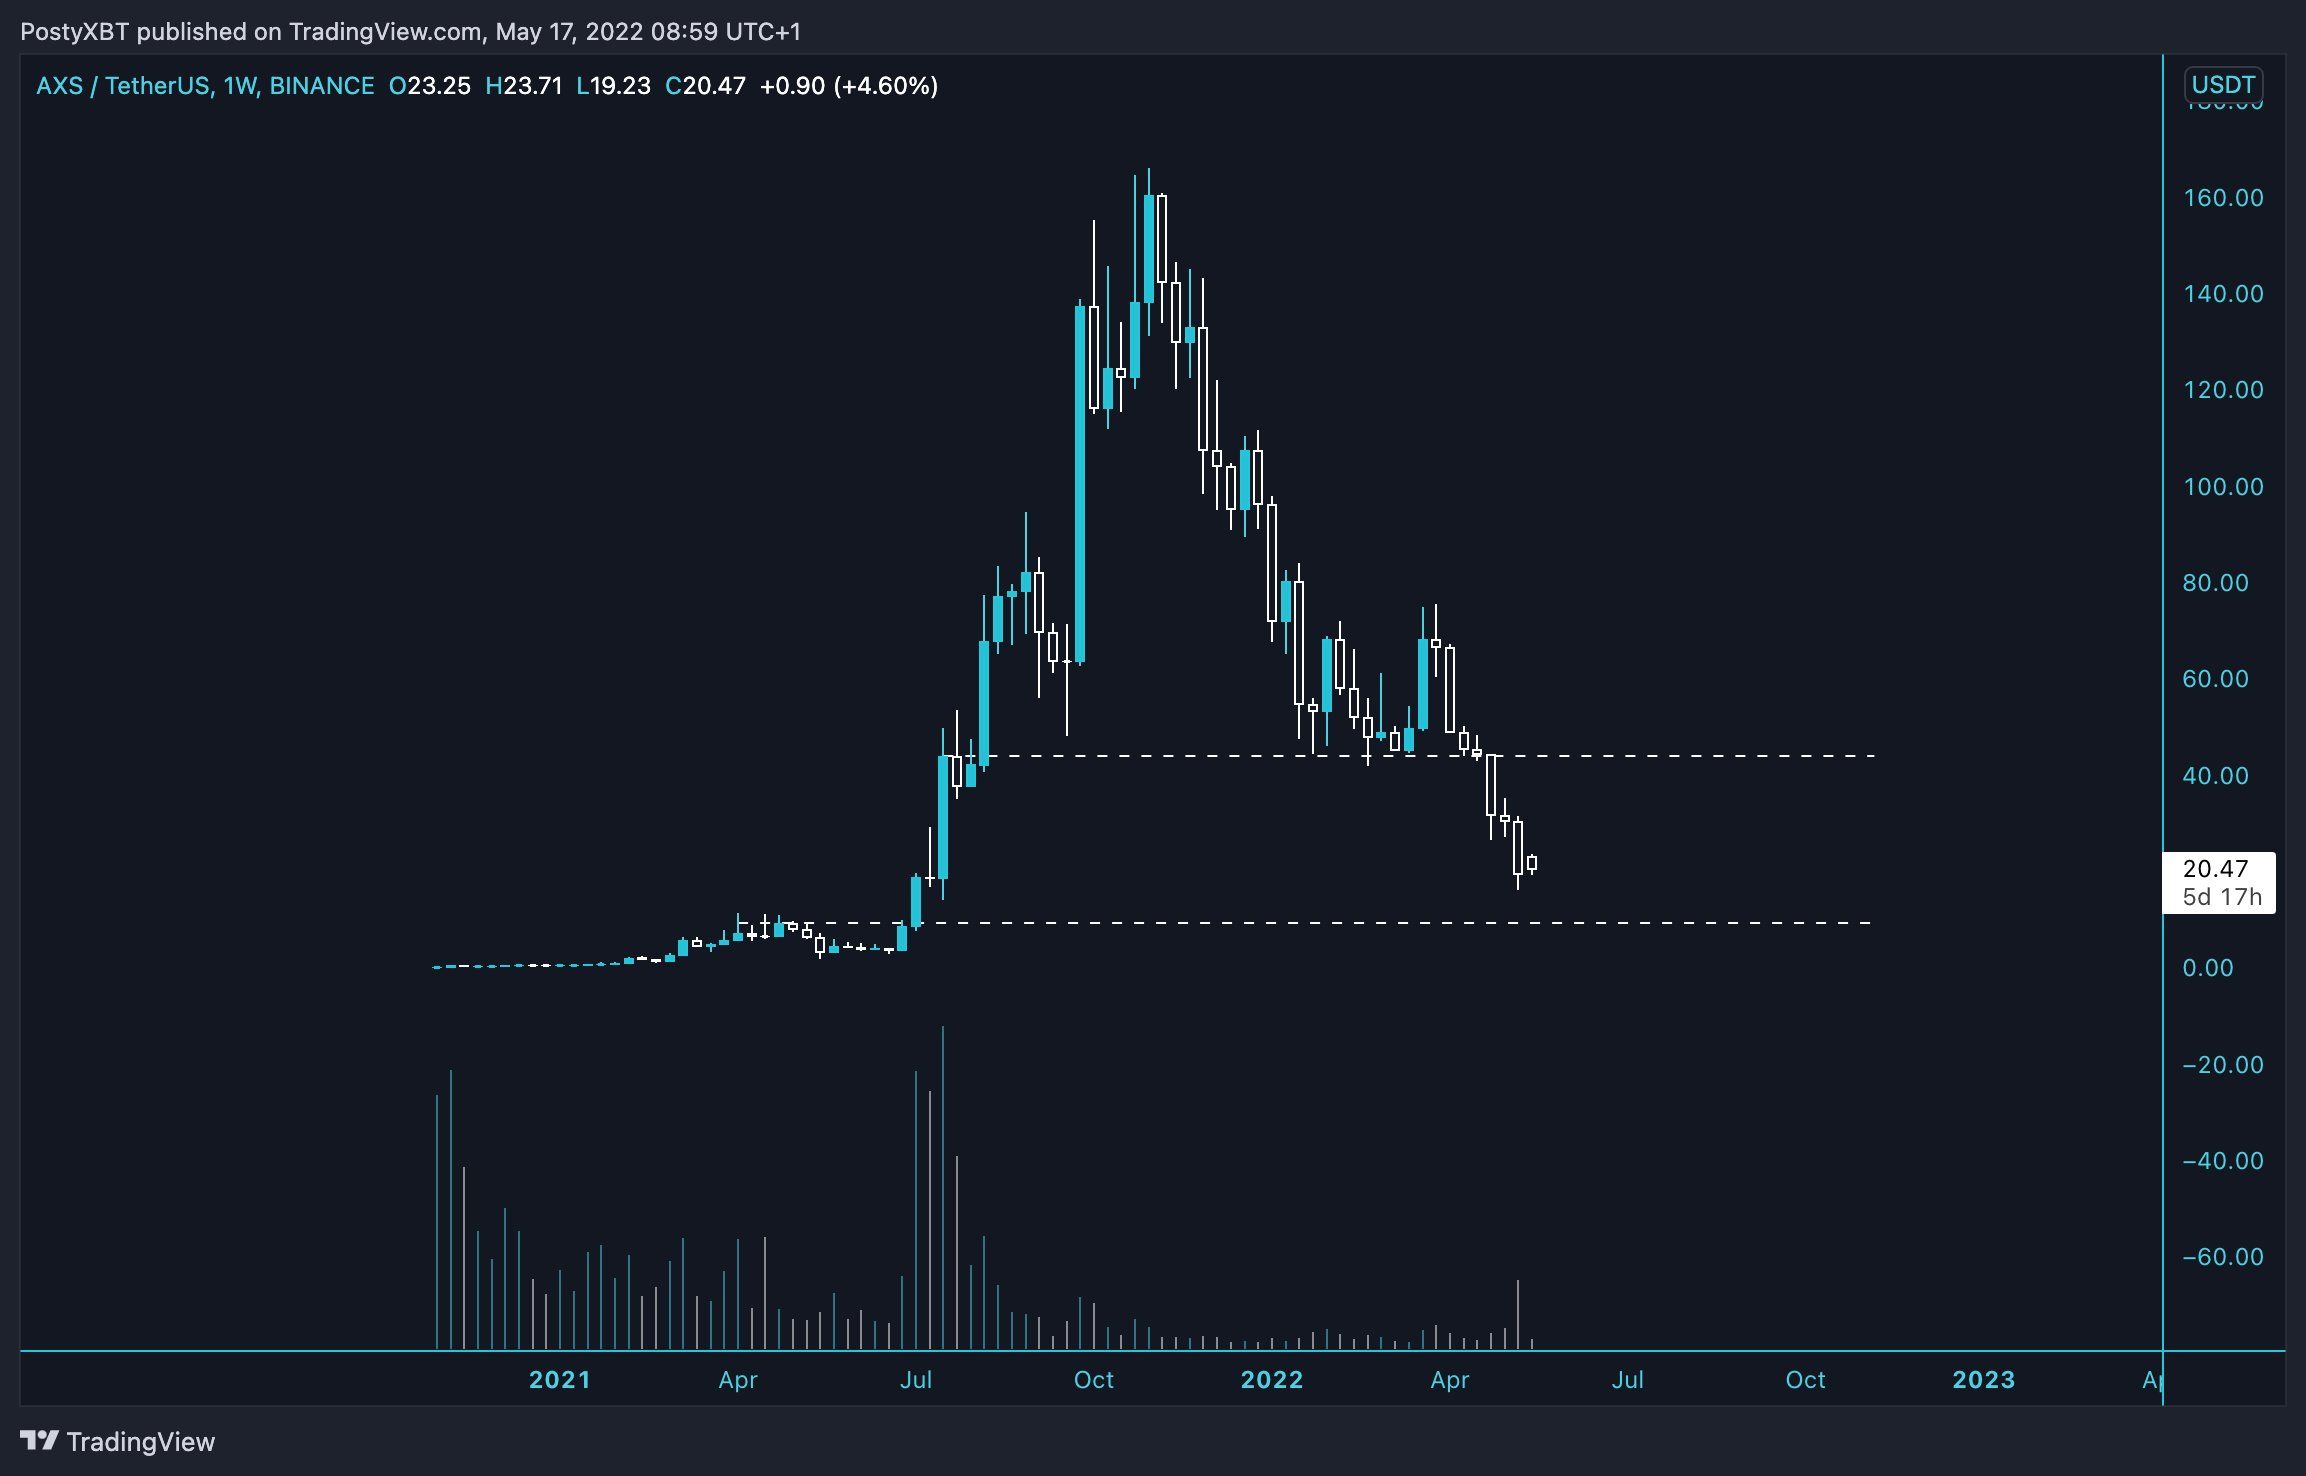
A look at lower time frames is required in order to determine if this bounce will occur.
Bullish RSI
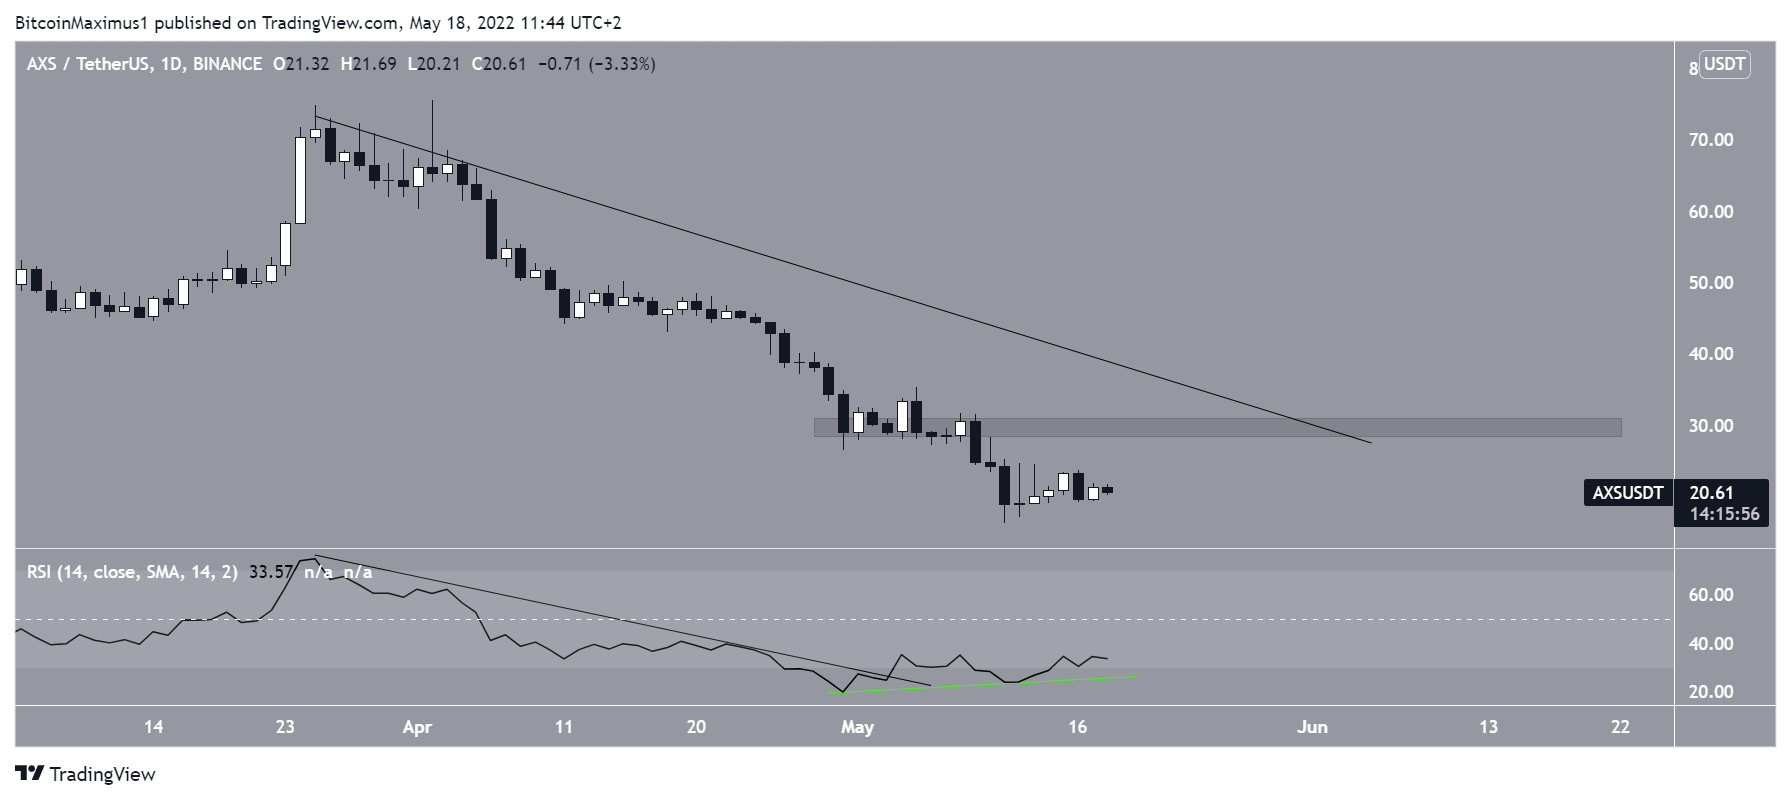
Despite the ongoing decrease, the daily RSI is bullish.
Firstly, it has broken out from a descending trendline that had previously been in place since March 23. Secondly, it has generated bullish divergence (green line) inside oversold territory.
If an upward movement follows, as a result, AXS could increase towards the $30 resistance area. This is a horizontal level that previously provided support and also coincides with a descending resistance line.
Short-term AXS movement
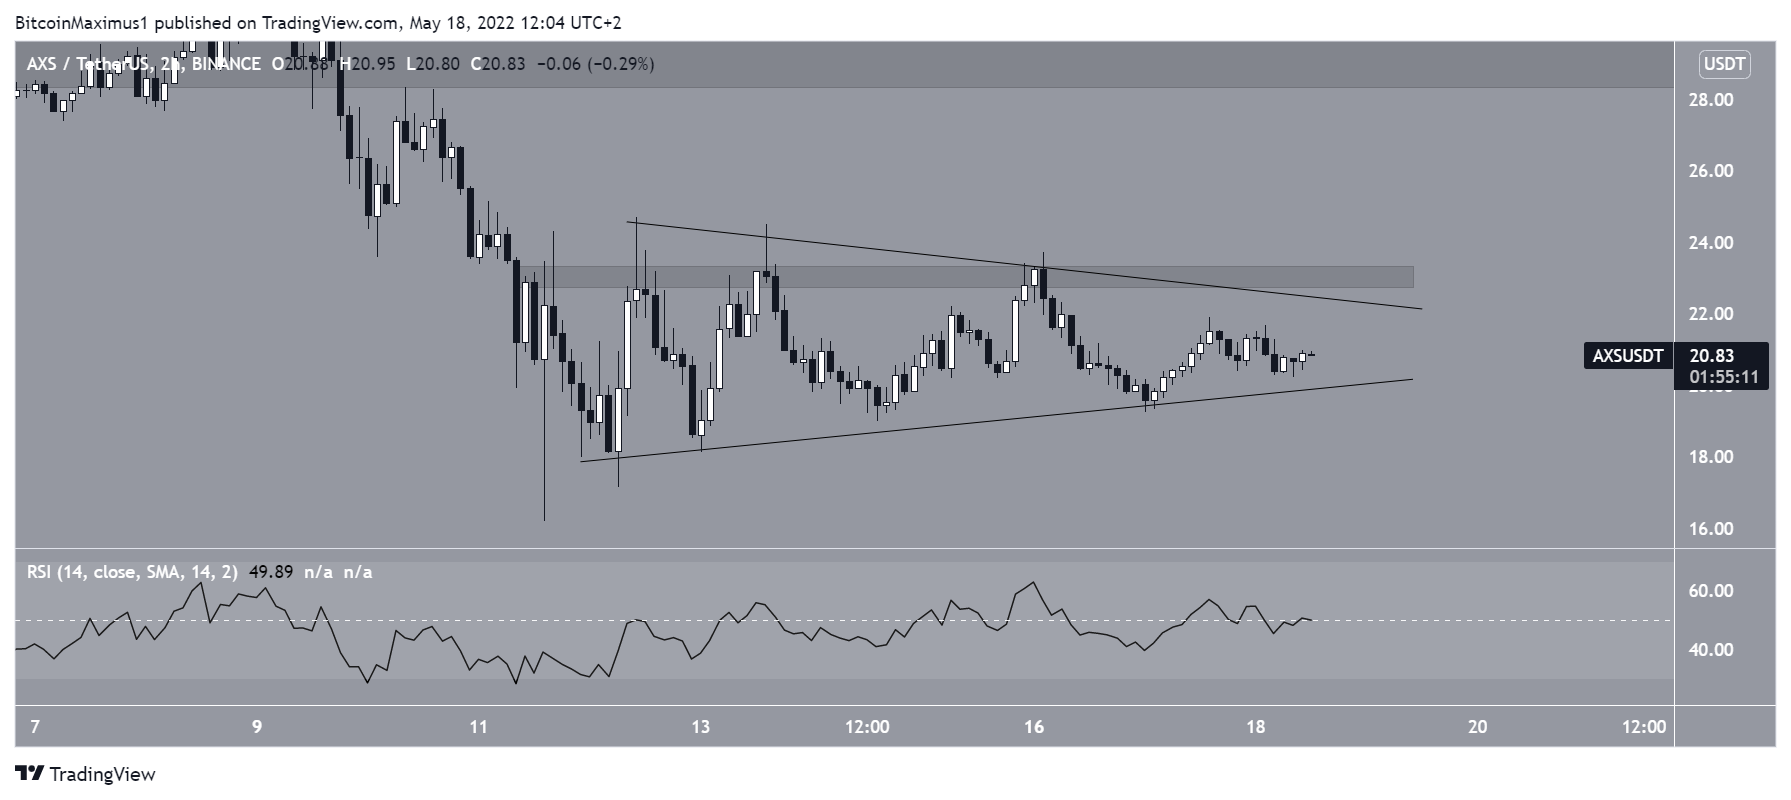
The two-hour chart shows that AXS has been trading inside either a symmetrical or an ascending triangle since May 11. While the former is considered a neutral pattern, the latter is considered a bullish one.
The two-hour RSI fails to help in determining the direction of the trend since it gives a neutral reading of 50.
A breakout above the descending resistance line/resistance area would be expected to take the price towards $30.
Conversely, a breakdown from the support line would be expected to be the catalyst for the resumption of the downward movement.
For Be[in]Crypto’s latest Bitcoin (BTC) analysis, click here


