


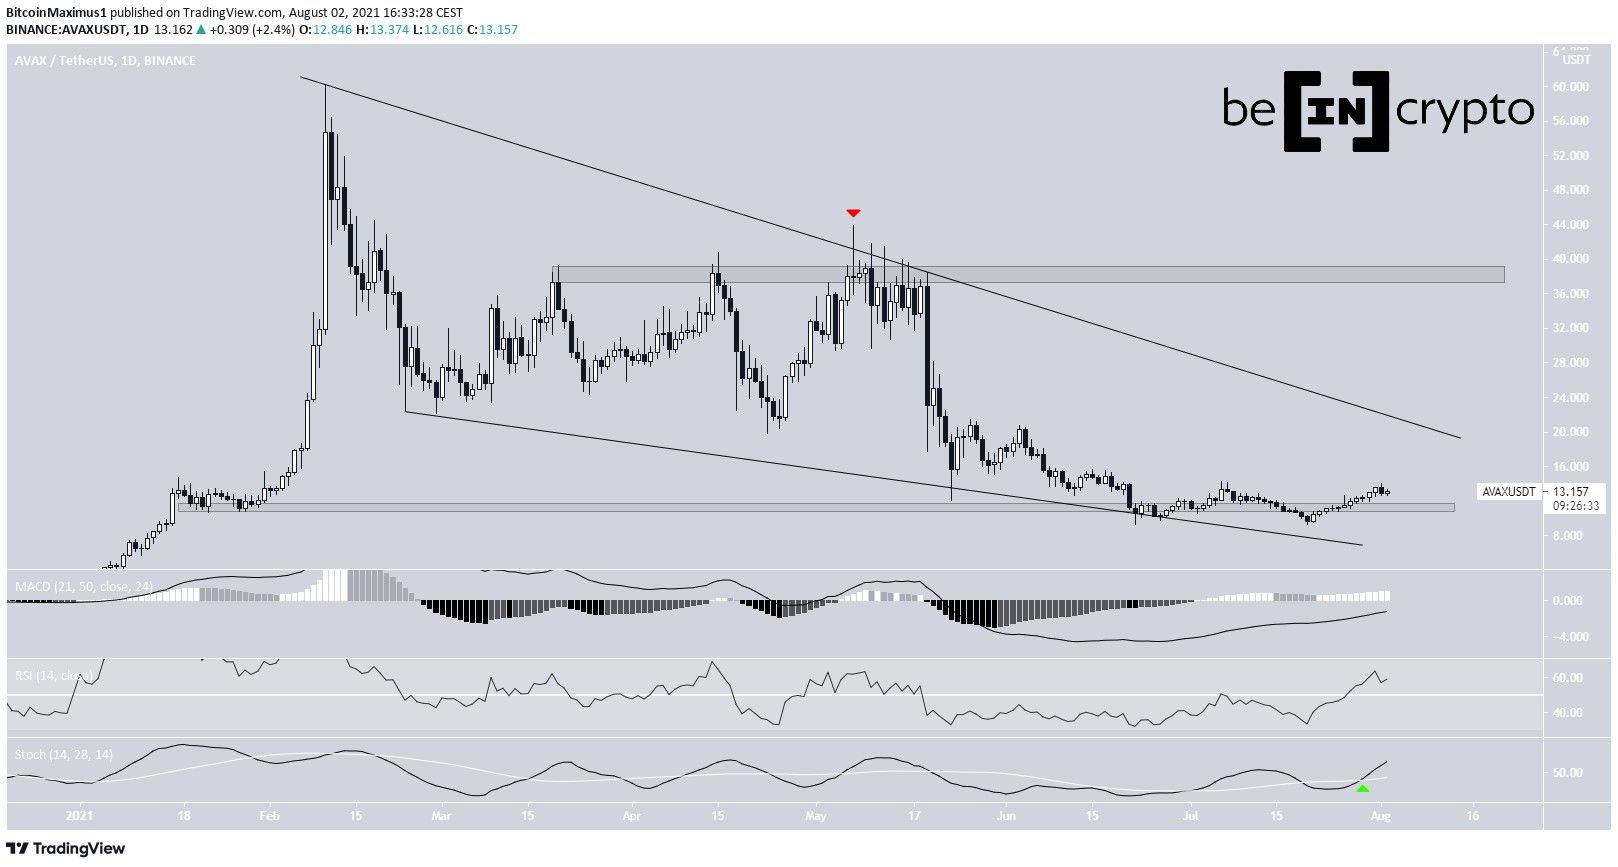
Avalanche (AVAX) is trading inside a long-term descending wedge and has reclaimed the $11.50 horizontal support area.
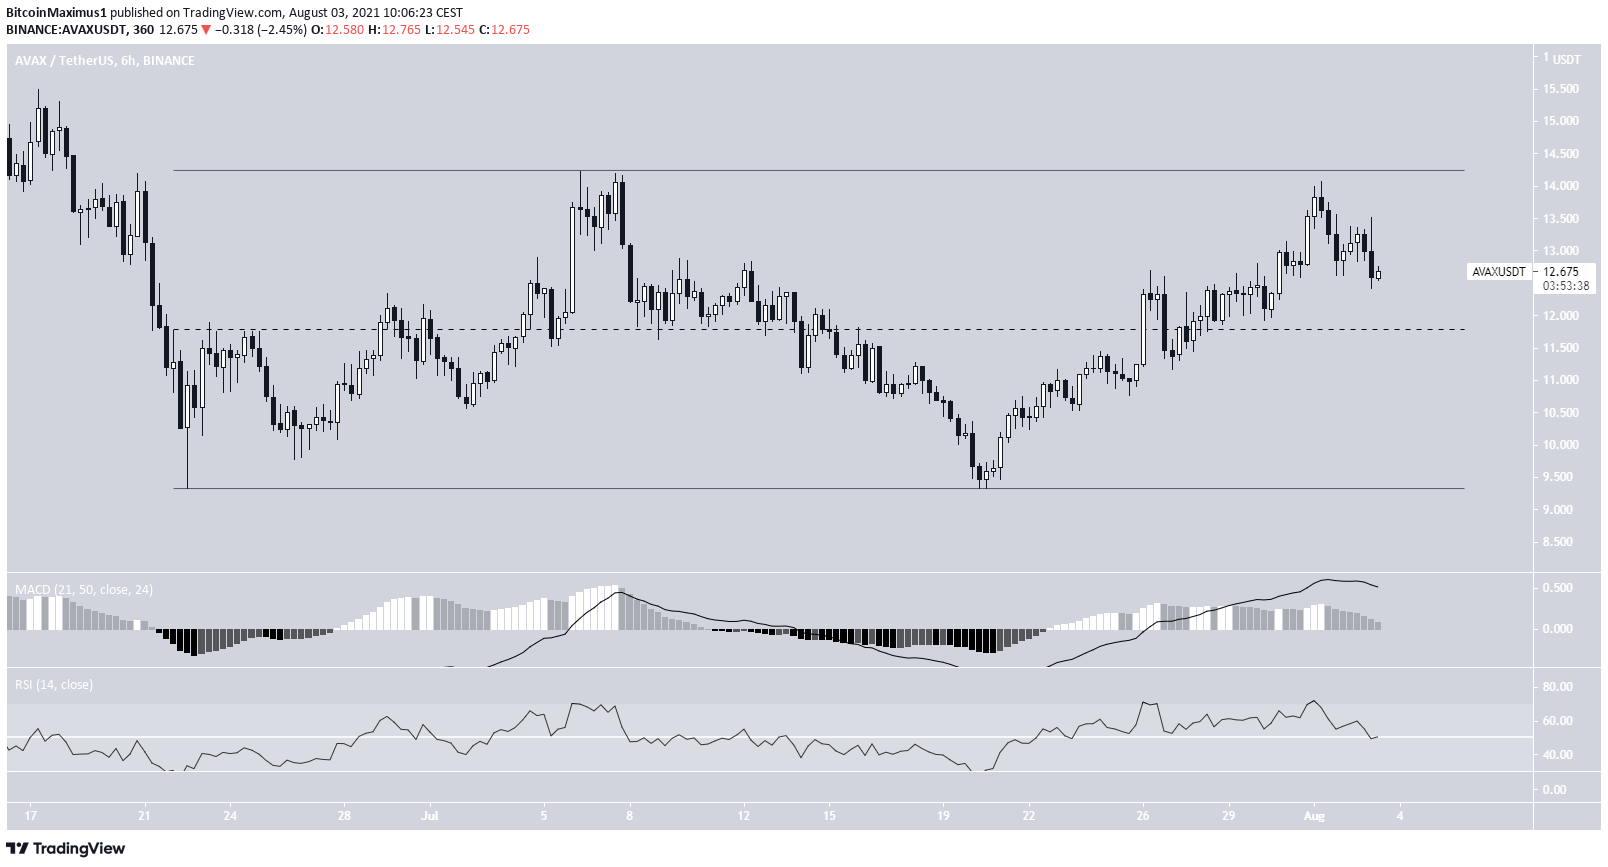
However, it’s also trading inside a short-term ascending parallel channel. Whether it breaks out from the resistance of the channel or gets rejected will likely determine the direction of the next move.
Avalanche long-term wedge
AVAX has been moving downwards since Feb 10 after reaching a high of $60.30. The decrease was initially gradual, accelerating after a lower high was created on May 7 (red icon).
On June 22, it reached a low of $9.32 and bounced at the support line of the wedge (green icon). Shortly after, AVAX reclaimed the $11.30 horizontal support area.
Technical indicators in the daily time-frame are bullish. The Stochastic oscillator has made a bullish cross and the RSI has moved above 50. In addition to this, the MACD is increasing and has nearly crossed into positive territory.
The resistance line of the wedge is found at $22. In the case of a breakout, its next target to the upside would found at $38.
Future movement
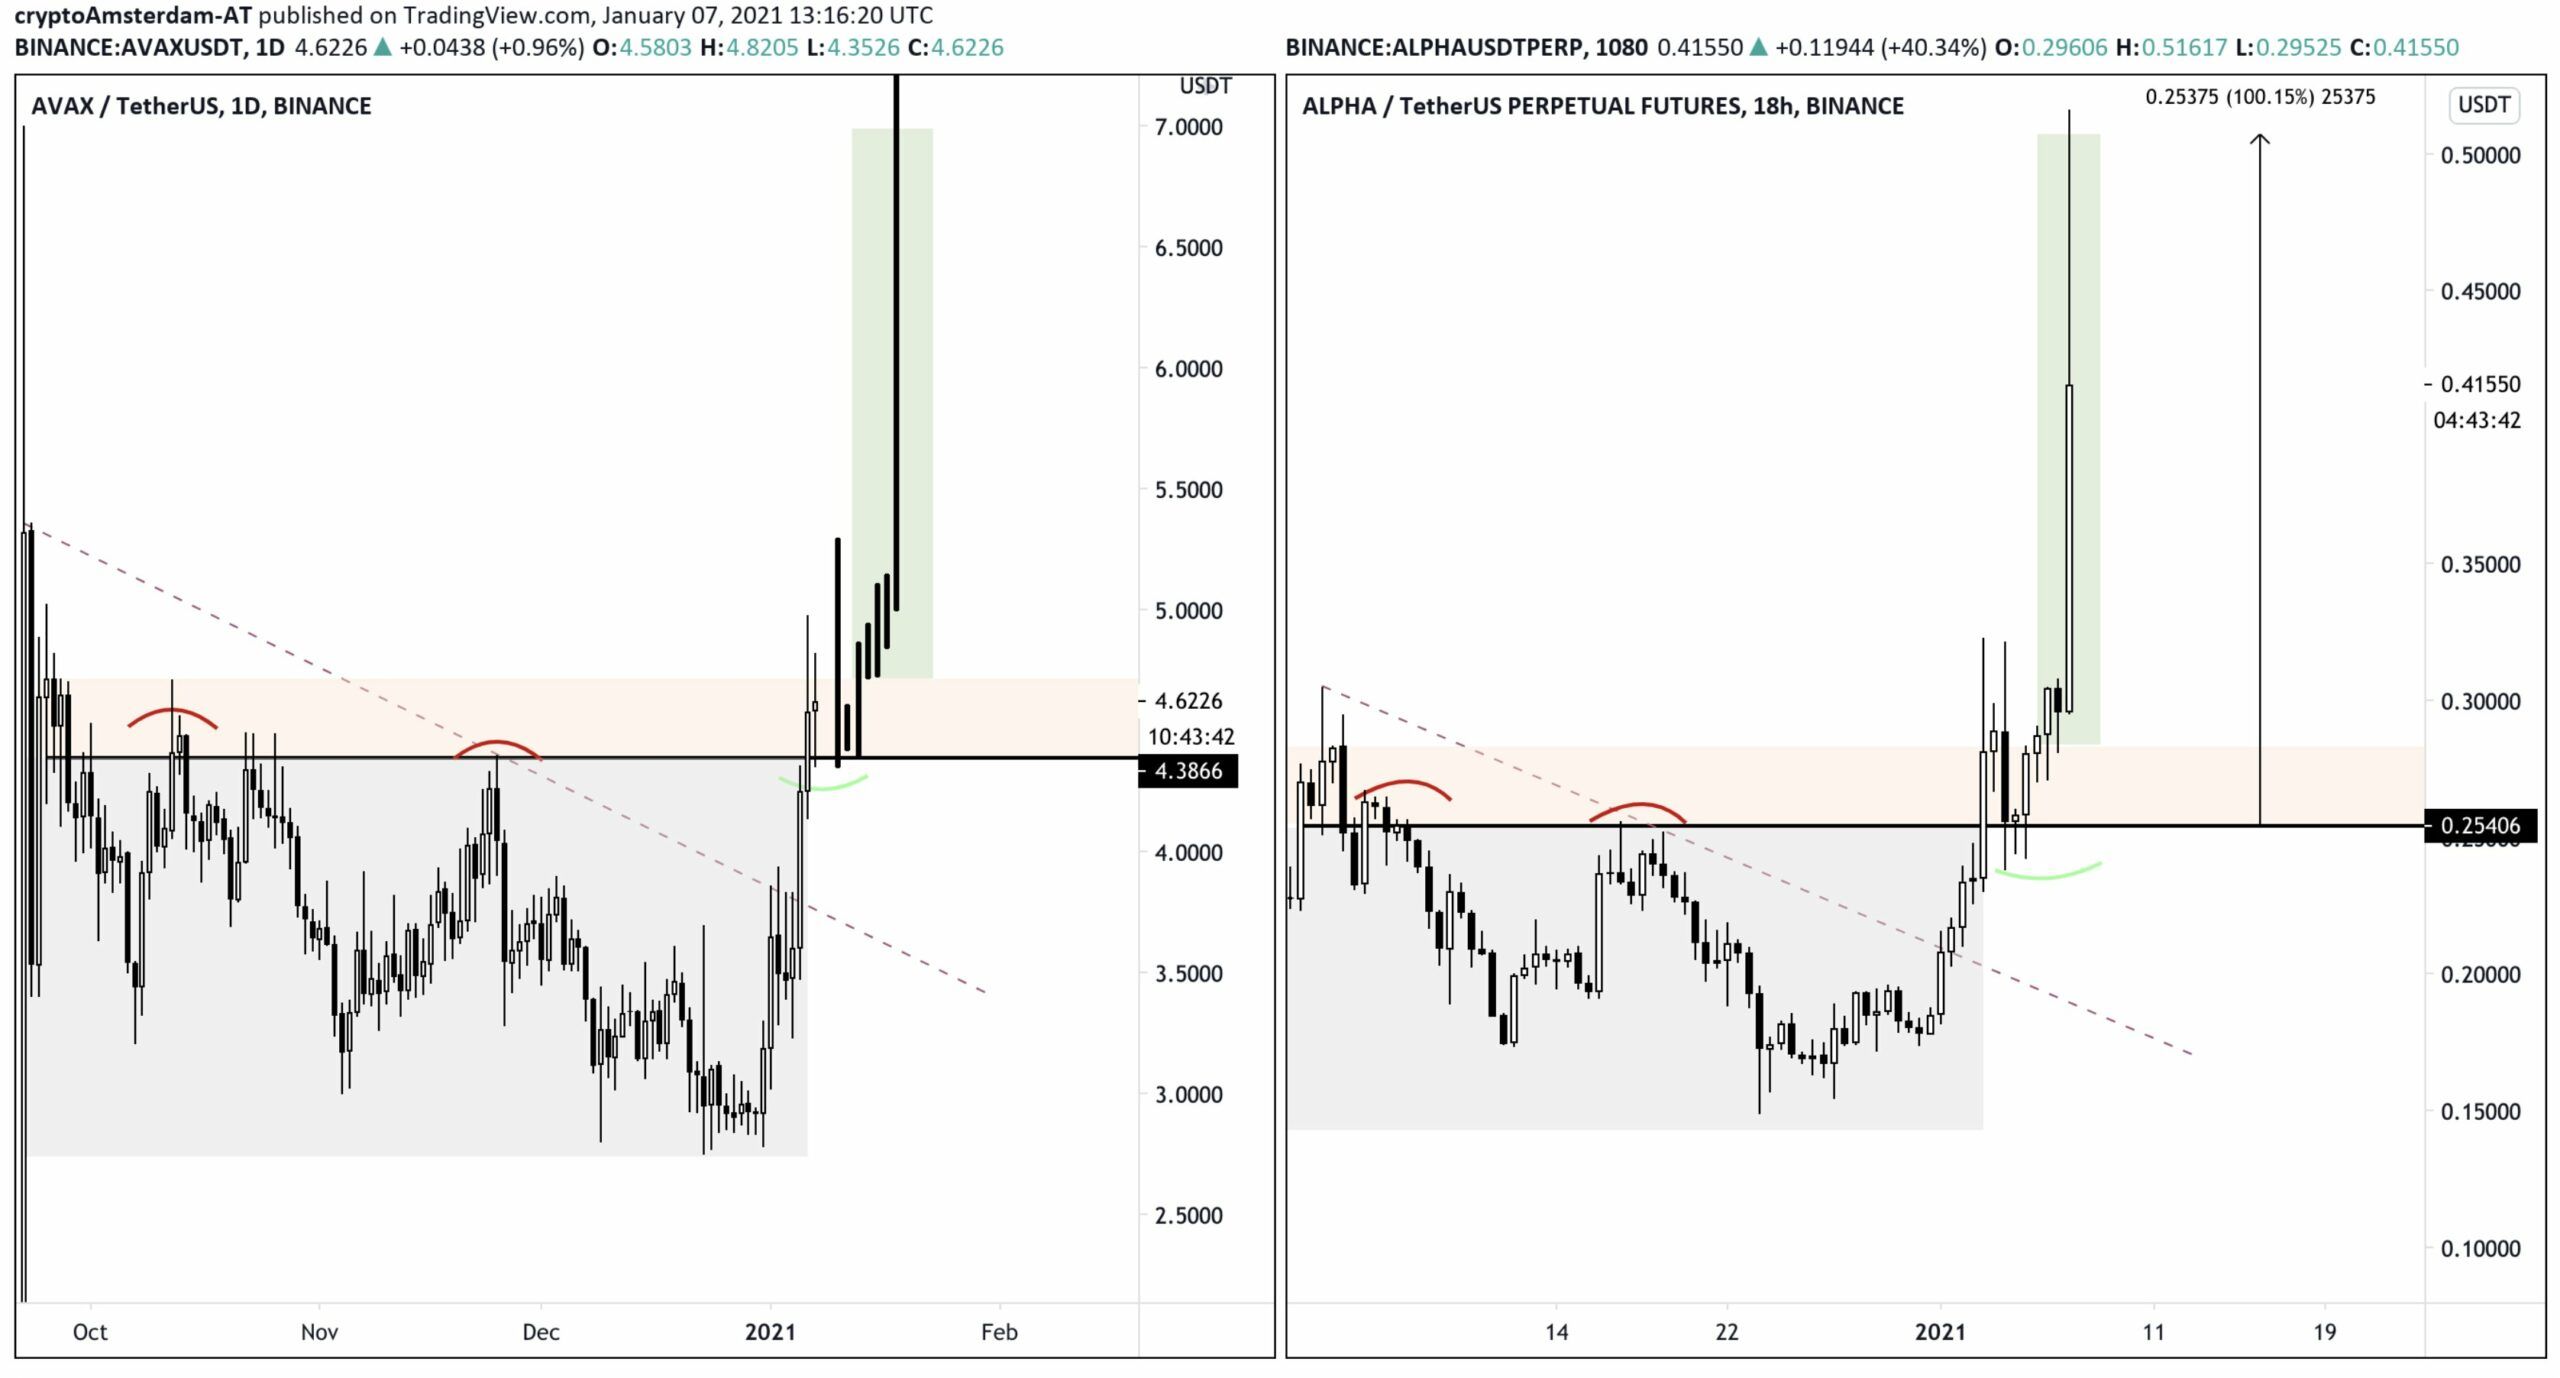
Cryptocurrency trader @Damskotrades outlined a similar formation in the ALPHA chart that shows an ongoing breakout. He stated that AVAX could soon make the same type of move.
However, AVAX is trading inside an ascending parallel channel. These patterns usually contains corrective movements.
While its currently in the upper portion of the channel, technical indicators are gradually turning bearish.
Whether AVAX breaks out or is rejected from the channel will likely determine the direction of the next move. A breakout from the channel would likely mean a move towards the resistance line of the long-term wedge and potential breakout.
Conversely, a move to the lower portion of the channel could mean that another touch of the support line is in store.
AVAX/BTC
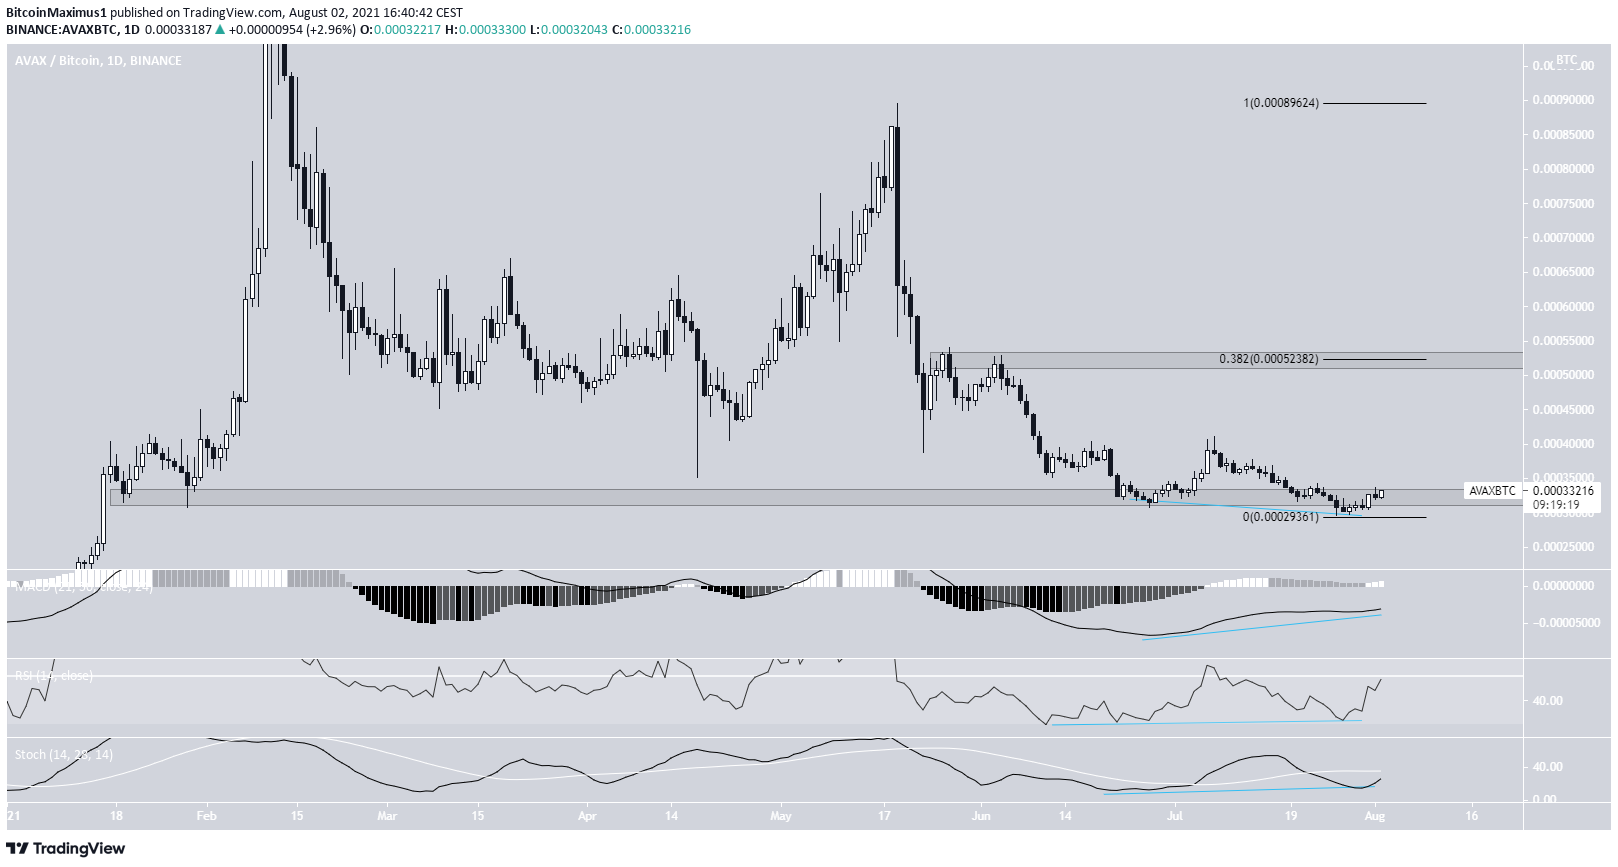
The AVAX/BTC chart shows that it’s trading inside the 32,500 satoshi horizontal support area.
A bounce seems likely, since the movement is combined with significant bullish divergences in the MACD, RSI, and Stochastic oscillator.
If this occurs, the closest resistance area would be found at 52,400 satoshis. This target is the 0.382 Fib retracement resistance level and a horizontal resistance area.
For BeInCrypto’s latest bitcoin (BTC) analysis, click here.



