
Avalanche (AVAX), the token of the smart contract blockchain, has been swinging toward lower price levels for almost a month. As a result, traders in the derivatives market are moving from a previous bullish thesis to a bearish bias.
AVAX had an impressive performance in 2023 and the first quarter of 2024. But recently, the token seems to have lost its stroke of luck.
Bulls Are Staying Away From Avalanche
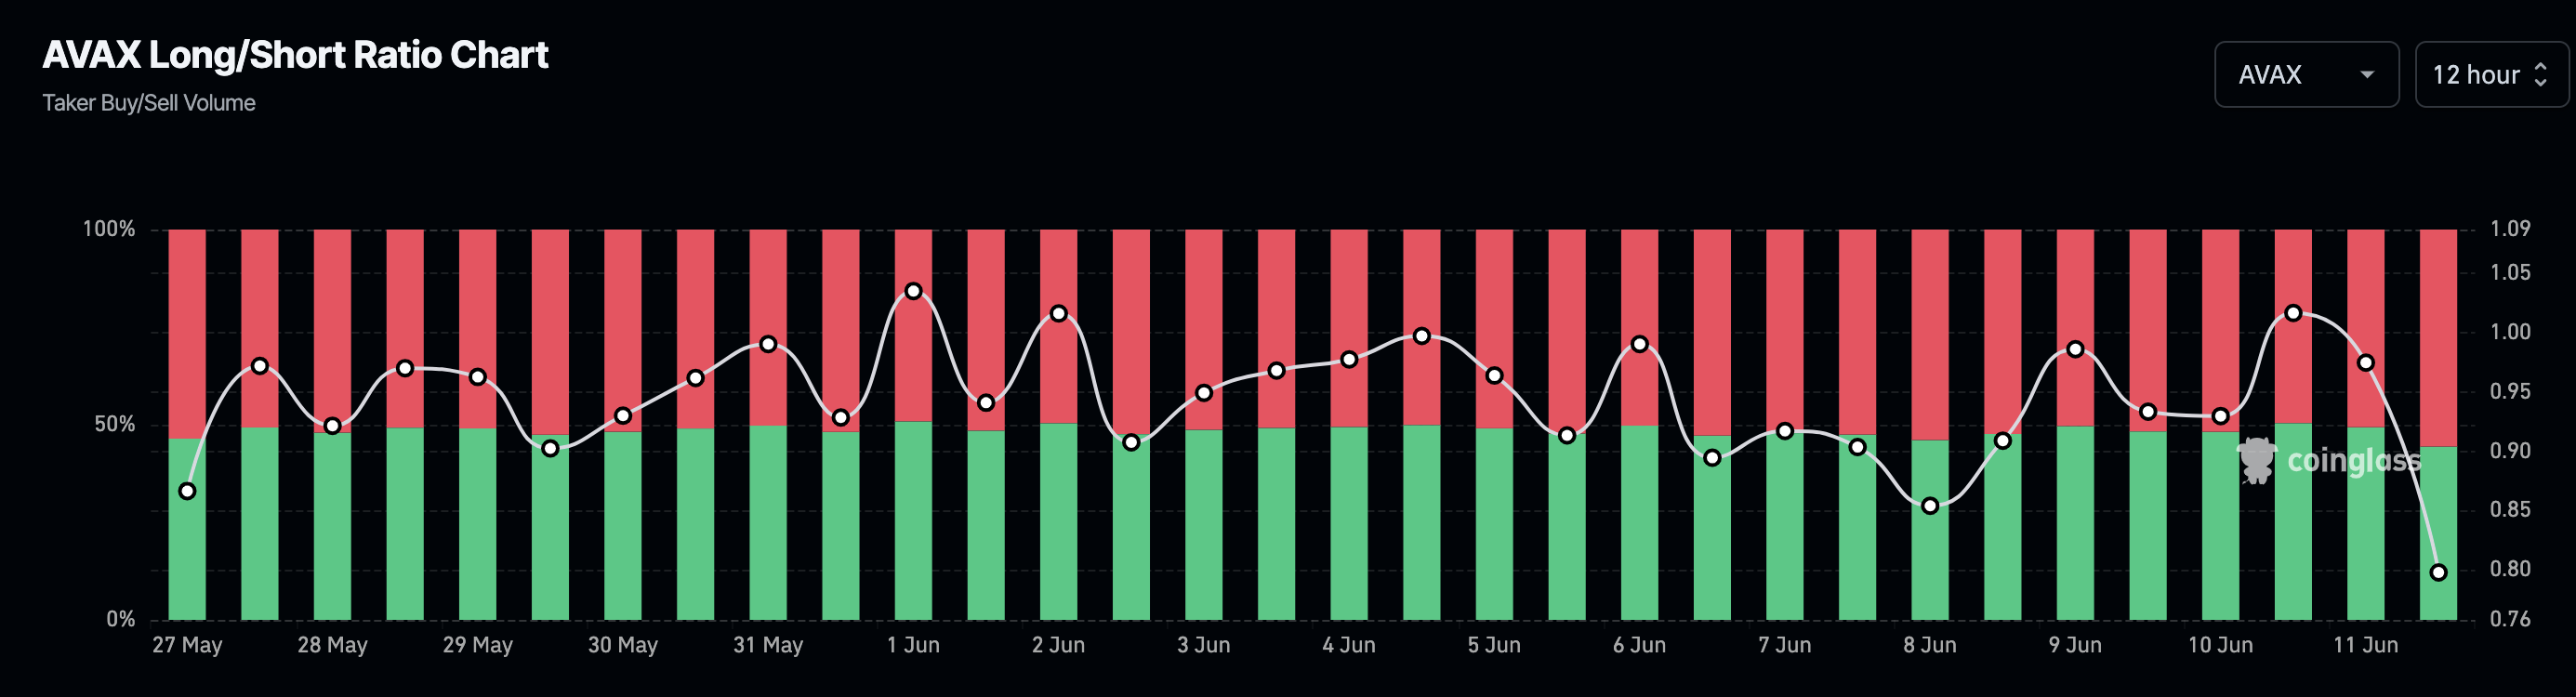
AVAX trades at $31.53. However, the Long/Short Ratio shows traders expect the price to fall despite the 8.66% 7-day decrease. Evidence of this sentiment is reflected in the Long/Short Ratio.
The Long/Short Ratio measures traders’ expectations toward a cryptocurrency. Values of this indicator above 1 indicate that there are more long positions than shorts. Conversely, a Long/Short Ratio ratio lower than 1 suggests increased bearish predictions.
A long is a market participant expecting the price of a token to increase while filling the bid on a contract. On the other hand, a short is a trader betting on a price decrease.
According to the derivatives information portal Coinglass, AVAX’s Long/Short Ratio was 0.79. This reinforces the aforementioned perception in the market.
Read More: 11 Best Avalanche Wallets to Consider in 2024
Besides the ratio, Open Interest aligns with the potential price decrease. Open Interest refers to the value of outstanding contracts in the market.
This indicator decreases or increases based on net positioning. Unlike the Long/Short Ratio, Open Interest does not indicate whether there are more longs or more shorts. Instead, an increase in Open Interest refers to an influx of liquidity and open contracts.
However, a decrease suggests a rise in closed positions and increased outflow of money. As of this writing, AVAX’s open interest was $211.64 million. On June 7, when the price of AVAX was $35, Open Interest was much higher.
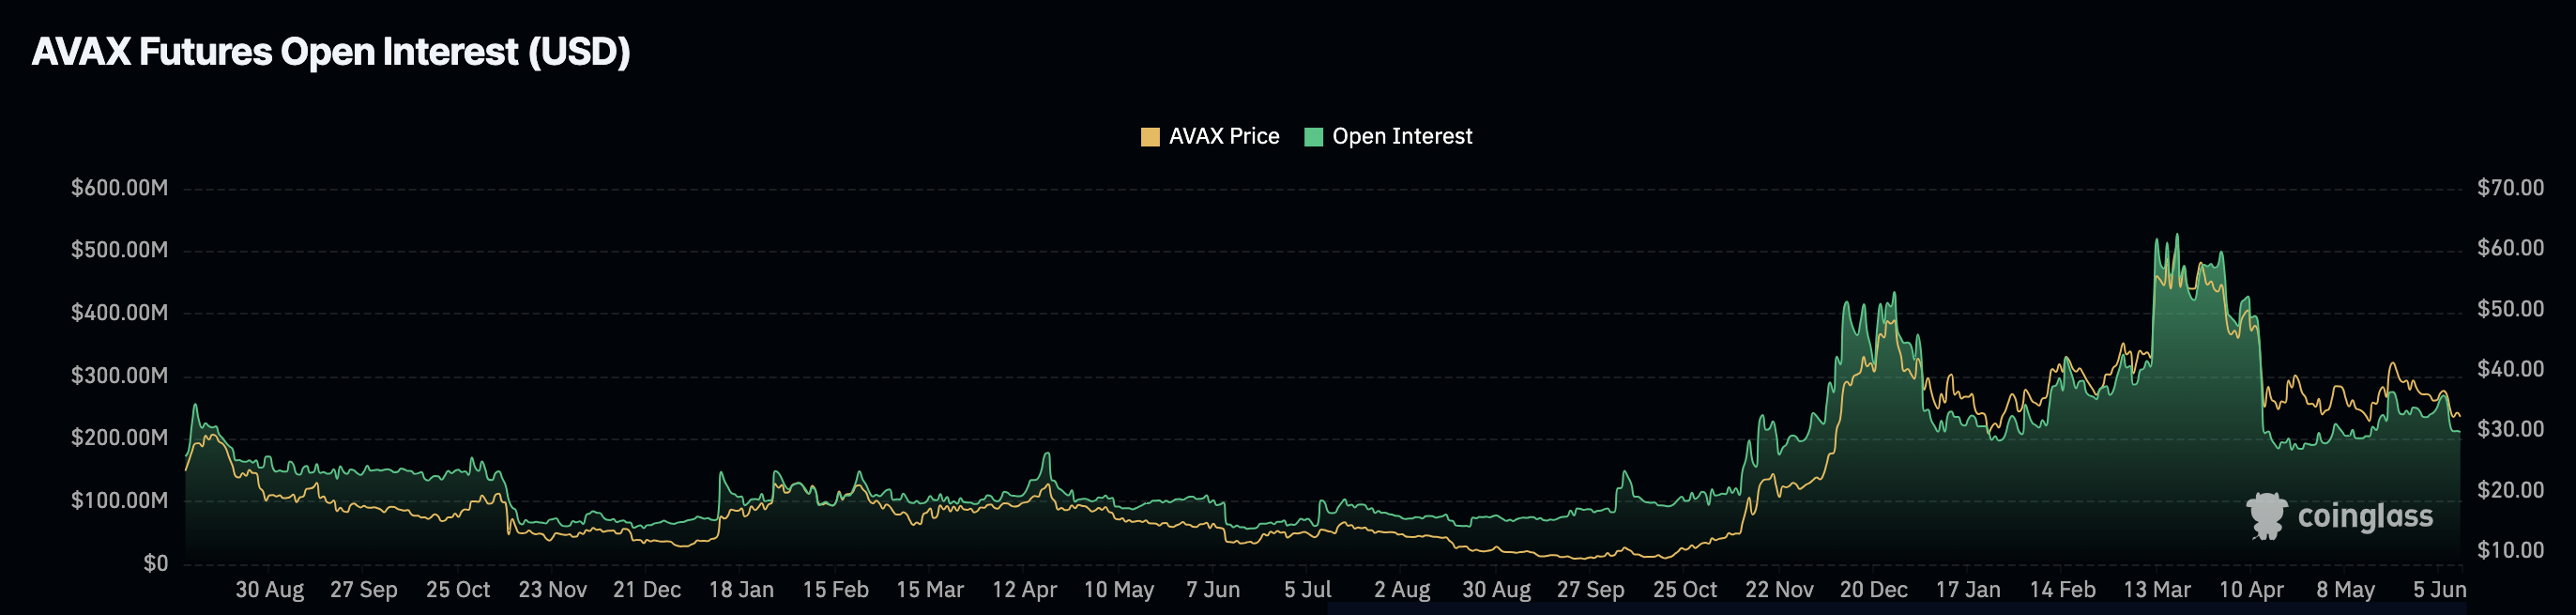
For the token’s value, the decrease may confirm a downward trend as opposed to the upward strength an increase in Open Interest may offer.
AVAX Price Prediction: Long Road From Rally
Meanwhile, AVAX’s market structure on the daily chart suggests a potential fall. The Exponential Moving Average (EMA) is a crucial indicator that corroborates this bias.
EMA measures trend direction and reflects how prices can change within a given period. On the AVAX/USD daily chart, the 20 EMA (blue) crossed below the 50 EMA (yellow) since April 13.
This position is called a death cross and is a bearish trend. It occurs when the longer EMA crosses above the shorter EMA. The opposite is the golden cross that occurs when the shorter EMA crosses above the longer EMA.
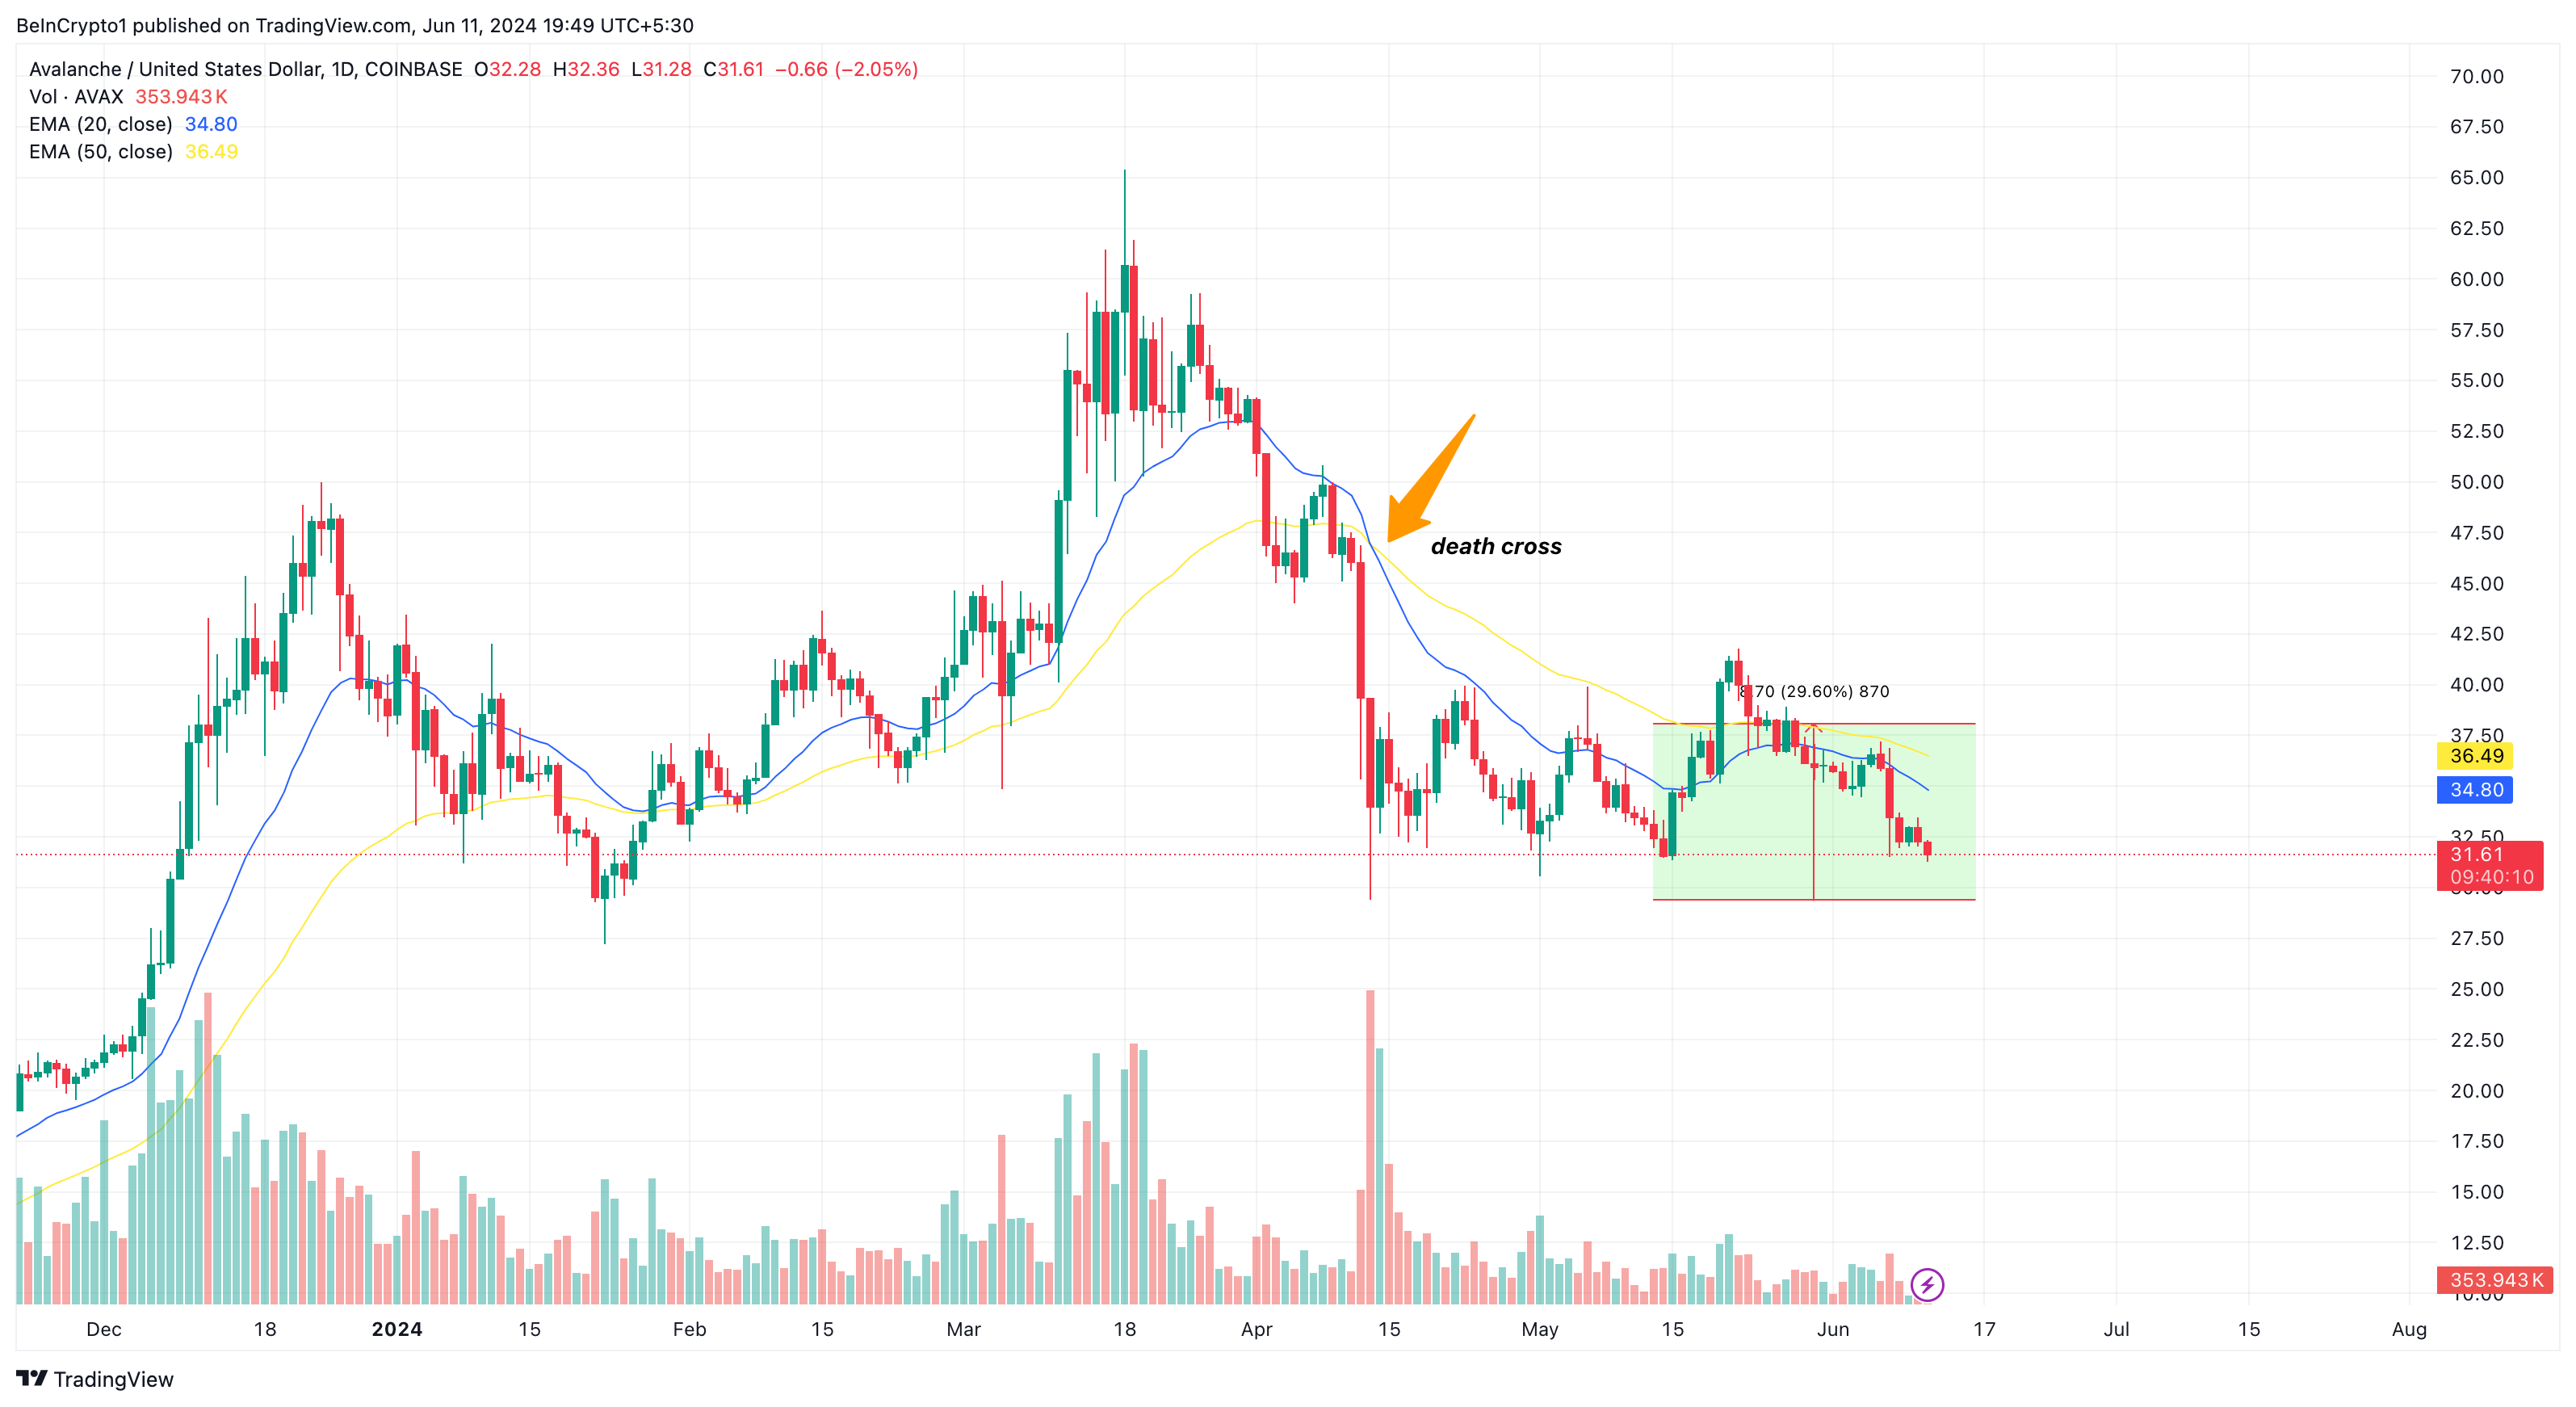
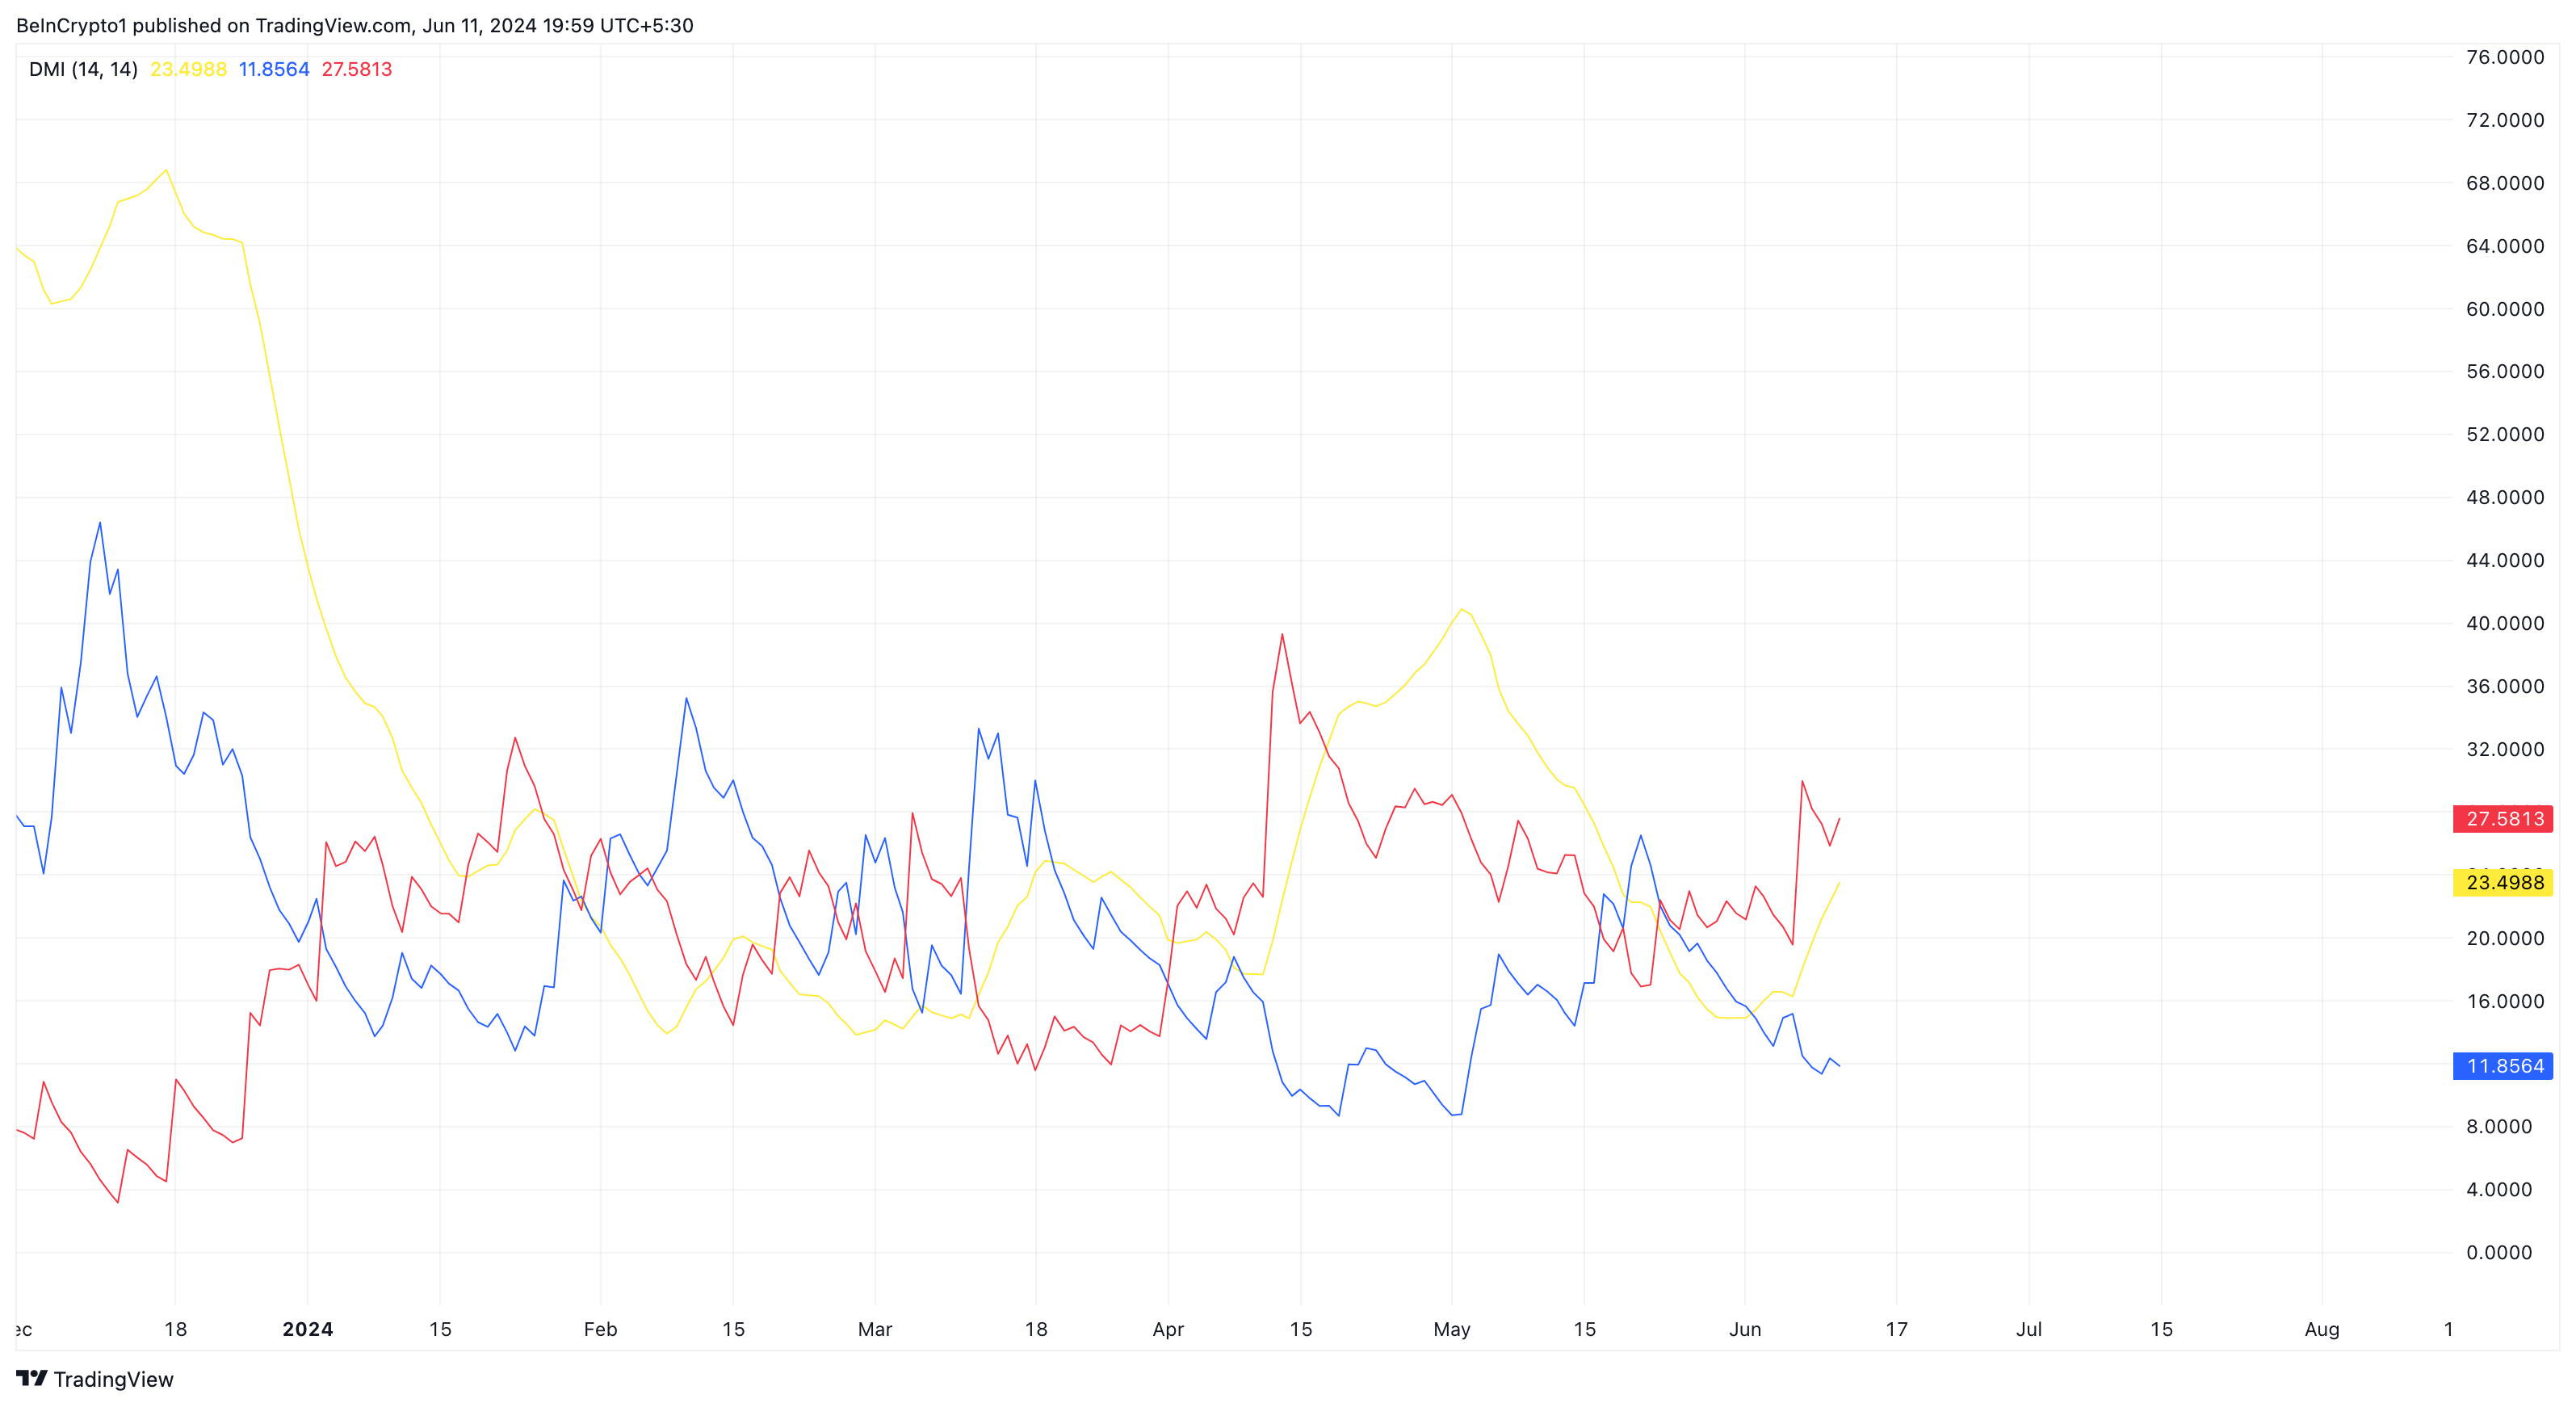
This position puts AVAX at risk of a decline to $29.38. Further, the Directional Movement Index (DMI) supports the potential price decrease.
The chart below shows that the -DMI (red) was 27.58, while the +DMI (blue) was 11.85. DMI measures both strength and direction. Therefore, the difference between the +/-DMI suggests a downward direction for AVAX.
Also, the Average Directional Index (ADX) trends upward. The ADX (yellow) shows the strength of the direction. If the ADX spikes, it means that the direction has strength behind the movement.
However, a low DMI reading means that the directional strength is weak. In AVAX’s case, it was the former.
Read More: How to Buy Avalanche (AVAX) with a Credit Card: A Step-by-Step Guide
Therefore, the price may drop below $30 in the short term. However, the prediction may be null and void if the broader market begins to recover, as AVAX may follow the directions of other altcoins.
