Avalanche (AVAX) is showing readings similar to those in October, just prior to the upward movement that led to the current all-time high price.
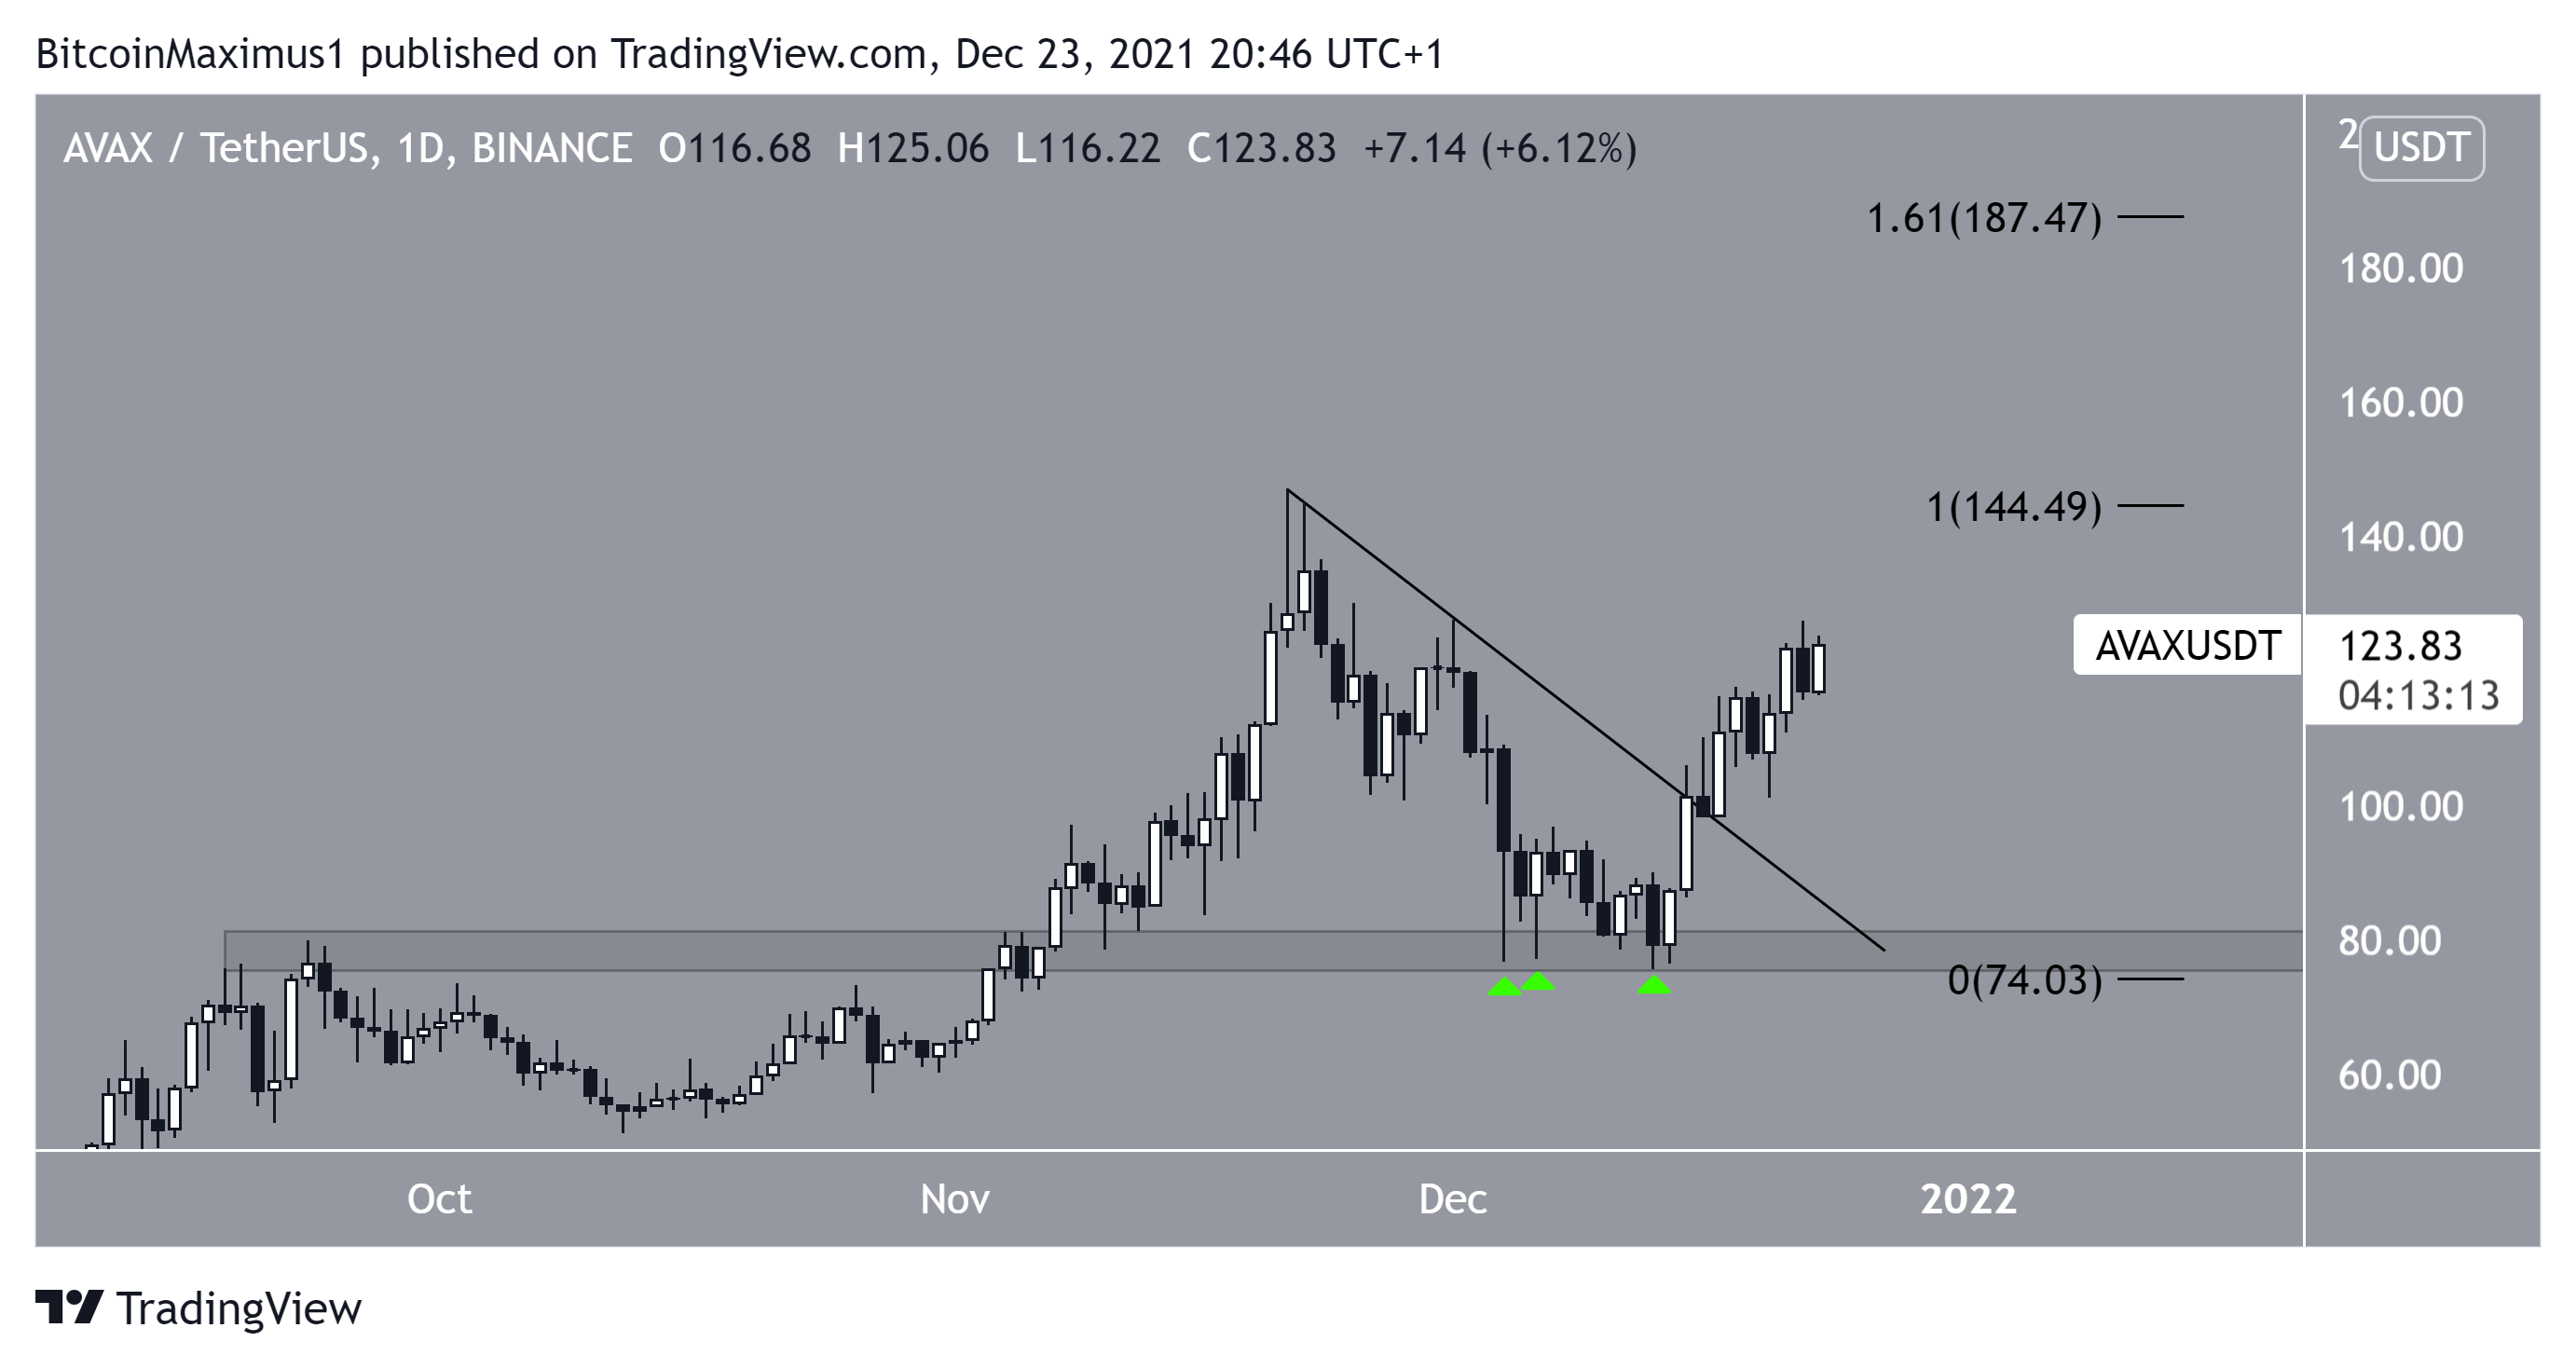
Beginning on Dec 4, AVAX bounced thrice (green icons) above the $80 horizontal support area. The bounces were crucial, since they served to validate the previous all-time high resistance as support.
Afterwards, the token broke out from a descending resistance line, confirming that the correction is complete. The line had previously been in place since the $147 all-time high price of Nov 21.
If AVAX reaches a new all-time high, the next resistance would be at $187.5, created by the 1.61 external Fib retracement level.
Similar upward movement
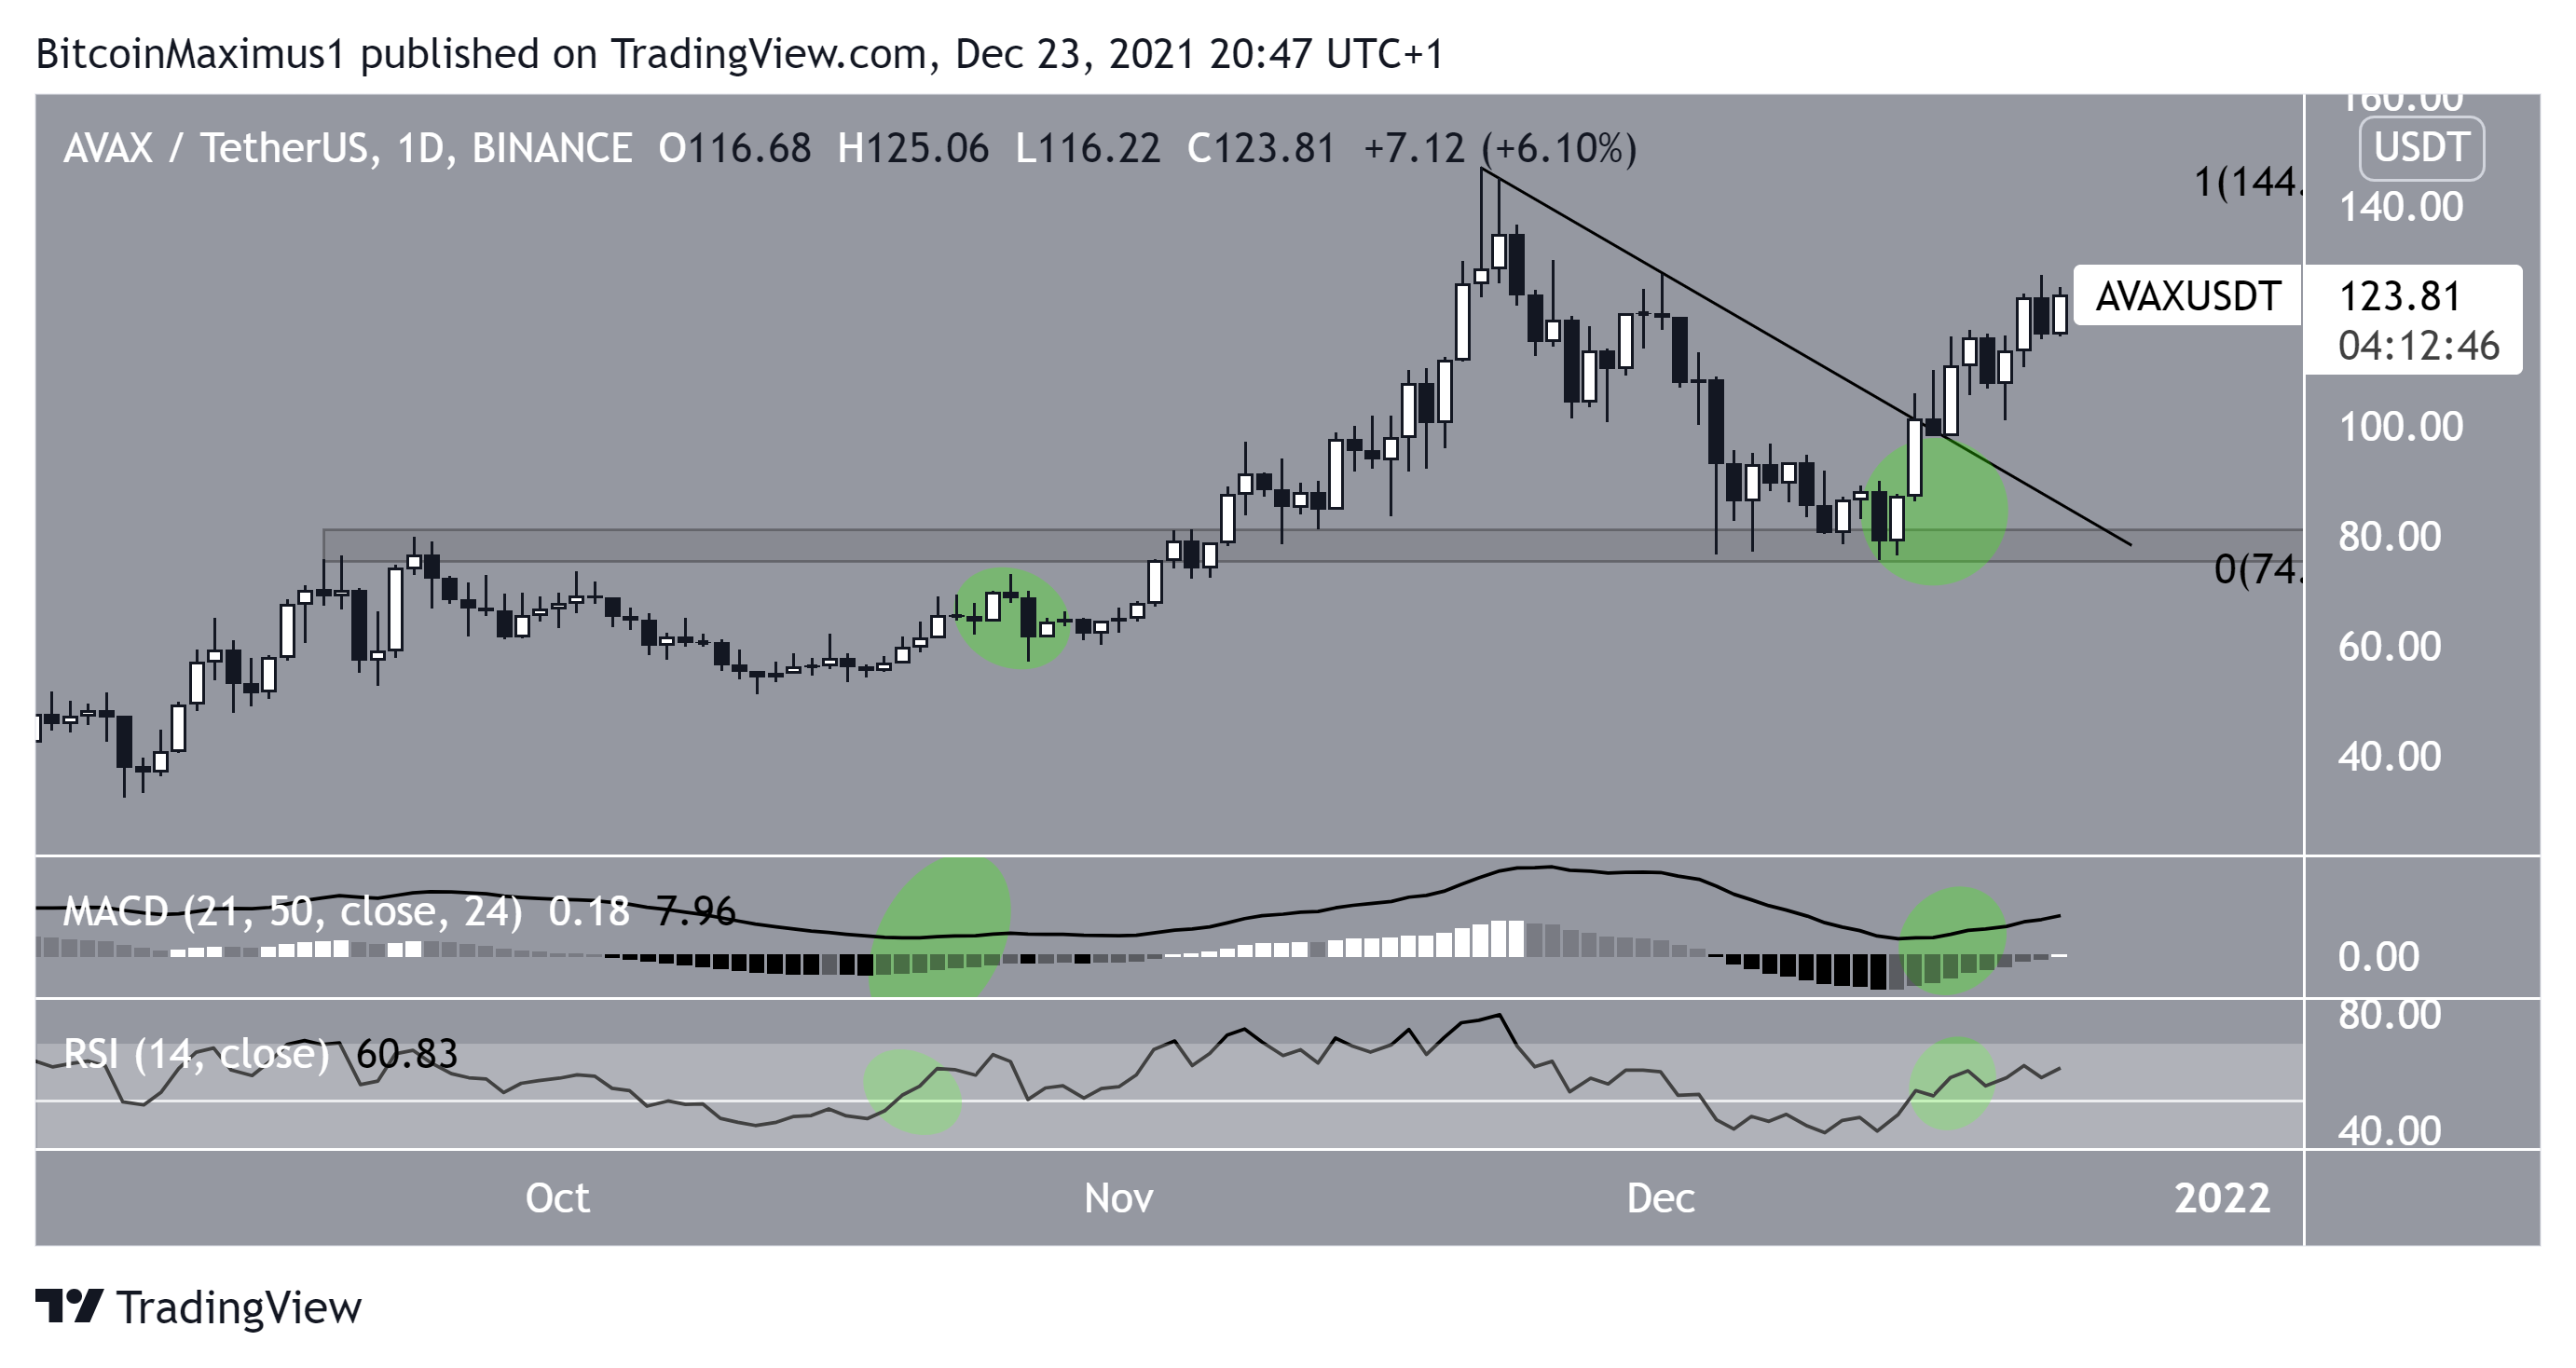
Technical indicator readings are also bullish.
The MACD, which is created by a short and a long-term moving average (MA), is positive and increasing. This means that the short-term MA is moving faster than the long-term one, and is a staple of bullish trends.
Furthermore, its histogram has created several successive higher momentum bars, further confirming the acceleration of the bullish trend.
Similarly, the RSI, which is a momentum indicator, has moved above the 50 line, which is considered a threshold for a bullish/bearish trend.
The previous time both these events occurred was in late October, just prior to the acceleration of the upward movement towards the all-time high.
So far, a similar upward movement has been transpiring.
Future movement
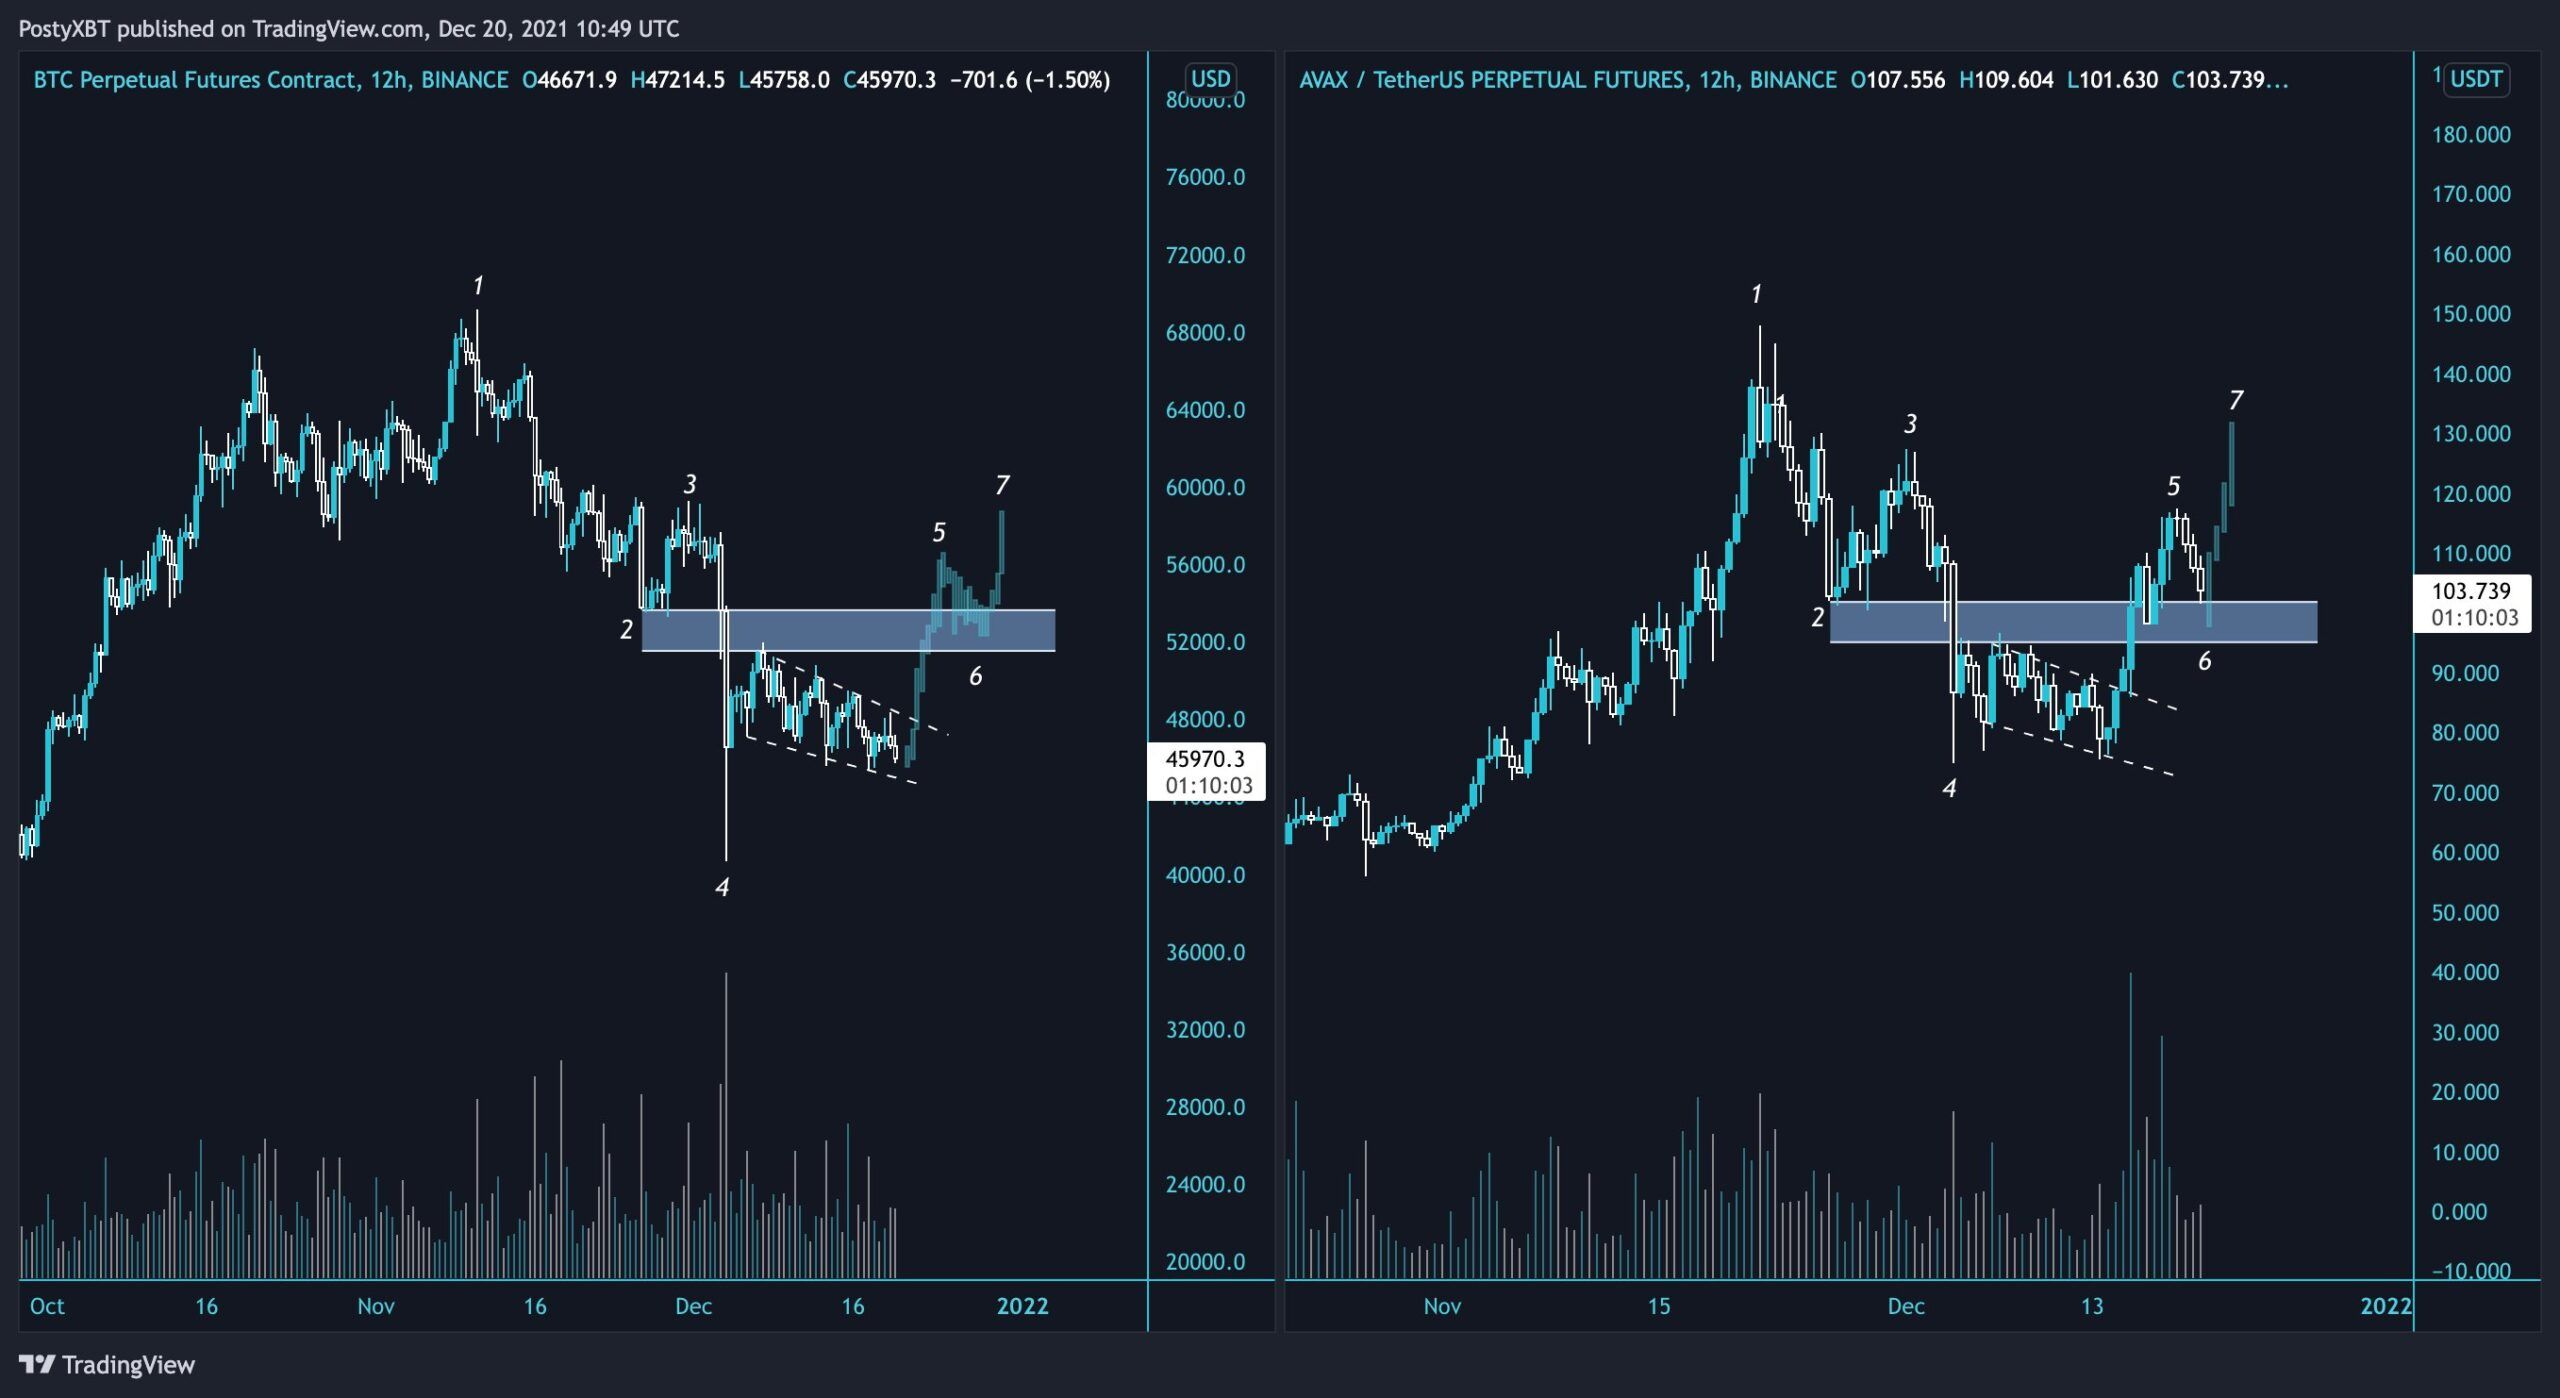
Cryptocurrency trader @PostyXBT tweeted an AVAX chart, stating that the token is leading the market and is likely to increase towards at least $140.
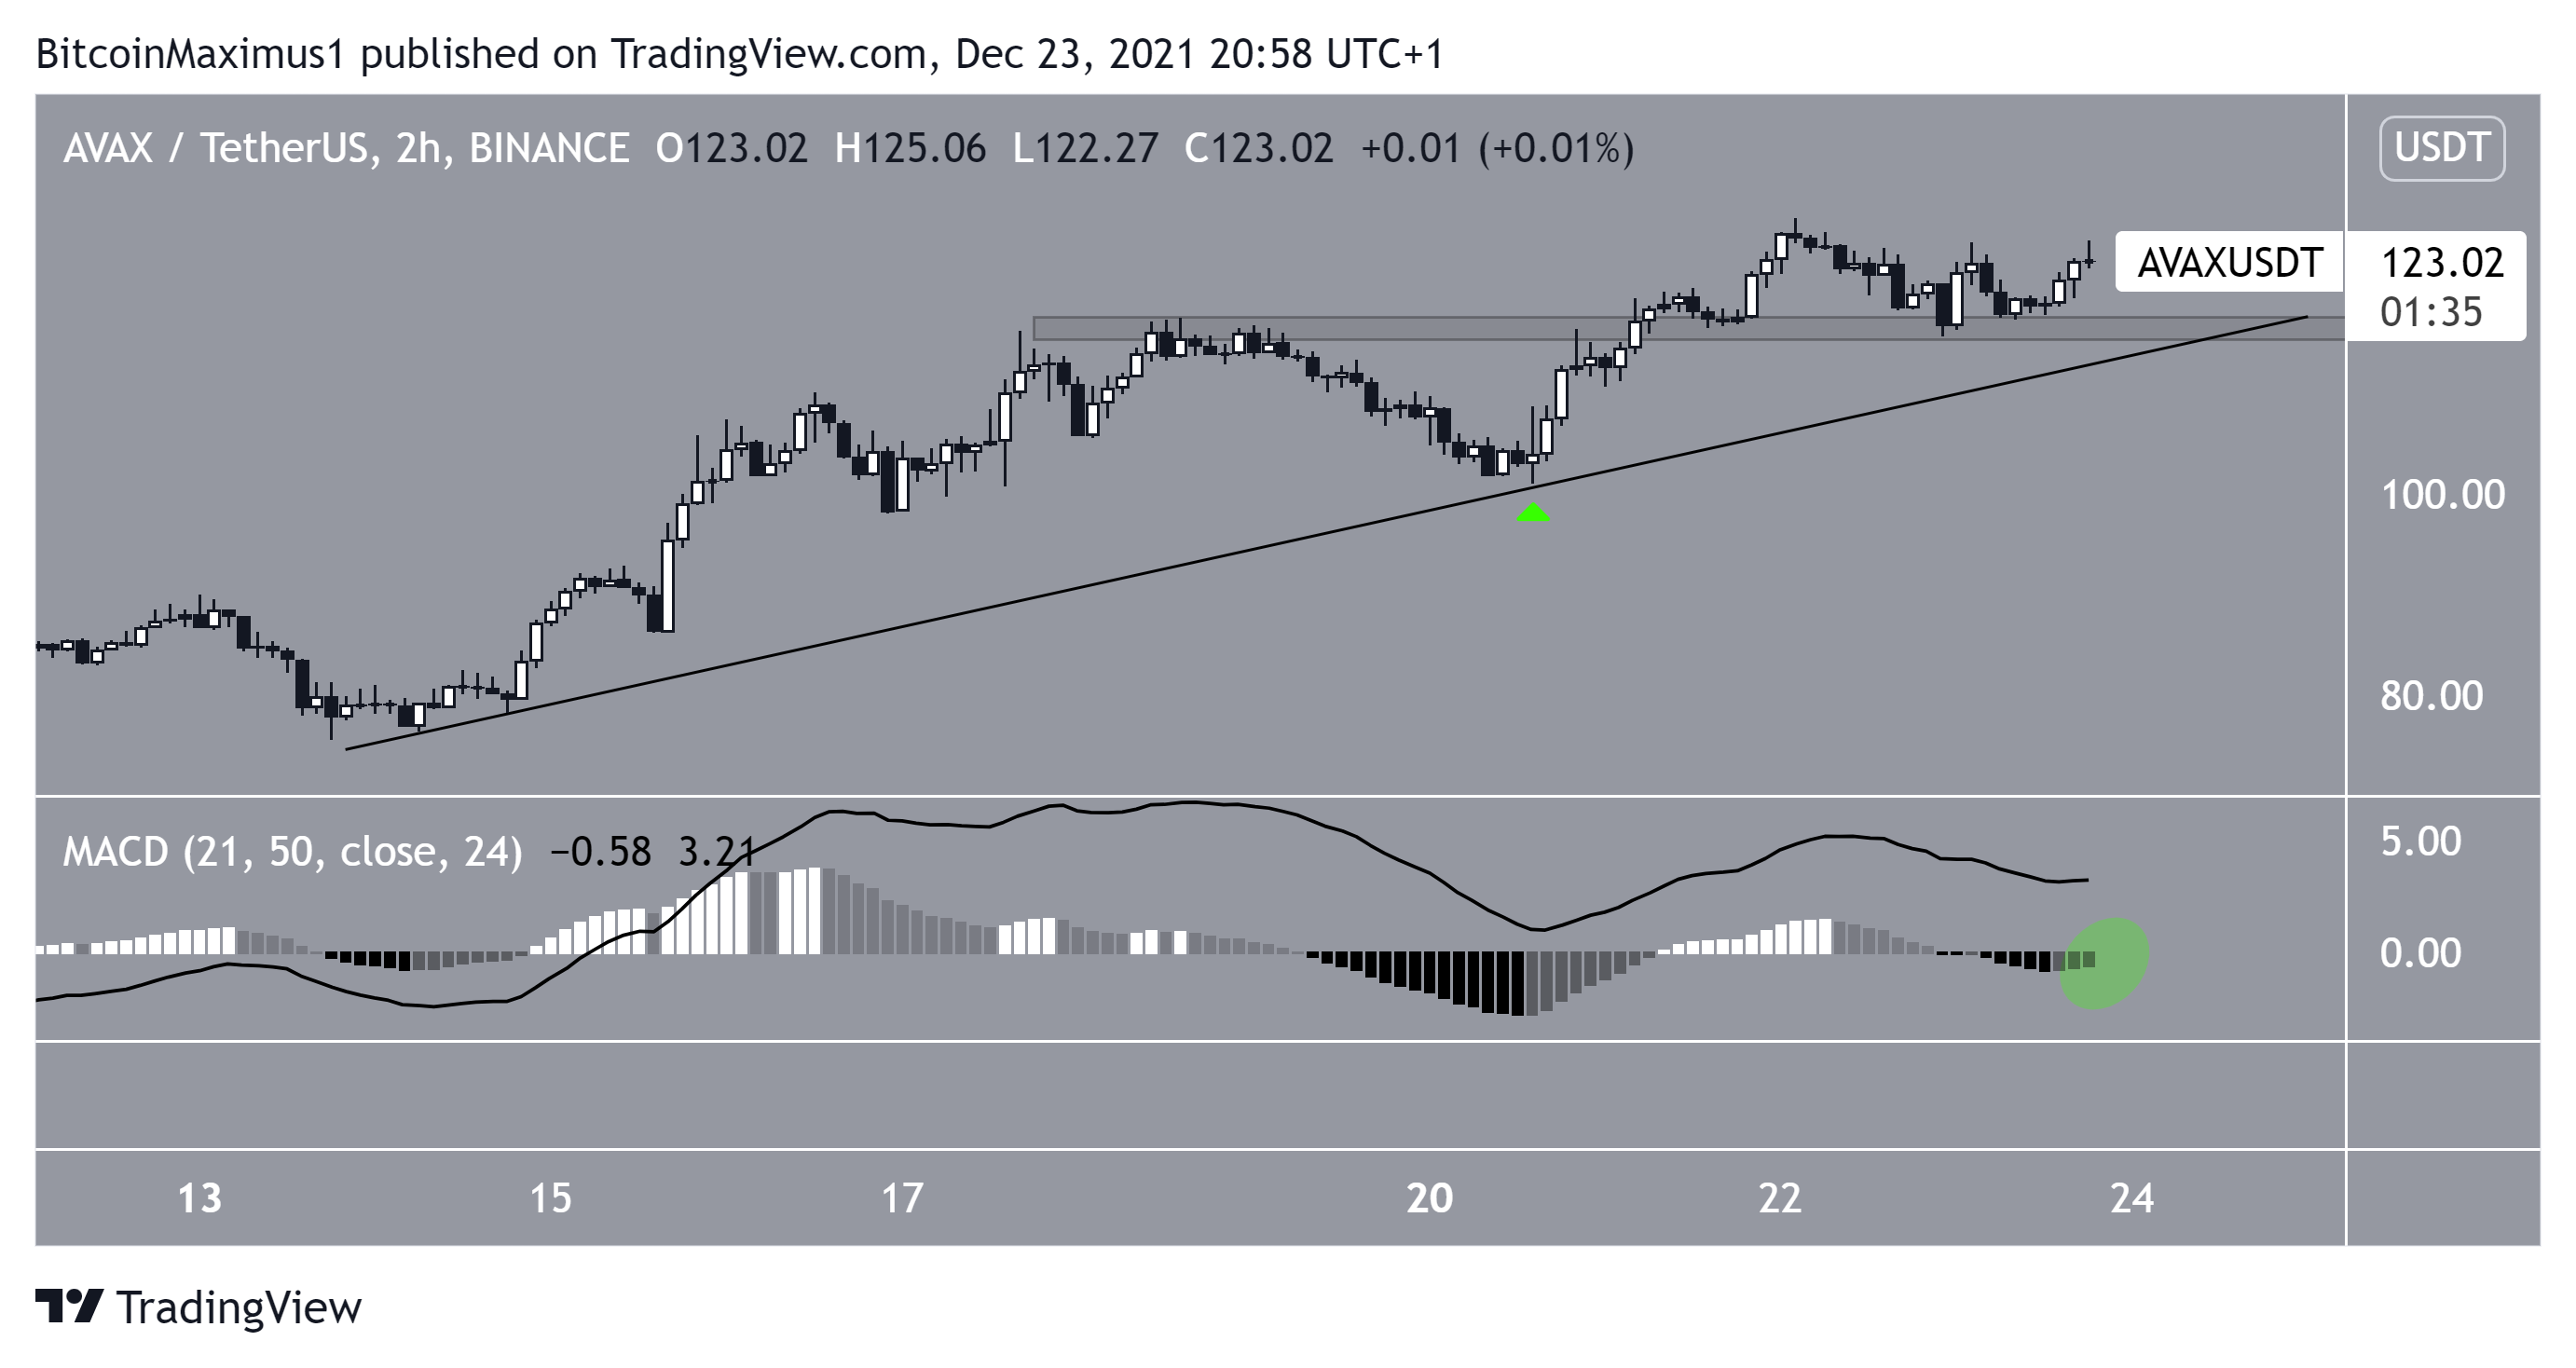
The shorter-term chart suggests that AVAX will eventually be successful in reaching this area. It shows that the token is following an ascending support line, most recently bouncing on it on Dec 23.
Furthermore, it has reclaimed the $120 minor resistance level, validating it as support afterwards.
Similarly to the daily time-frame, the MACD has generated successive higher momentum bars, a sign of a strengthening bullish trend.