


Avalanche (AVAX) has been making new all-time highs since Nov 19 and has not shown any signs of weakness yet.
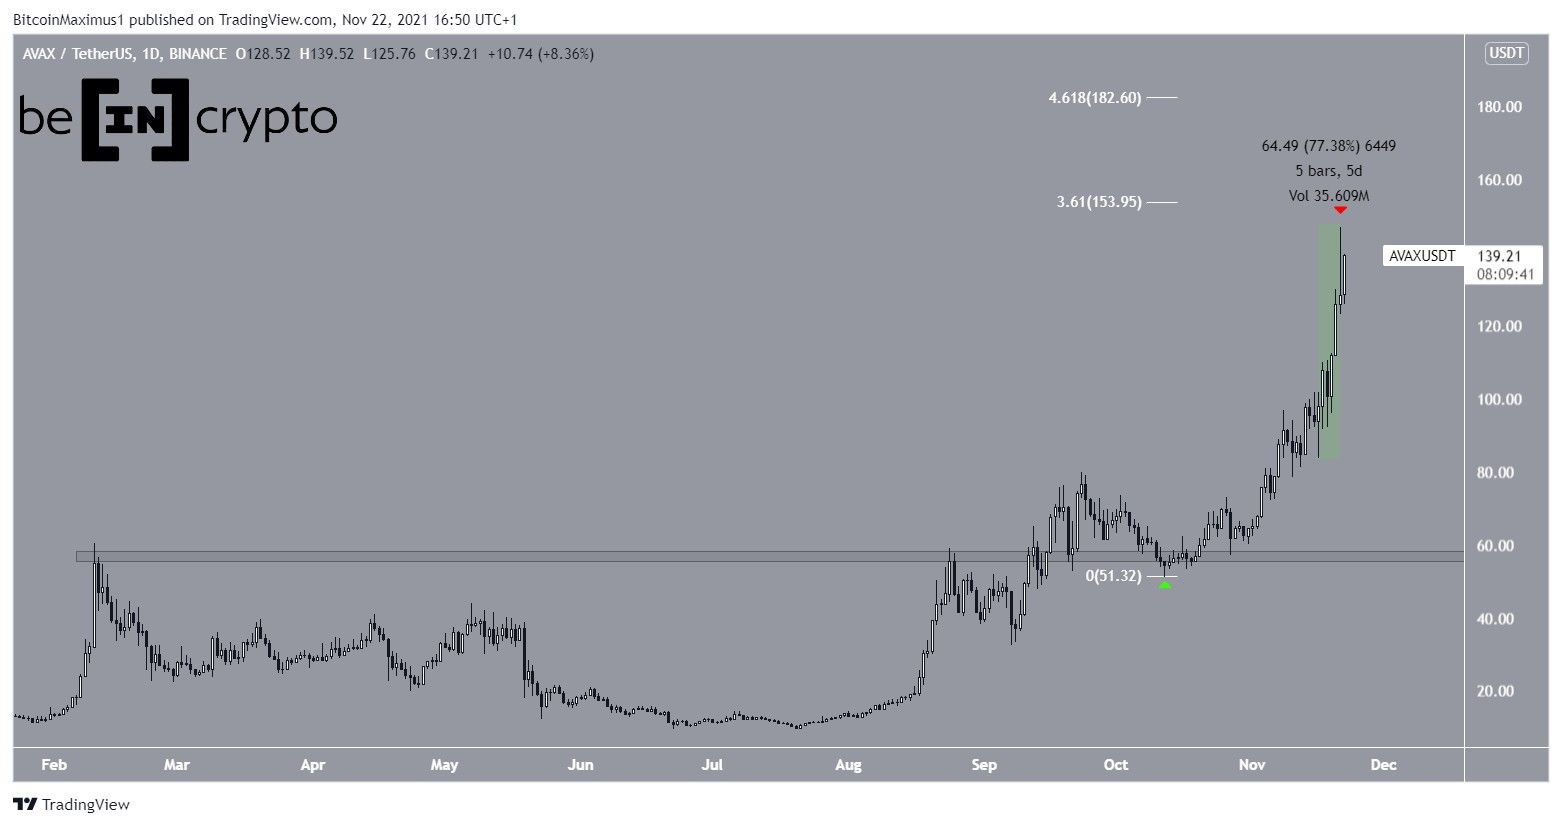
AVAX has been increasing at an accelerated rate since Sept 12. The increase became completely parabolic after Nov 16, and in a span of five days, it moved upwards by 77%. This led to a new all-time high price of $147 on Nov 21.
While this initially created a long upper wick (red icon), which is considered a sign of selling pressure, AVAX has regained its footing and is moving upwards once more.
The closest resistance area is at $154. This is the 3.61 external Fib retracement level when measuring the most recent drop (white). Beyond that, AVAX will likely find resistance at $182..
Has a top been reached?
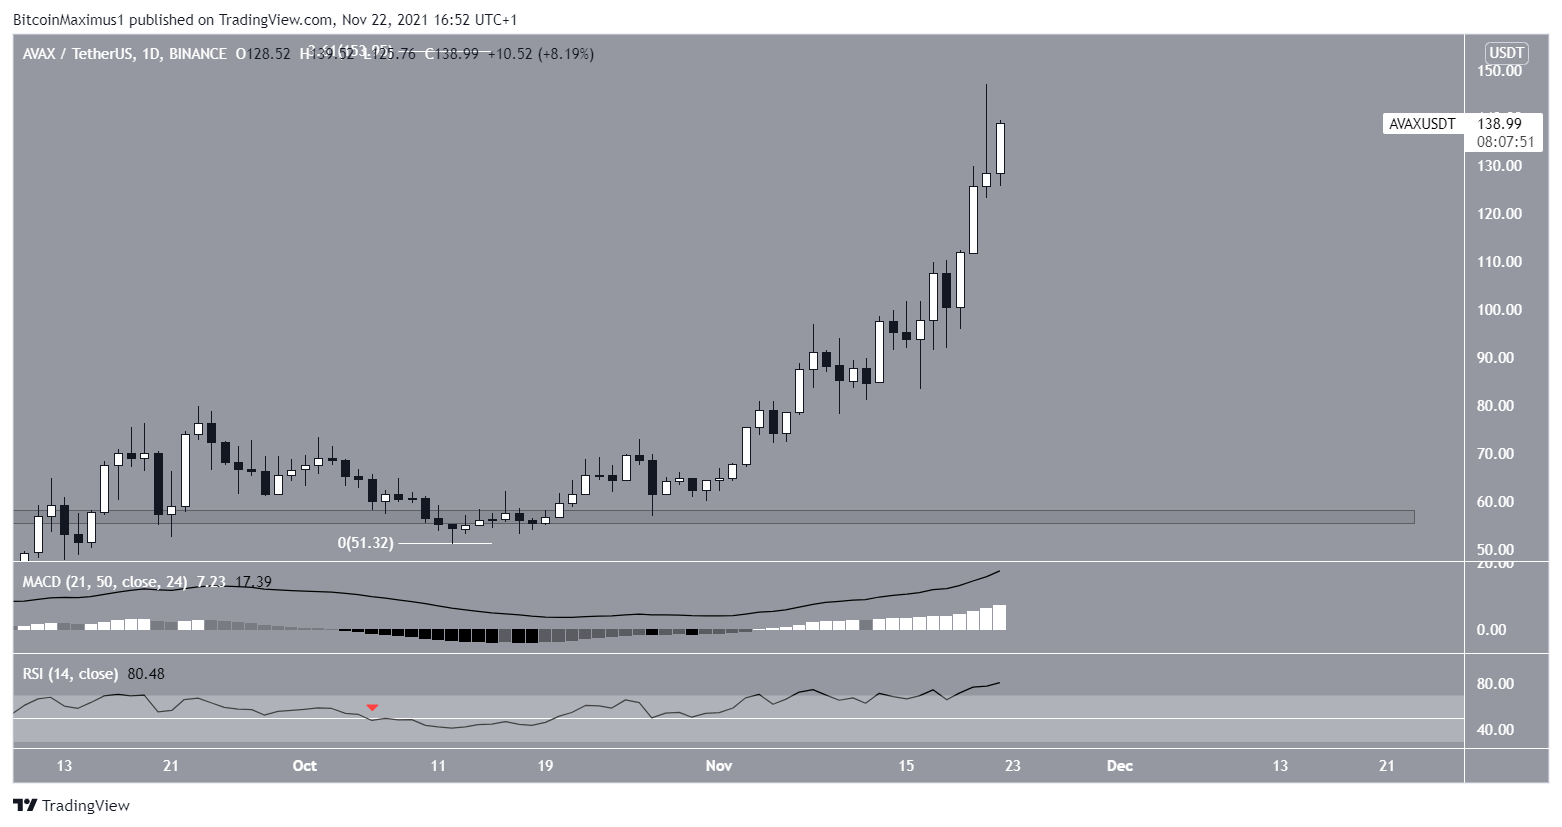
A closer look at technical indicators does not reveal any weakness.
The MACD, which is created by short and long-term moving averages (MA), is positive and increasing. This means that the short-term MA is moving at a faster rate than the long-term one.
The RSI, which is a momentum indicator, is increasing and is above 70. While this gives an overbought reading, it still suggests that the trend is bullish. Furthermore, the sharpest portions of an upward move usually occur when the RSI is overbought.
More importantly, there is no bearish divergence, which is often associated with tops.
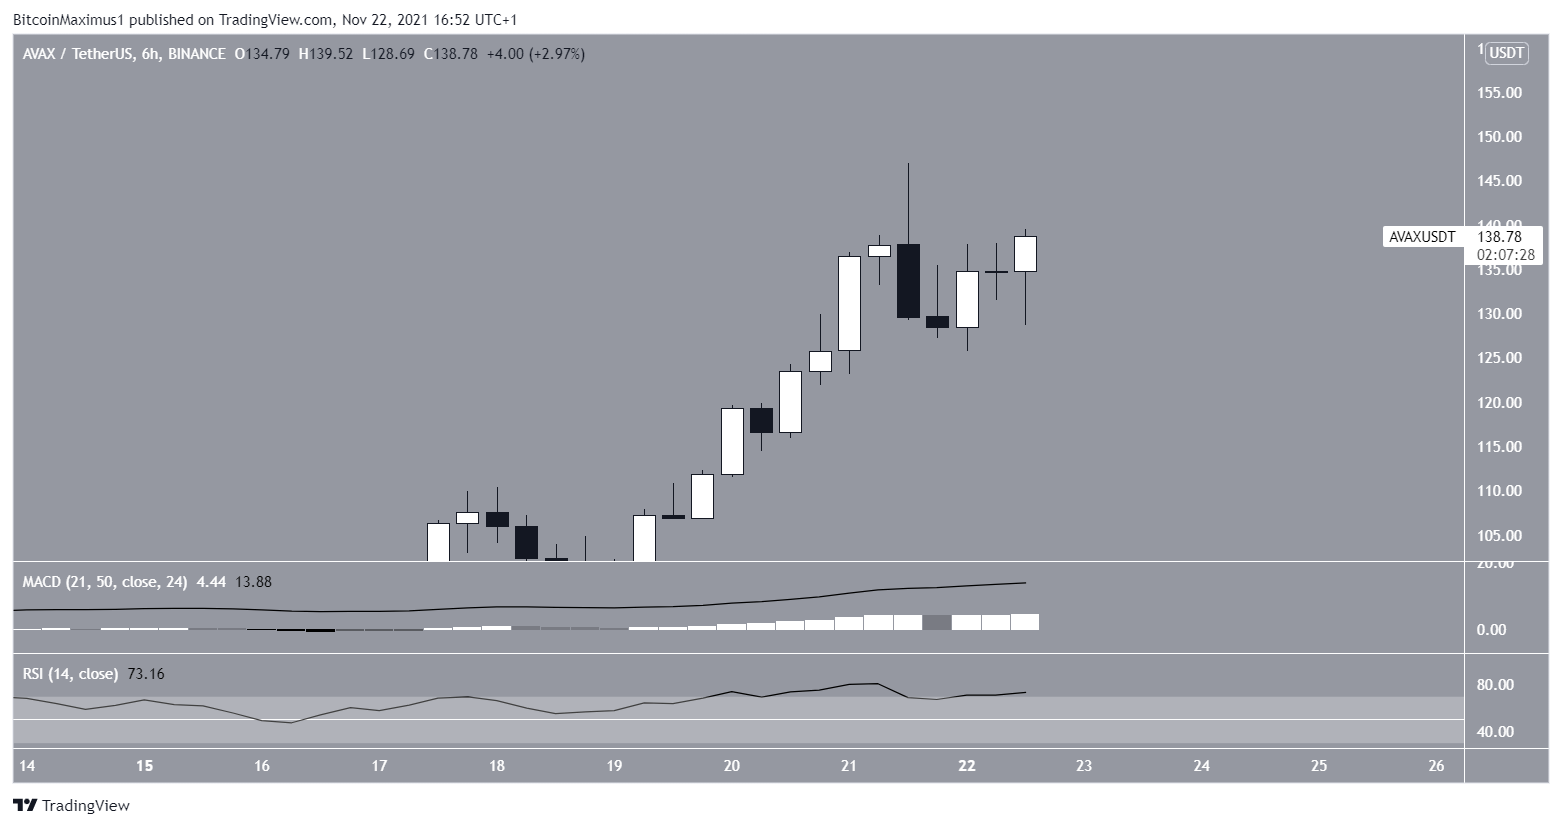
Similarly, while the shorter-term six-hour chart could develop into a double top, which is a bearish pattern, there is no bearish divergence in place in neither the MACD nor RSI.
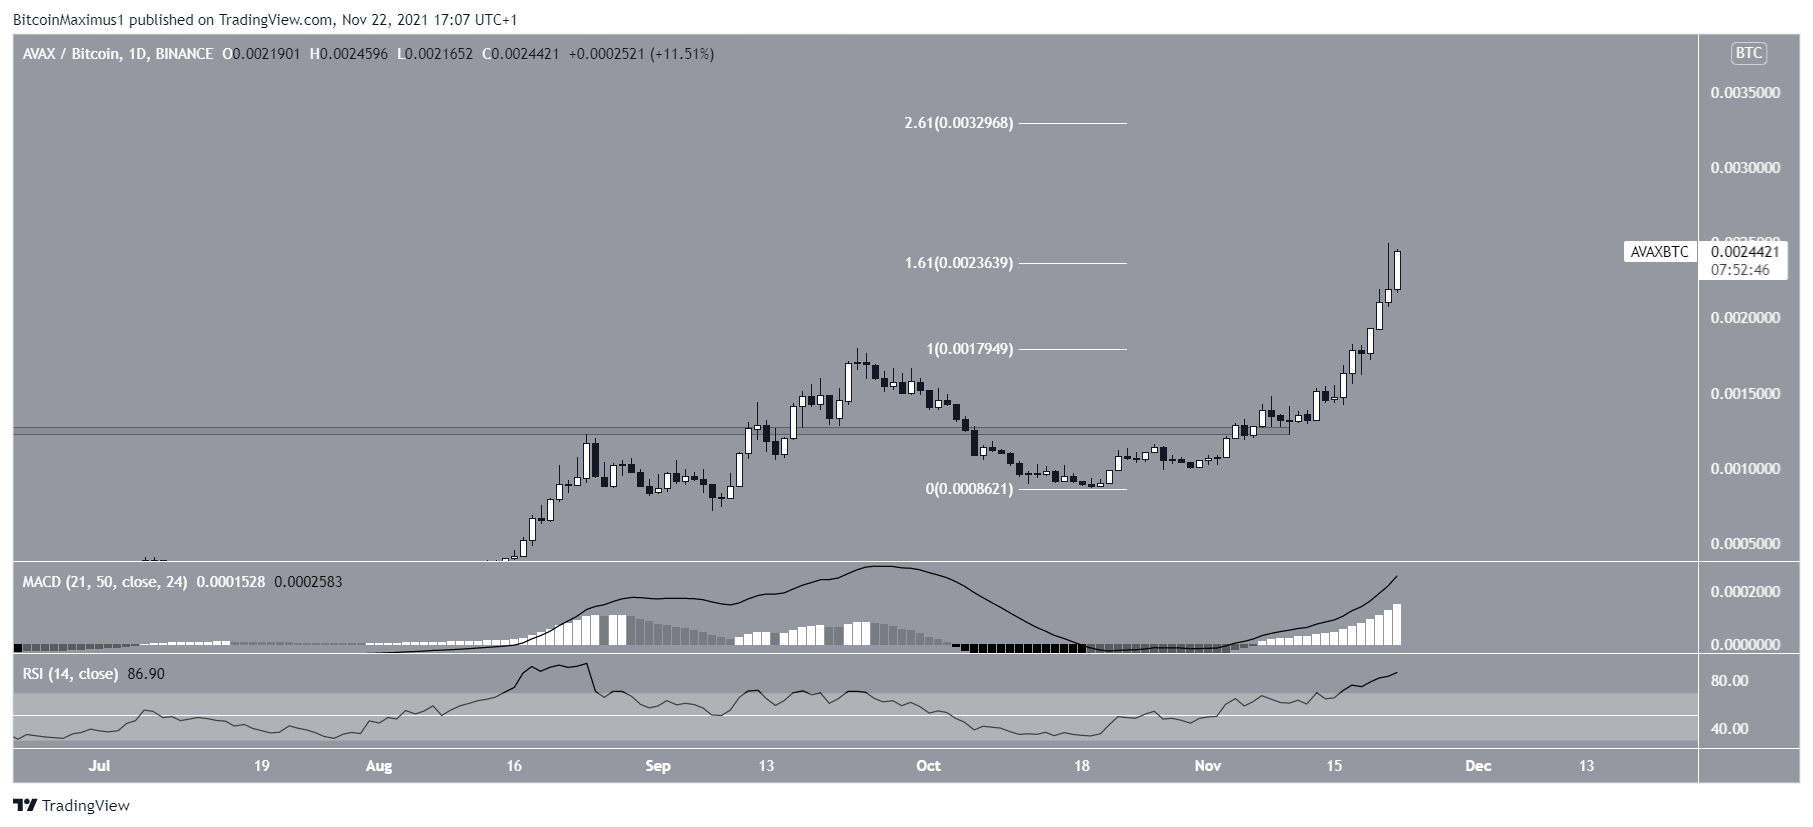
AVAX/BTC
Cryptocurrency trader @AltcoinSherpa outlined an AVAX chart, stating that the pair could move to the all-time highs of ₿0.0018.
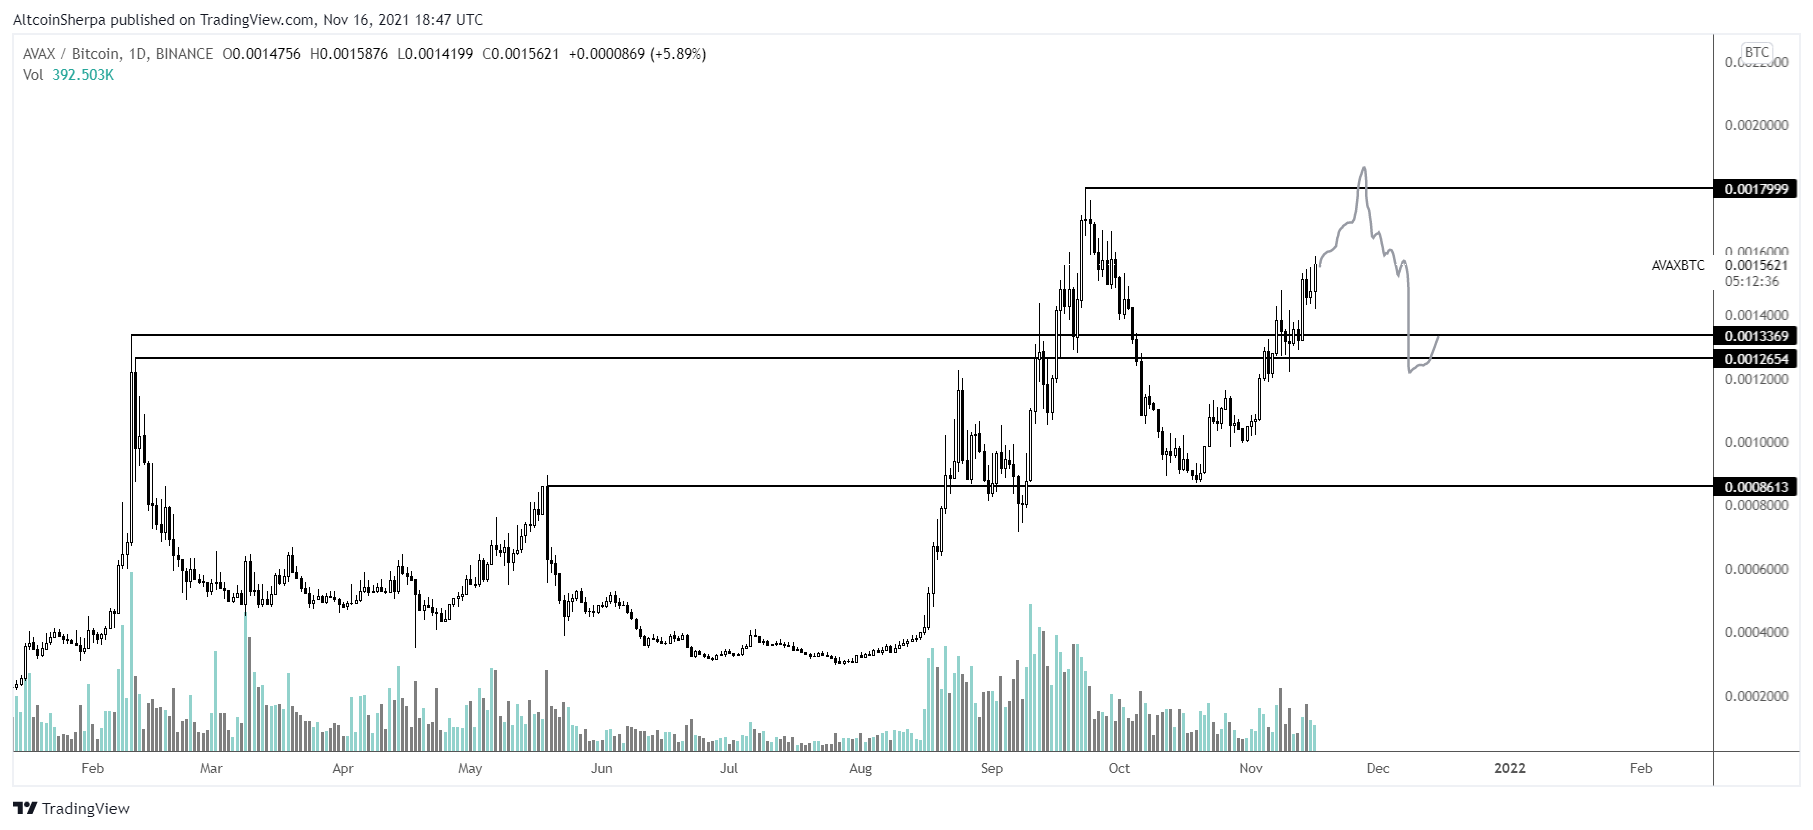
Since the tweet, AVAX has already broken out from the resistance area and reached a new all-time high price.
Furthermore, it moved above the ₿0.00236 resistance area, which is the 1.61 external Fib retracement resistance level. The next resistance is found at ₿0.0033, the 3.61 external Fib retracement level.
Similar to the USD pair, there is no weakness in technical indicators. Therefore, it’s possible that AVAX will continue increasing towards the 3.61 Fib resistance.
For BeInCrypto’s latest Bitcoin (BTC) analysis, click here.


