


Avalanche (AVAX) has been increasing since Jan 22, but technical indicators and the price action still show a bearish trend.
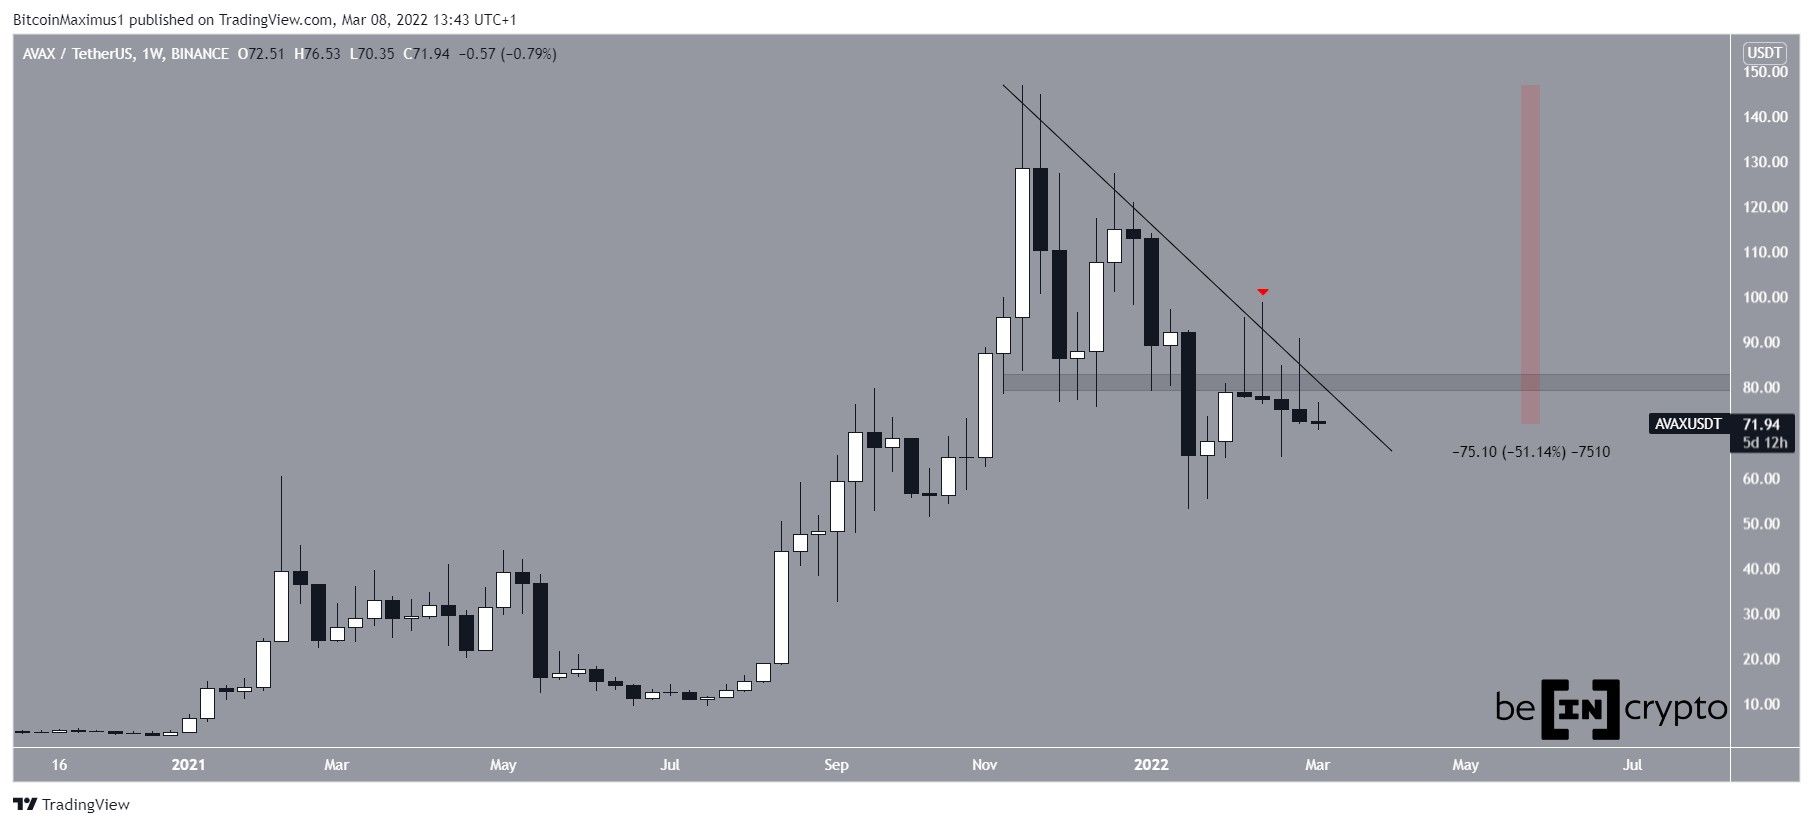
AVAX has been falling since Nov 21, when it reached an all-time high price of $147. The downward movement has followed a descending resistance line, which has been validated several times until now.
So far, AVAX has reached a low of $52.95 on Jan 22.
During the downward movement, the price also broke down from the $81 horizontal area and validated it as resistance afterwards.
Currently, AVAX is 51% below its all-time high price.
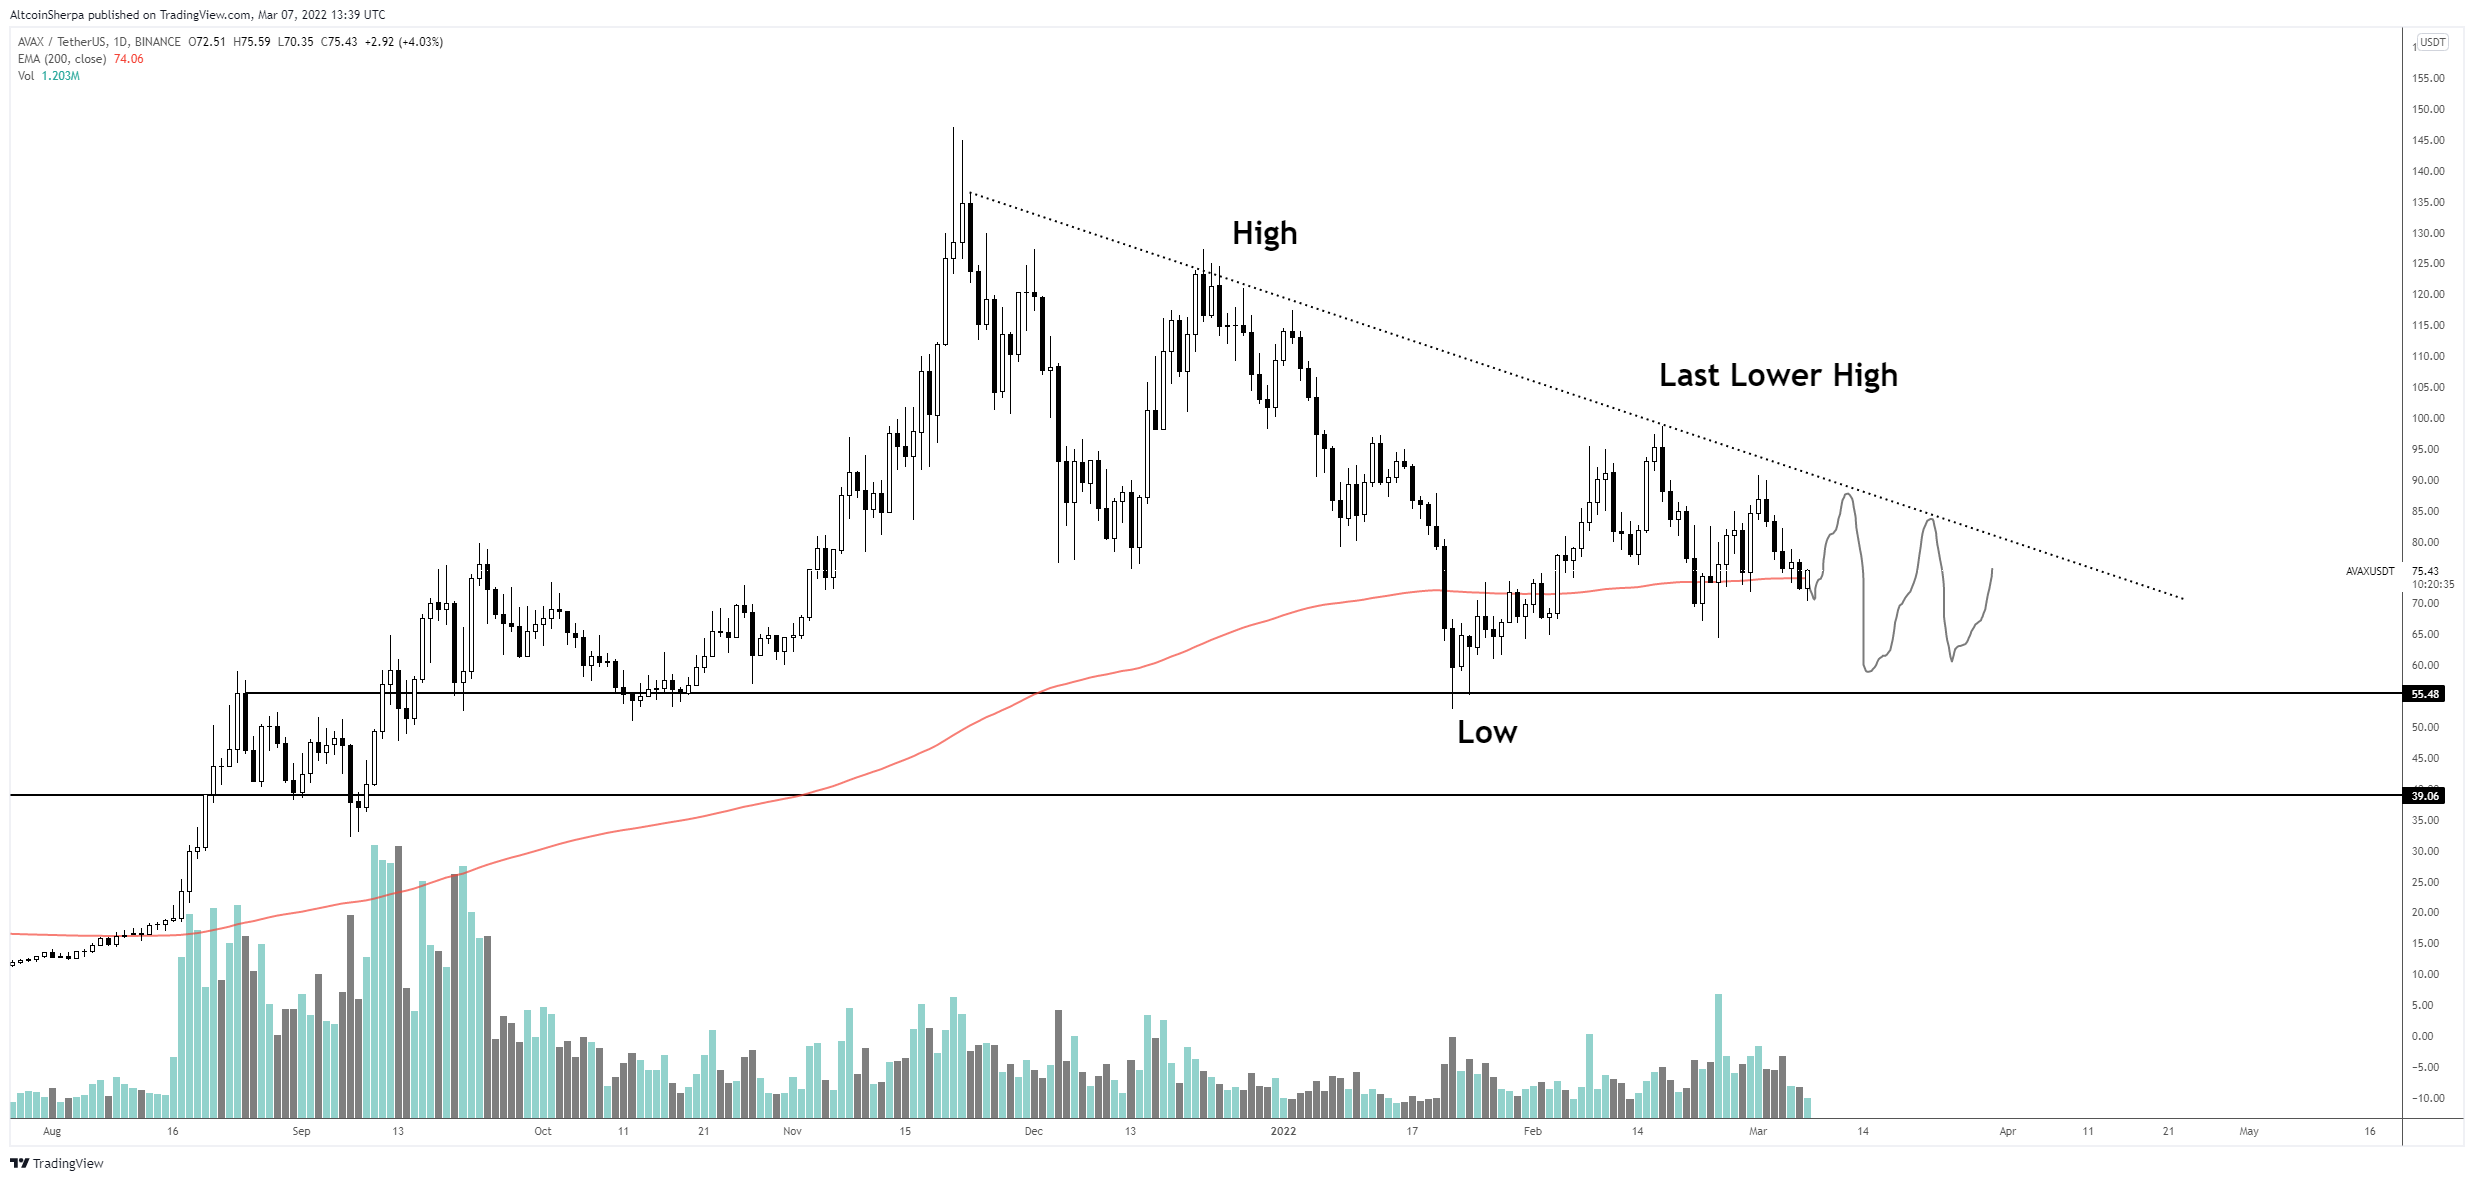
Cryptocurrency trader @altcoinsherpa tweeted a chart of AVAX, stating that the price movement still looks bearish. As long as AVAX does not reclaim the $81.50 area, the trend seems to still be bearish.
Current AVAX pattern
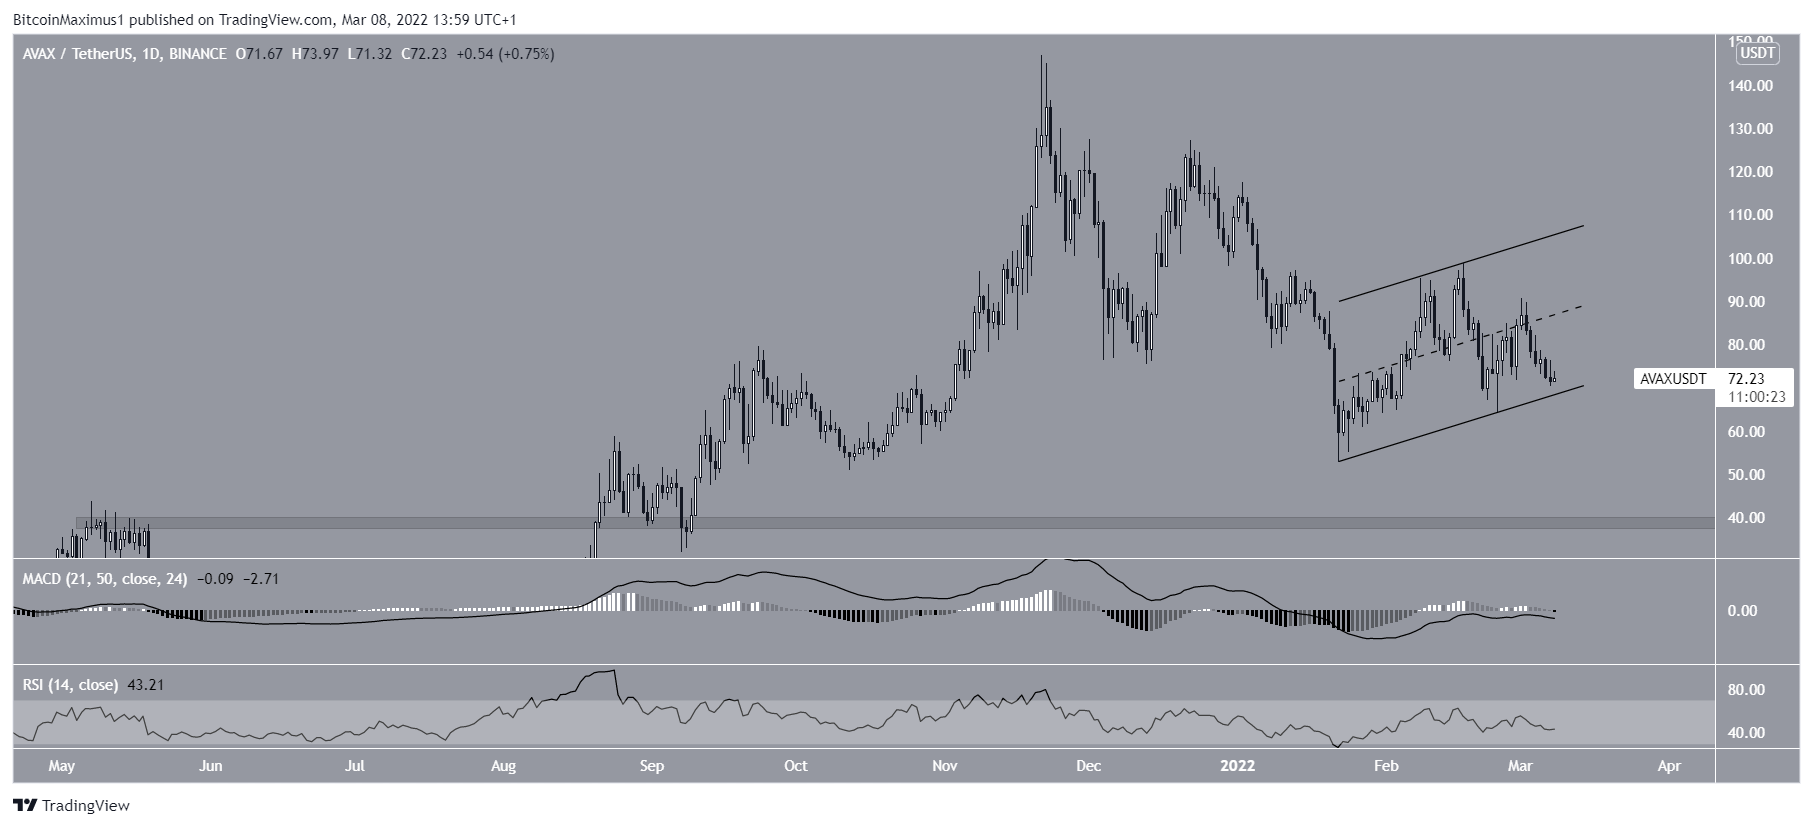
The daily chart shows that AVAX has been trading inside an ascending parallel channel since bouncing on Jan 22. Such channels are considered corrective patterns, meaning that a breakdown from it would be the most likely scenario. Currently, AVAX is very close to its support line.
In addition to this, technical indicators are bearish. The MACD, which is created by a short- and a long-term moving average (MA), is decreasing and is negative. This means that the short-term MA is slower than the long-term one. It often occurs during bearish trends.
Similarly, the RSI, which is a momentum indicator, is decreasing and is below 50. This is a sign of bearish momentum.
If a breakdown from this pattern occurs, the next closest support area would be at $38.
Short-term bounce
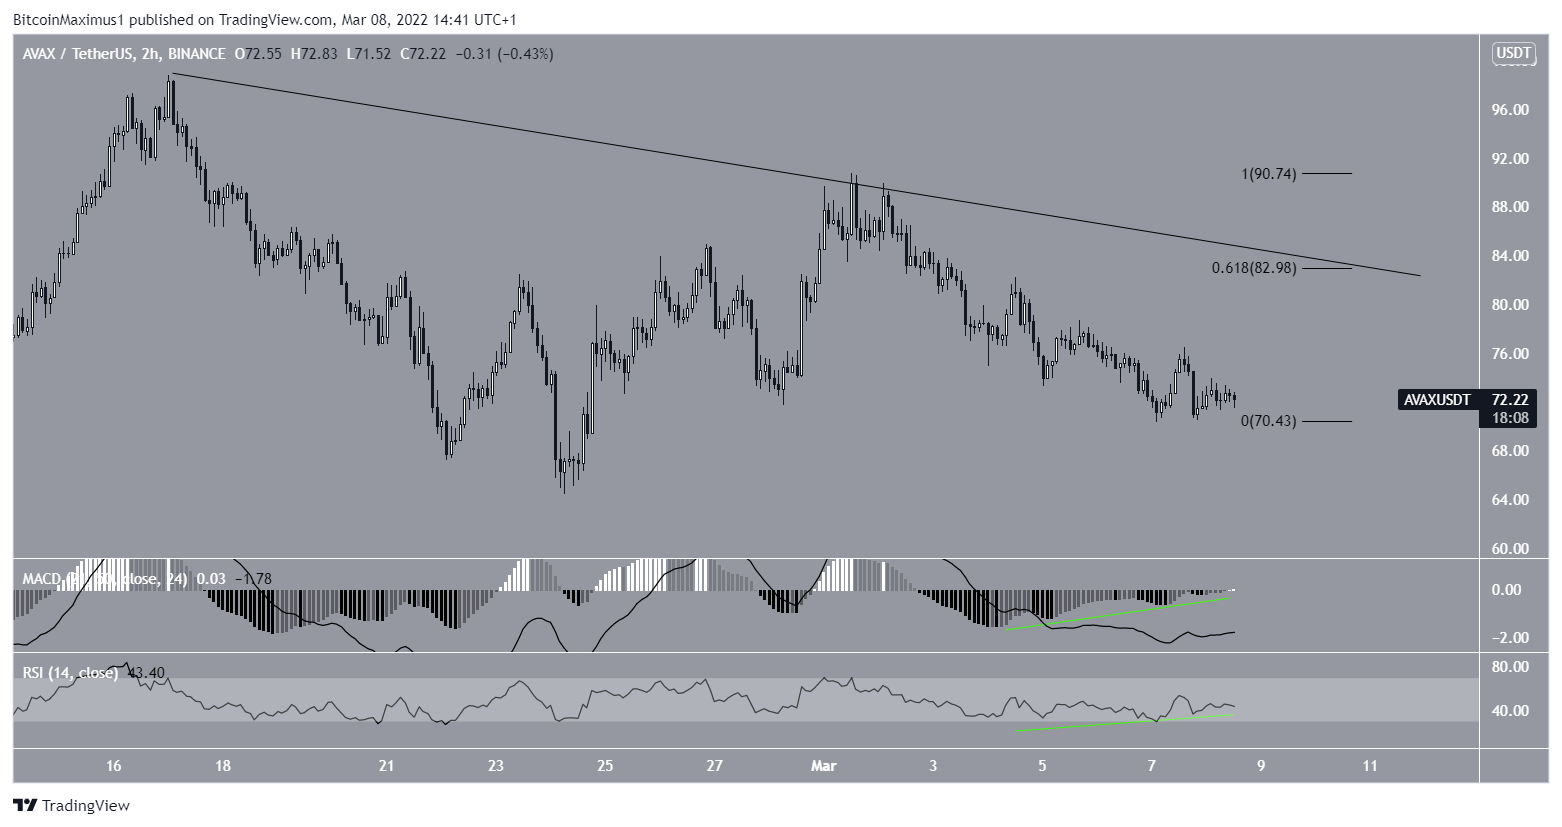
Despite the bearishness from higher time-frames, the two-hour AVAX chart indicates that a short-term bounce is likely. The reason for this comes from the bullish divergences (green lines) in both the RSI and MACD.
This bounce could potentially take the price all the way to $83. This is the 0.618 Fib retracement resistance level and coincides with a descending resistance line which has been in place since Feb 17.
For BeInCrypto’s latest Bitcoin (BTC) analysis, click here


