
At the beginning of June, the Augur (REP) price broke out from a descending resistance line that had been in place for almost 900 days.
The price followed that up with a breakout above a significant resistance area. While it seems that REP has begun an upward trend, a short-term retracement could occur before the price resumes moving upwards.
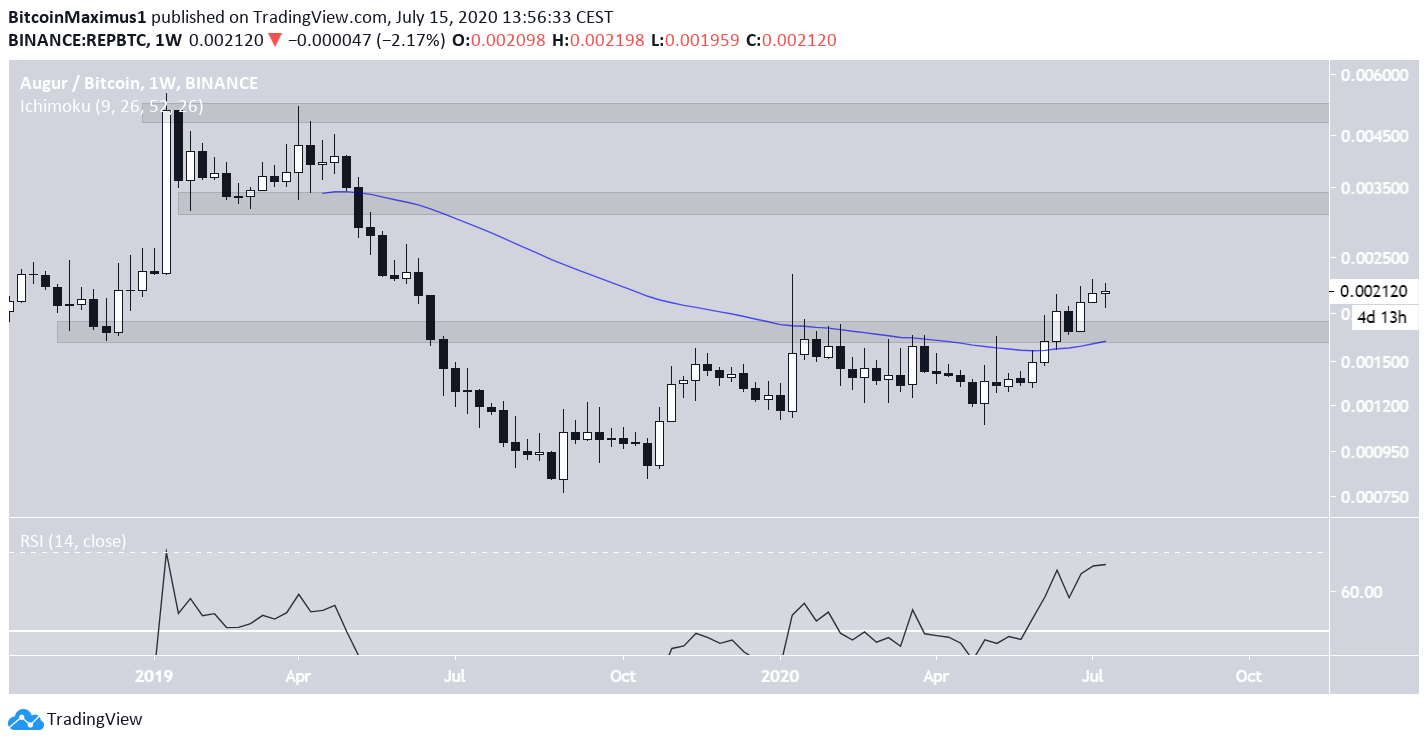
Weekly Outlook
The weekly chart shows that REP has broken out from a major resistance level at ₿0.0017. In doing so, the price has moved above the 50-week moving average (MA), which previously provided resistance to the price. Furthermore, the weekly RSI has crossed above 50, a sign that the trend is bullish.
If the price continues rising, the next resistance areas are found at ₿0.00325 and ₿0.005.
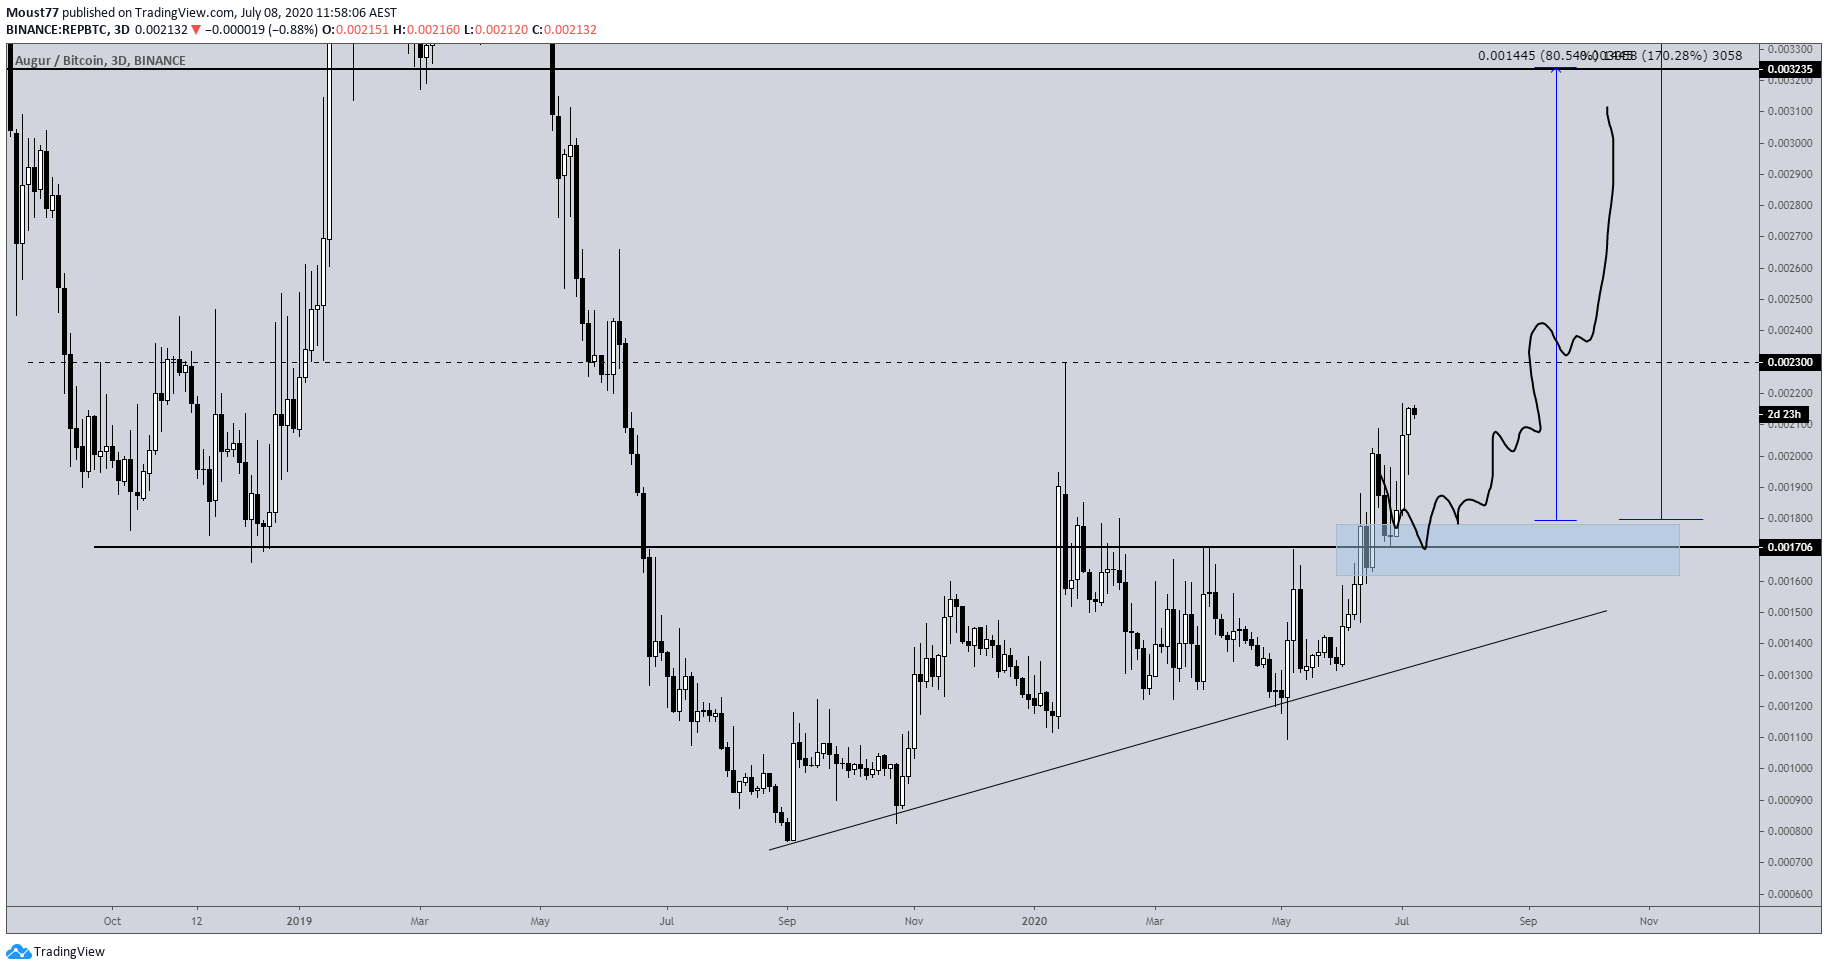
Cryptocurrency trader @BillGK_Crypto outlined a REP chart, in which the price will continue rising until it reaches a high of ₿0.00325. This fits with our resistance area, so it’s a valid target.
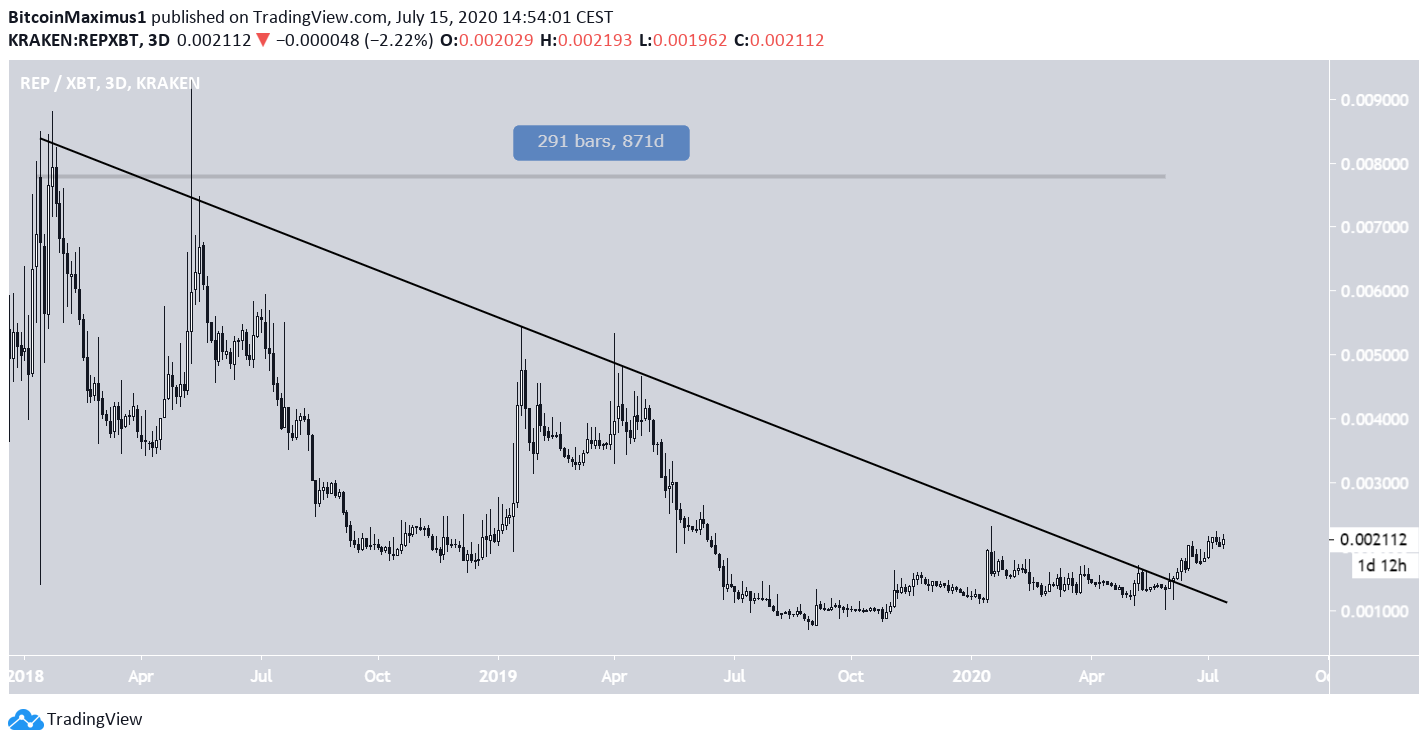
REP’s Long-Term Resistance
The possibility of a continued upward move is supported by looking at REP’s price action since January 2018. At the beginning of June, 2020, the price broke out from a descending resistance line that had been in place for 871 days.
A breakout from such a long-term resistance line indicates that the price should begin a new bullish trend, confirming the findings from the previous section.
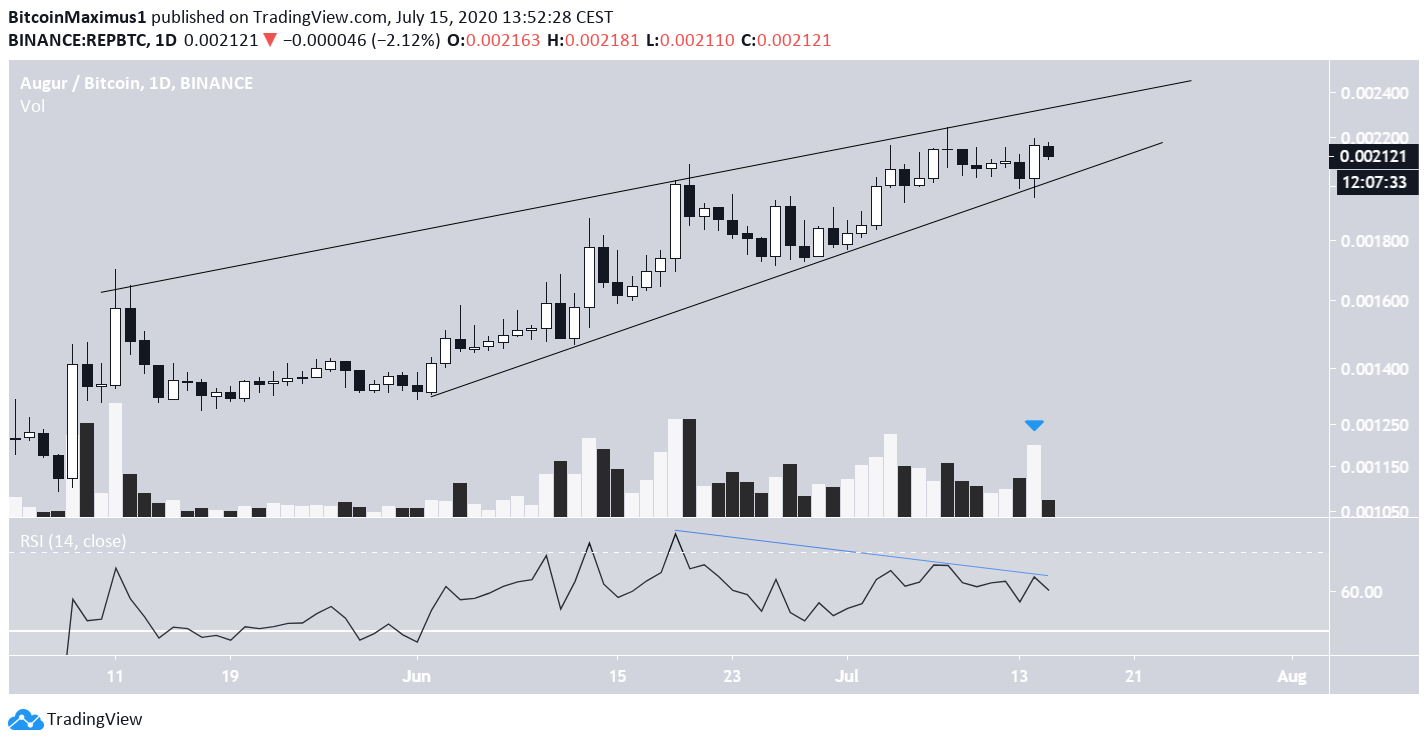
Ascending Wedge
However, the daily chart shows a rising wedge, which is a bearish reversal pattern. Furthermore, there is bearish divergence on the daily RSI, indicating that the price should break down. If it does, it could return to validate the previously mentioned support area at ₿0.0017, and the 50-week MA.
However, the most recent bullish engulfing candlestick occurred on above-average volume, so the price could initiate another upward move towards the resistance line of the wedge before eventually breaking down.
To conclude, while the REP price has likely begun a bullish trend, the price should decline in the short-term before resuming its upward momentum.
