
The Cosmos (ATOM) price has been consolidating since reaching an all-time high price on Feb. 16.
ATOM is expected to break out from the current pattern. Afterwards, it could increase towards $33.
Potential breakout
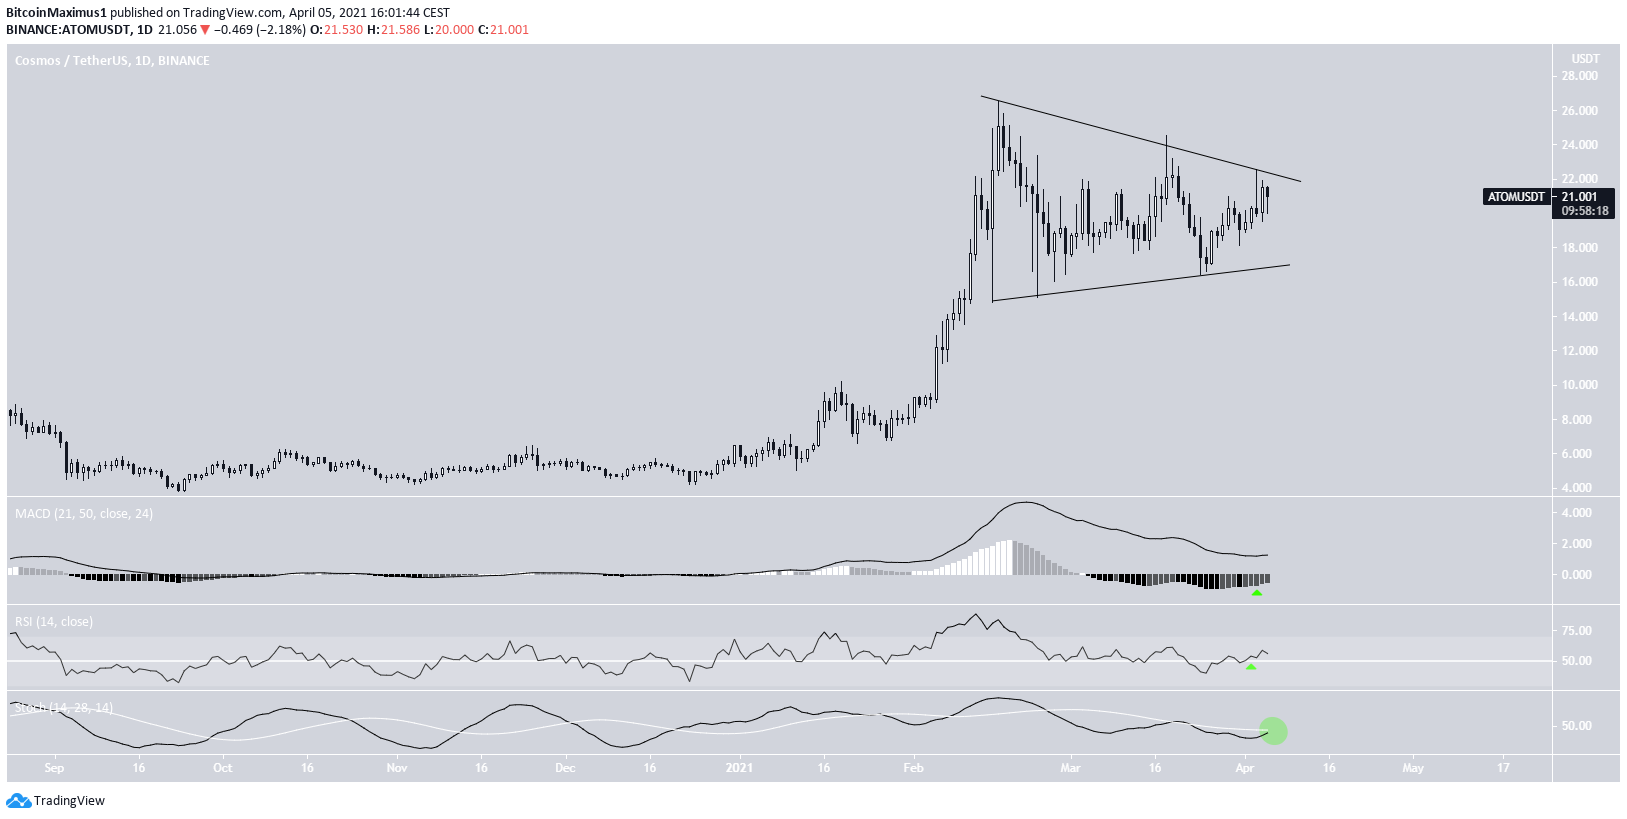
ATOM has been trading inside a symmetrical triangle, since reaching an all-time high (ATH) price on Feb. 16.
While this is considered a neutral pattern, it is coming after an upward movement. Therefore, a breakout would be more likely. In addition, technical indicators in the daily time-frame are bullish.
The MACD has given a bullish reversal signal. The RSI has moved above 50.
When combined with the fact that the triangle is transpiring after an upward move, it makes a breakout the most likely option.
Wave count for ATOM
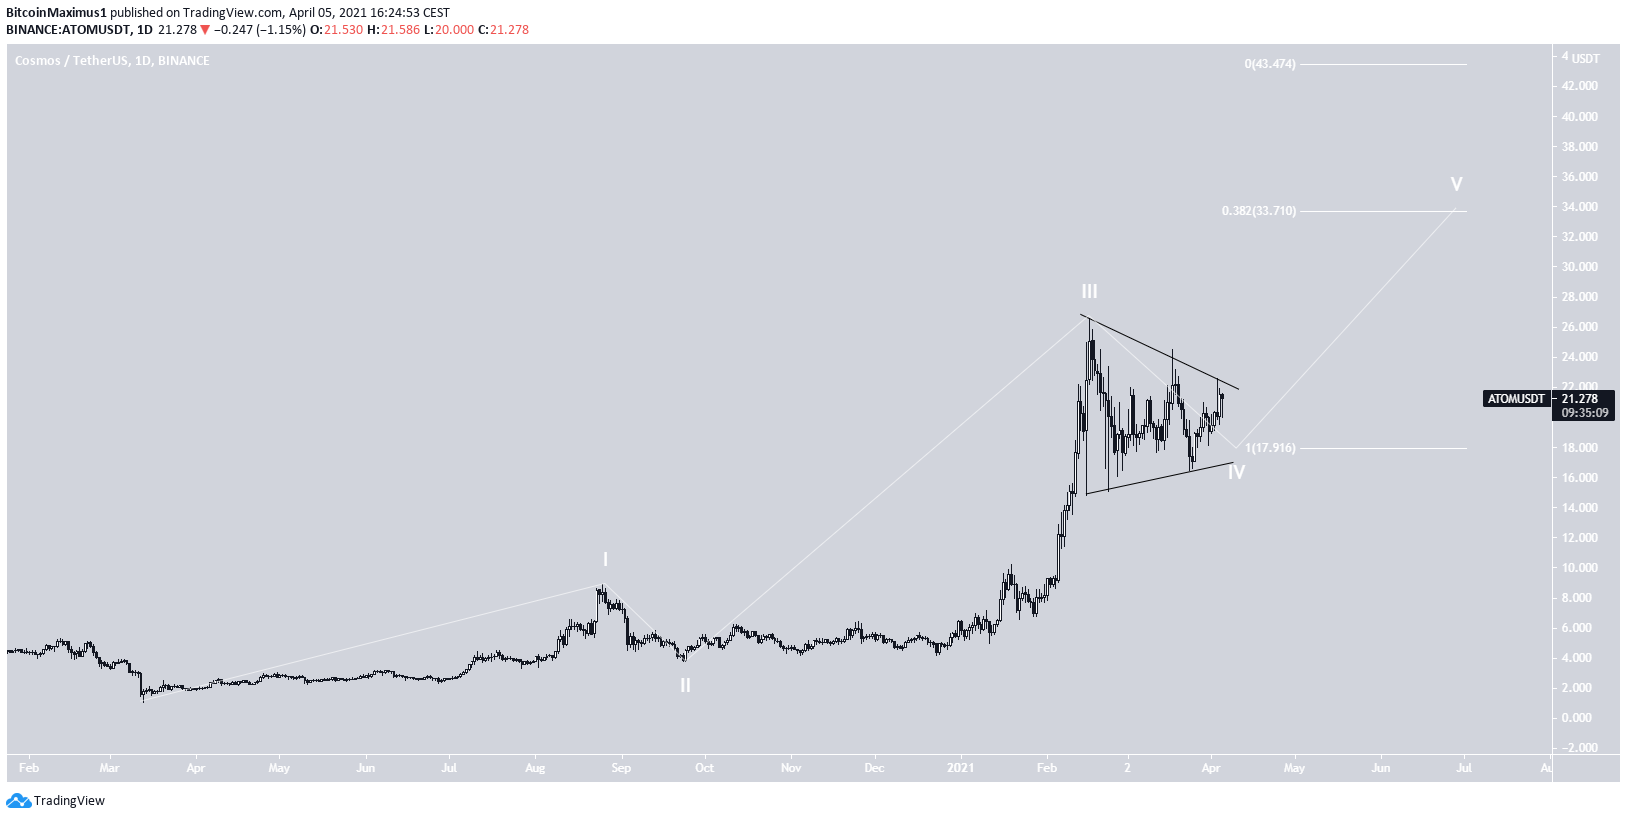
Cryptocurrency trader @Mesawine1 outlined an ATOM chart, stating that the ensuing breakout could take it above $30.
A look at the potential wave count indicates that the current symmetrical triangle is likely to be wave four (white).
While the exact target cannot be determined until wave four has completed, the two most likely levels for the top of the move are found at $33.7 and $43.4.
ATOM/BTC
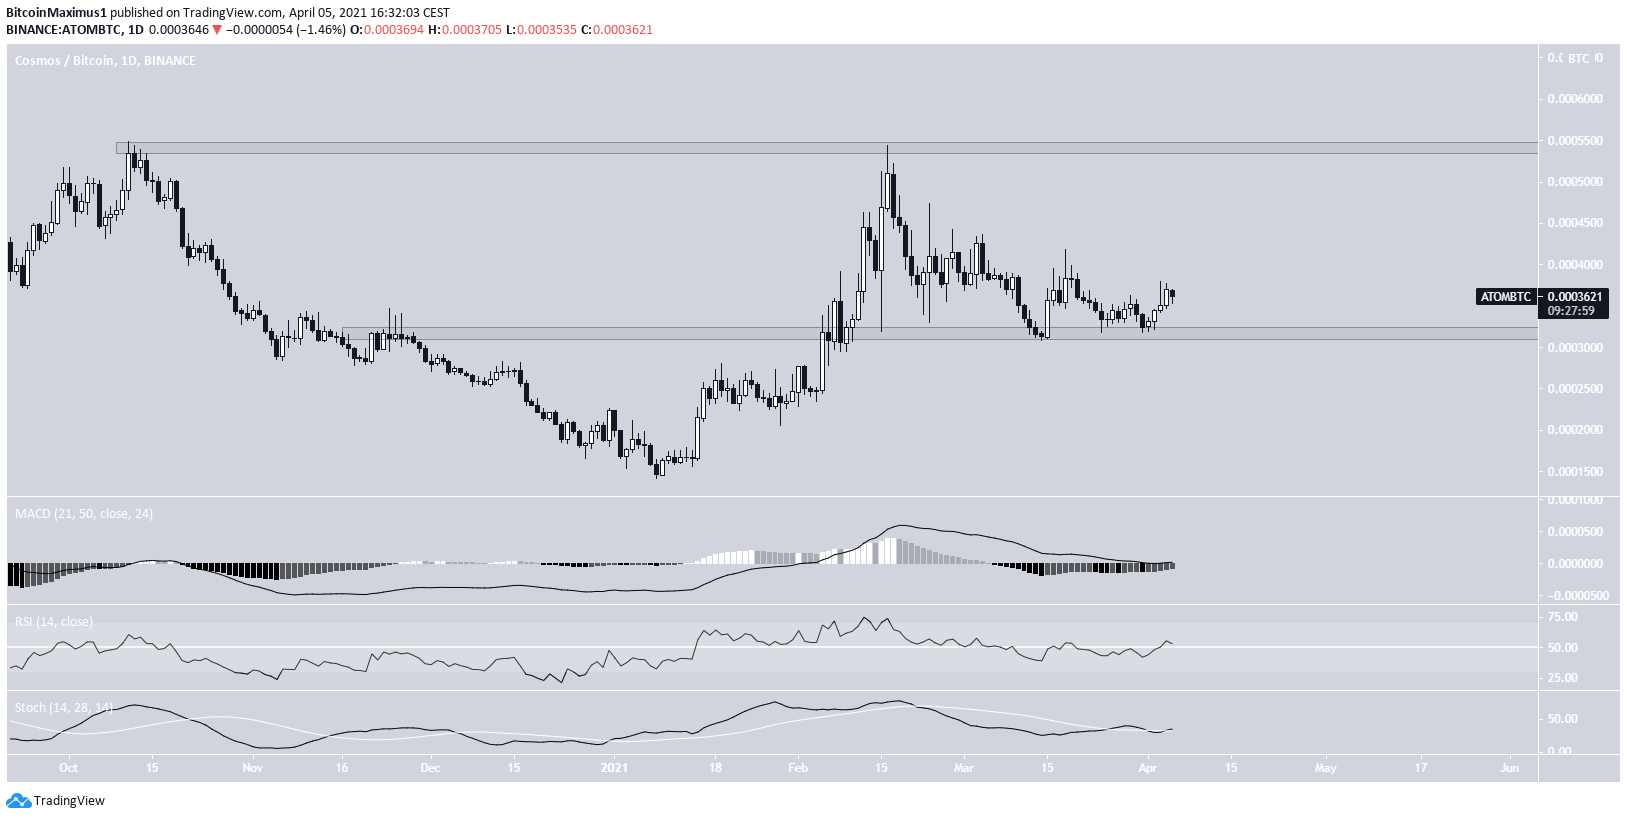
Similar to the USD pair, ATOM/BTC also reached a high on Feb. 16, before it was rejected.
The ensuing decrease has taken it to the 31,500 satoshi support area, where the token created a double bottom pattern.
Technical indicators are bullish, suggesting that ATOM is likely to move upwards. If so, it would be expected to increase towards the closest resistance at 54,500 satoshis.
A breakout above this level would likely be the catalyst for a parabolic upward movement.
Conclusion
To conclude, ATOM/USD is expected to break out from the current pattern and move towards a new all-time high.
ATOM/BTC is expected to increase towards the closest resistance area at 54,500 satoshis.
For BeInCrypto’s latest bitcoin (BTC) analysis, click here.
