


The Cosmos (ATOM) price has bounced at the $3.90 support area and begun moving upwards. While the price should continue increasing in the short/medium-term, the direction of the longer-term trend is unclear.
Long-Term Support
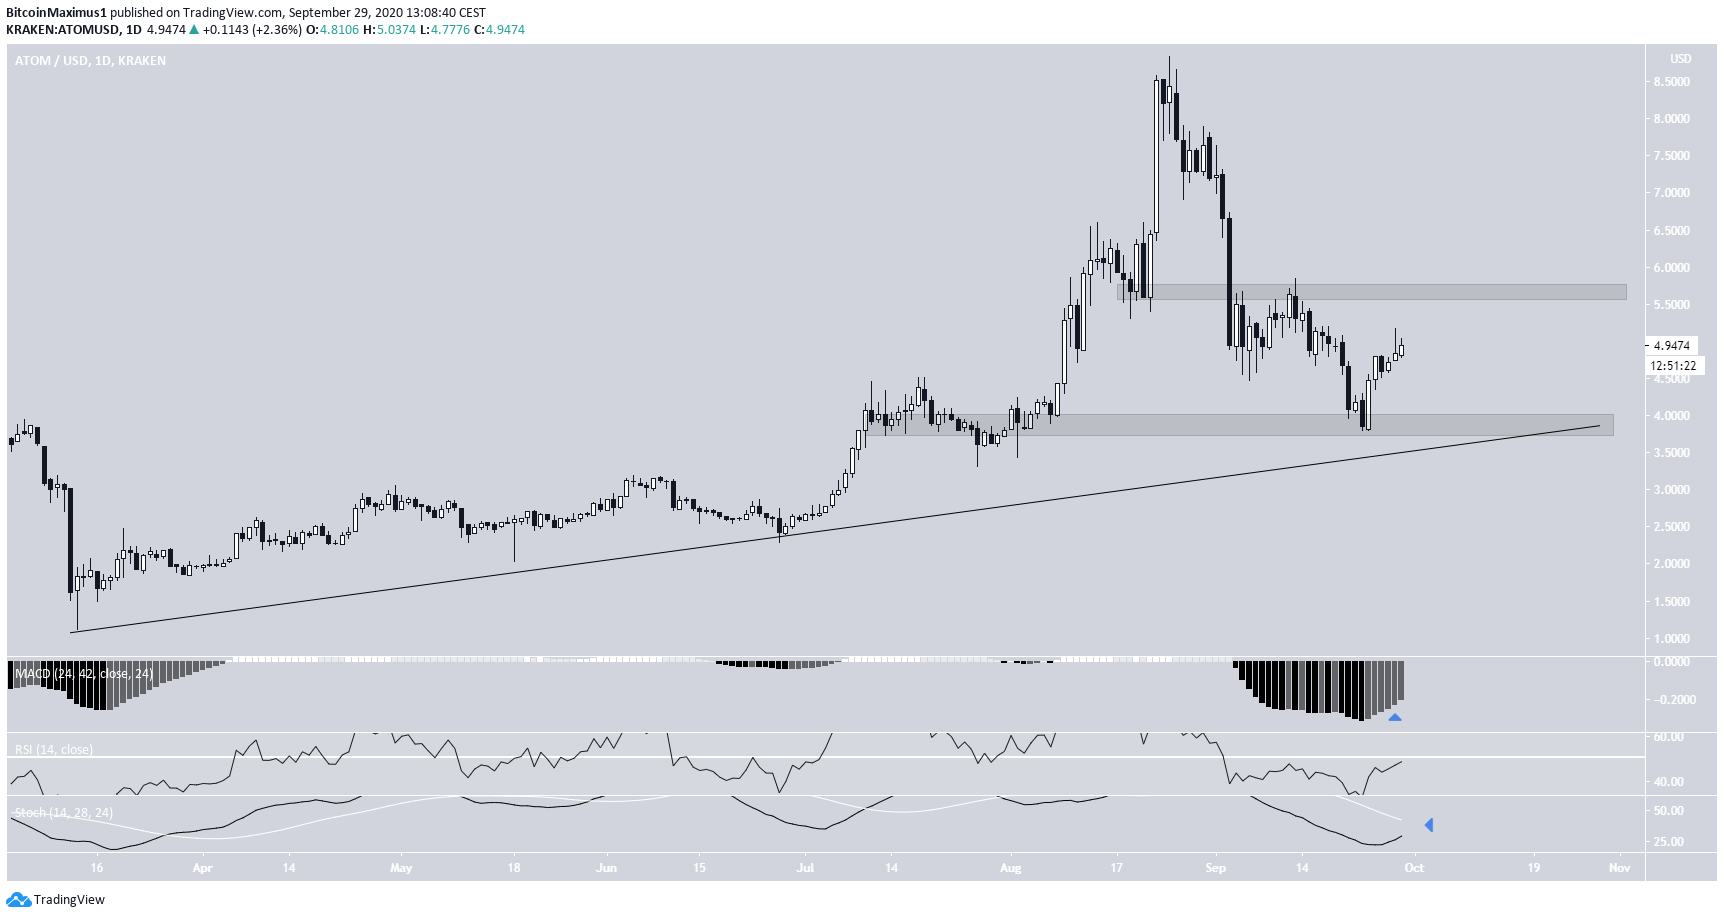
On Aug 25, the ATOM price reached a high of $8.84 but began a downward move shortly afterward. The decline continued until the price reached a low of $3.80 on Sept 23, and began an upward move that is still ongoing.
Technical indicators are neutral. The MACD is increasing, but the RSI is below 50. The Stochastic Oscillator has begun to turn upwards but has not yet made a bullish cross.
The price is following an ascending support line with the main support and resistance areas found at $3.90 and $5.70.
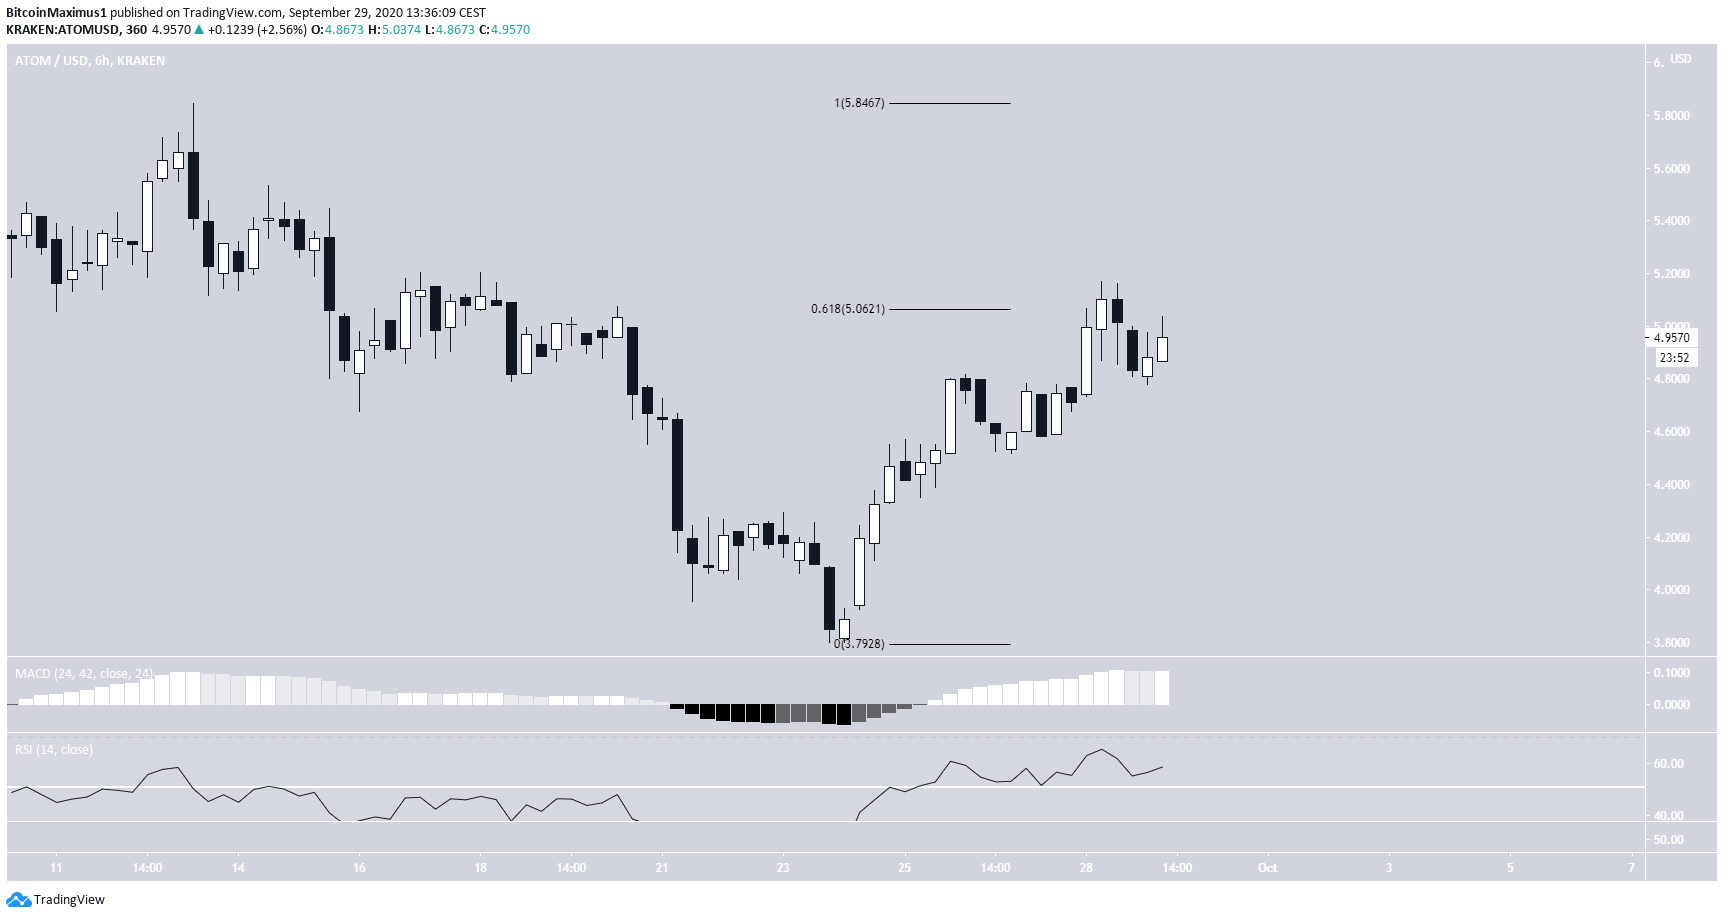
The shorter-term 6-hour chart shows that the price briefly moved above the 0.618 Fib level of the previous decline before falling back below.
However, there is no weakness on the RSI nor MACD yet, making it likely that the price will eventually reach the $5.80 resistance area.
Wave Count
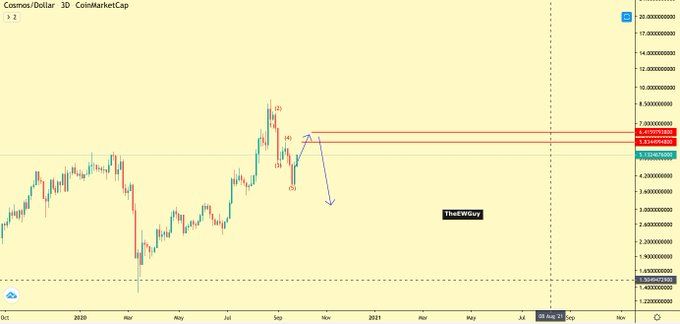
Cryptocurrency trader @TheEWguy outlined an ATOM chart, stating that the price will rally once more before resuming its downward trend.
In the previous analysis, it was stated that:
the price could fall all the way to $3.60.
The price reached a low of $3.80 on Sept 21 and began the current upward move. However, due to the fact that the decrease from Aug 21 measures five waves (in blue below), it’s likely that ATOM has begun a bearish impulse, which should take the price towards new lows.
If so, the current rally is corrective and could end near the 0.618 Fib level of the decline at $6.90.
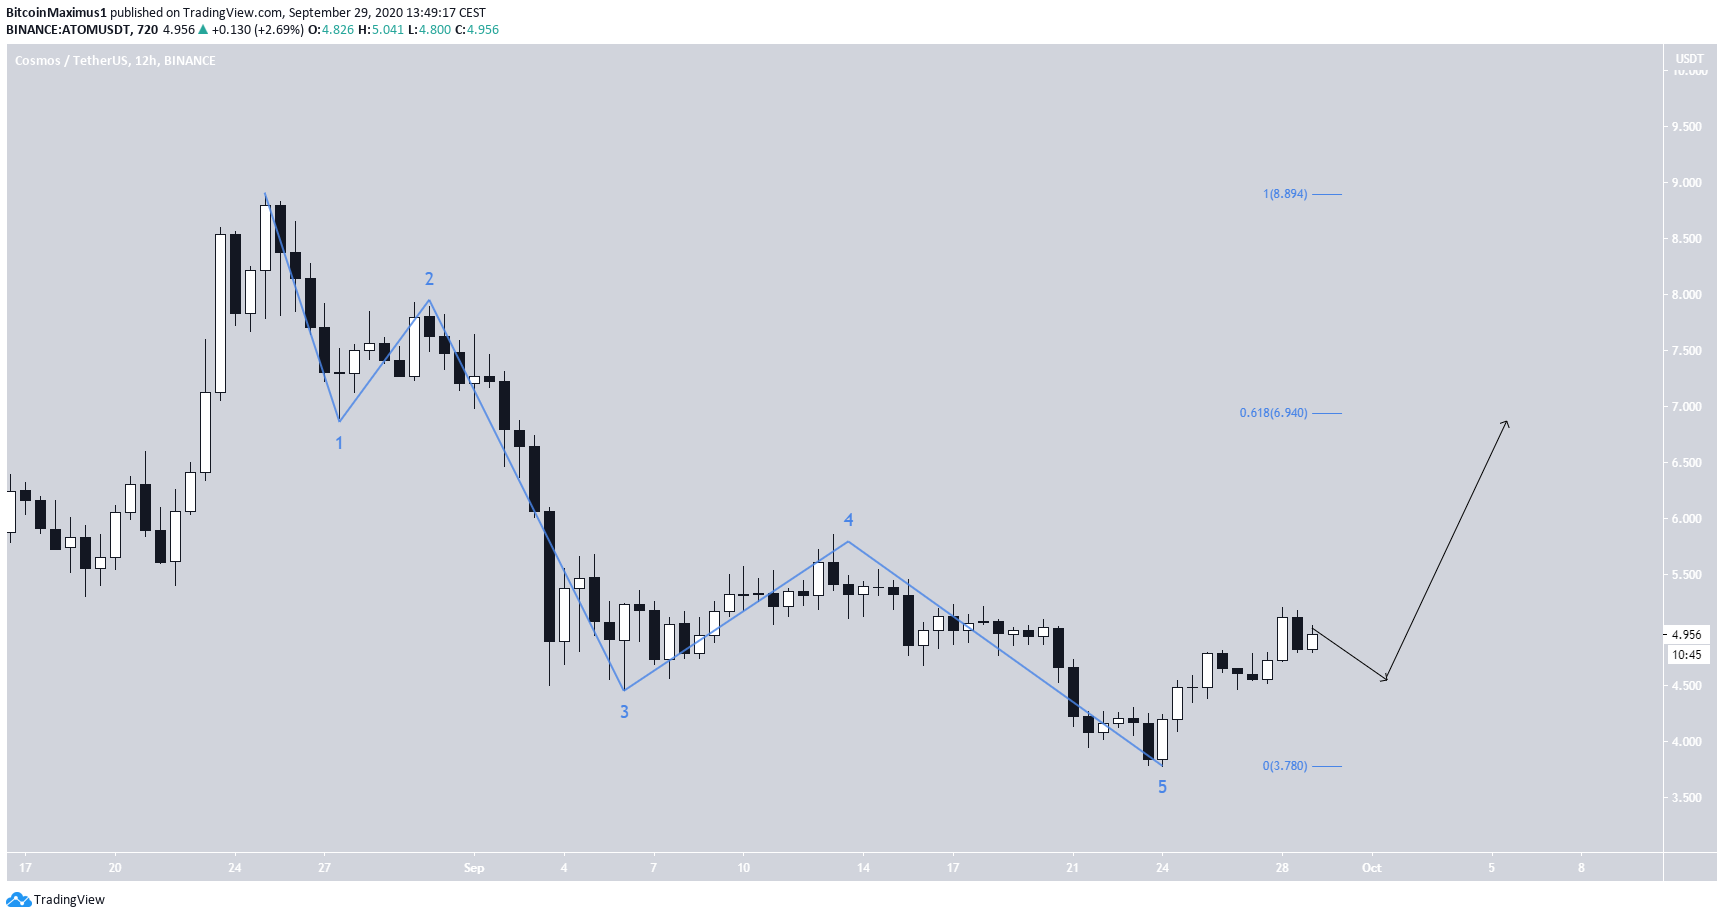
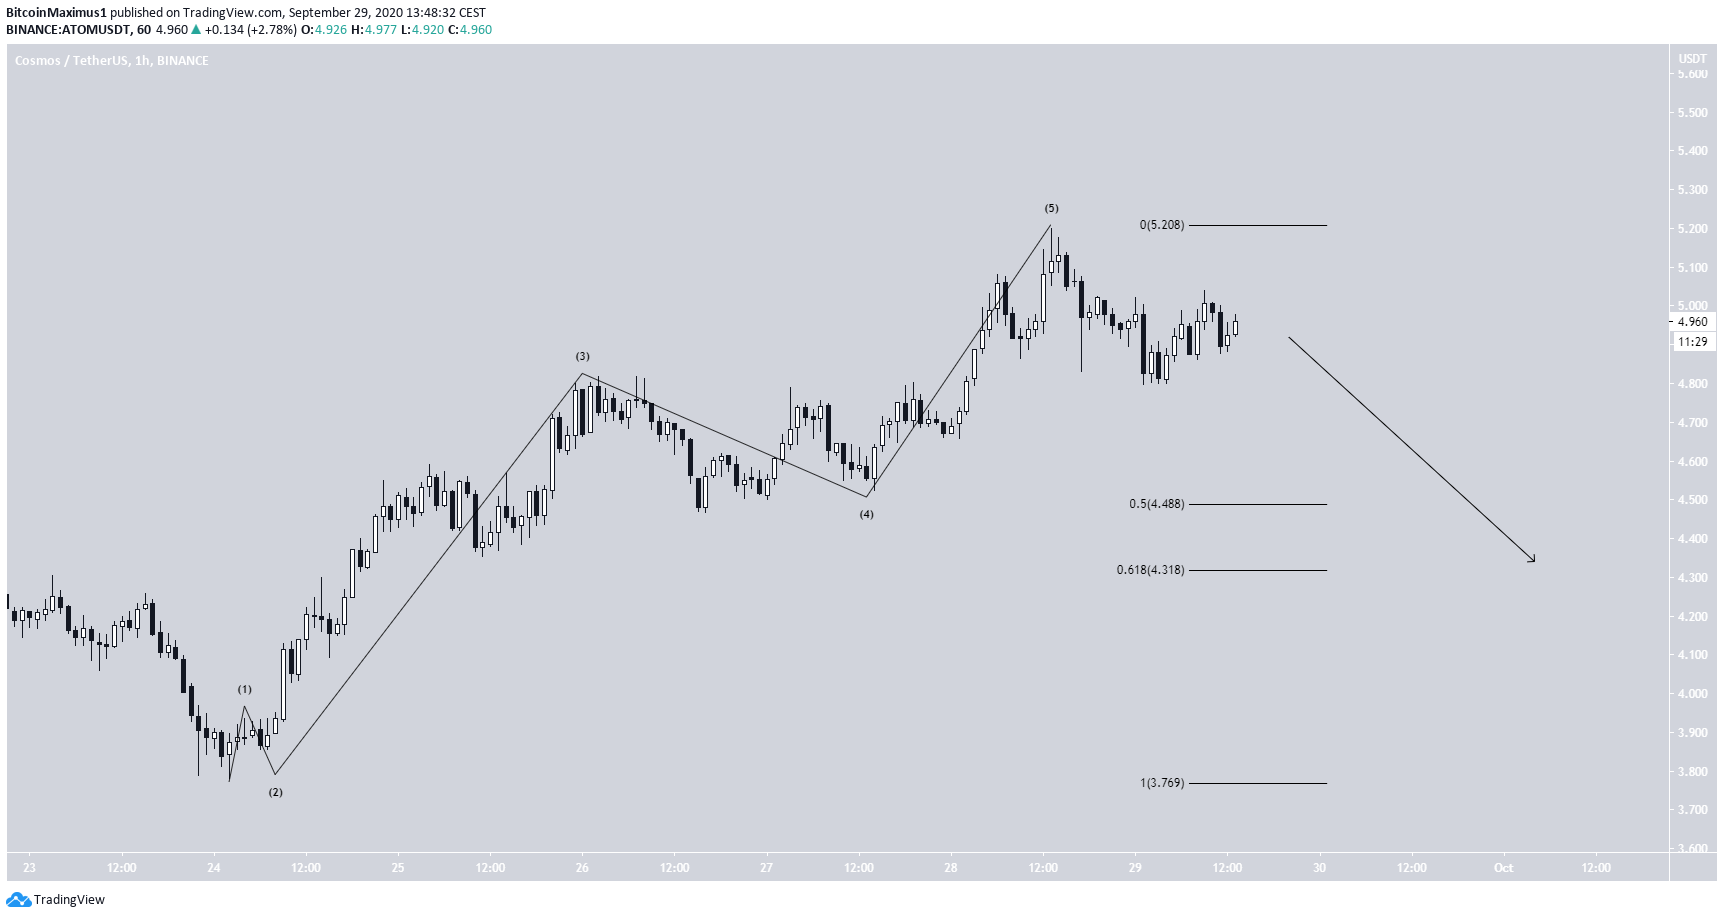
The short-term chart shows a completed five-wave formation, after which a decline is expected.
Therefore, ATOM should fall towards $4.31 – $4.48 before possibly resuming its upward move.
To conclude, while the ATOM price has been increasing since Sept 24, the direction of the longer-term trend is likely to be bearish.
For BeInCrypto’s Bitcoin analysis, click here!


