


The Cosmos (ATOM) price has traded bullish since March and bounced sharply on May 10, increasing the possibility of an eventual breakout.
In order for the bullish structure to remain intact, the ATOM price needs to hold above the current support level and start pushing toward the closest resistance.
Cosmos Price Bounces at Pattern Support
The ATOM price has decreased inside a descending wedge since March 14. The descending wedge is considered a bullish pattern, meaning an eventual breakout is the most likely scenario.
The price action inside the wedge also supports the possibility of a breakout. The price has bounced thrice at the wedge’s support line, creating long lower wicks each time (green icons).
Such wicks are considered signs of buying pressure since sellers were not able to push the price down until the period ended.
The wicks also coincide with the long-term $10.50 horizontal support area, increasing their validity.
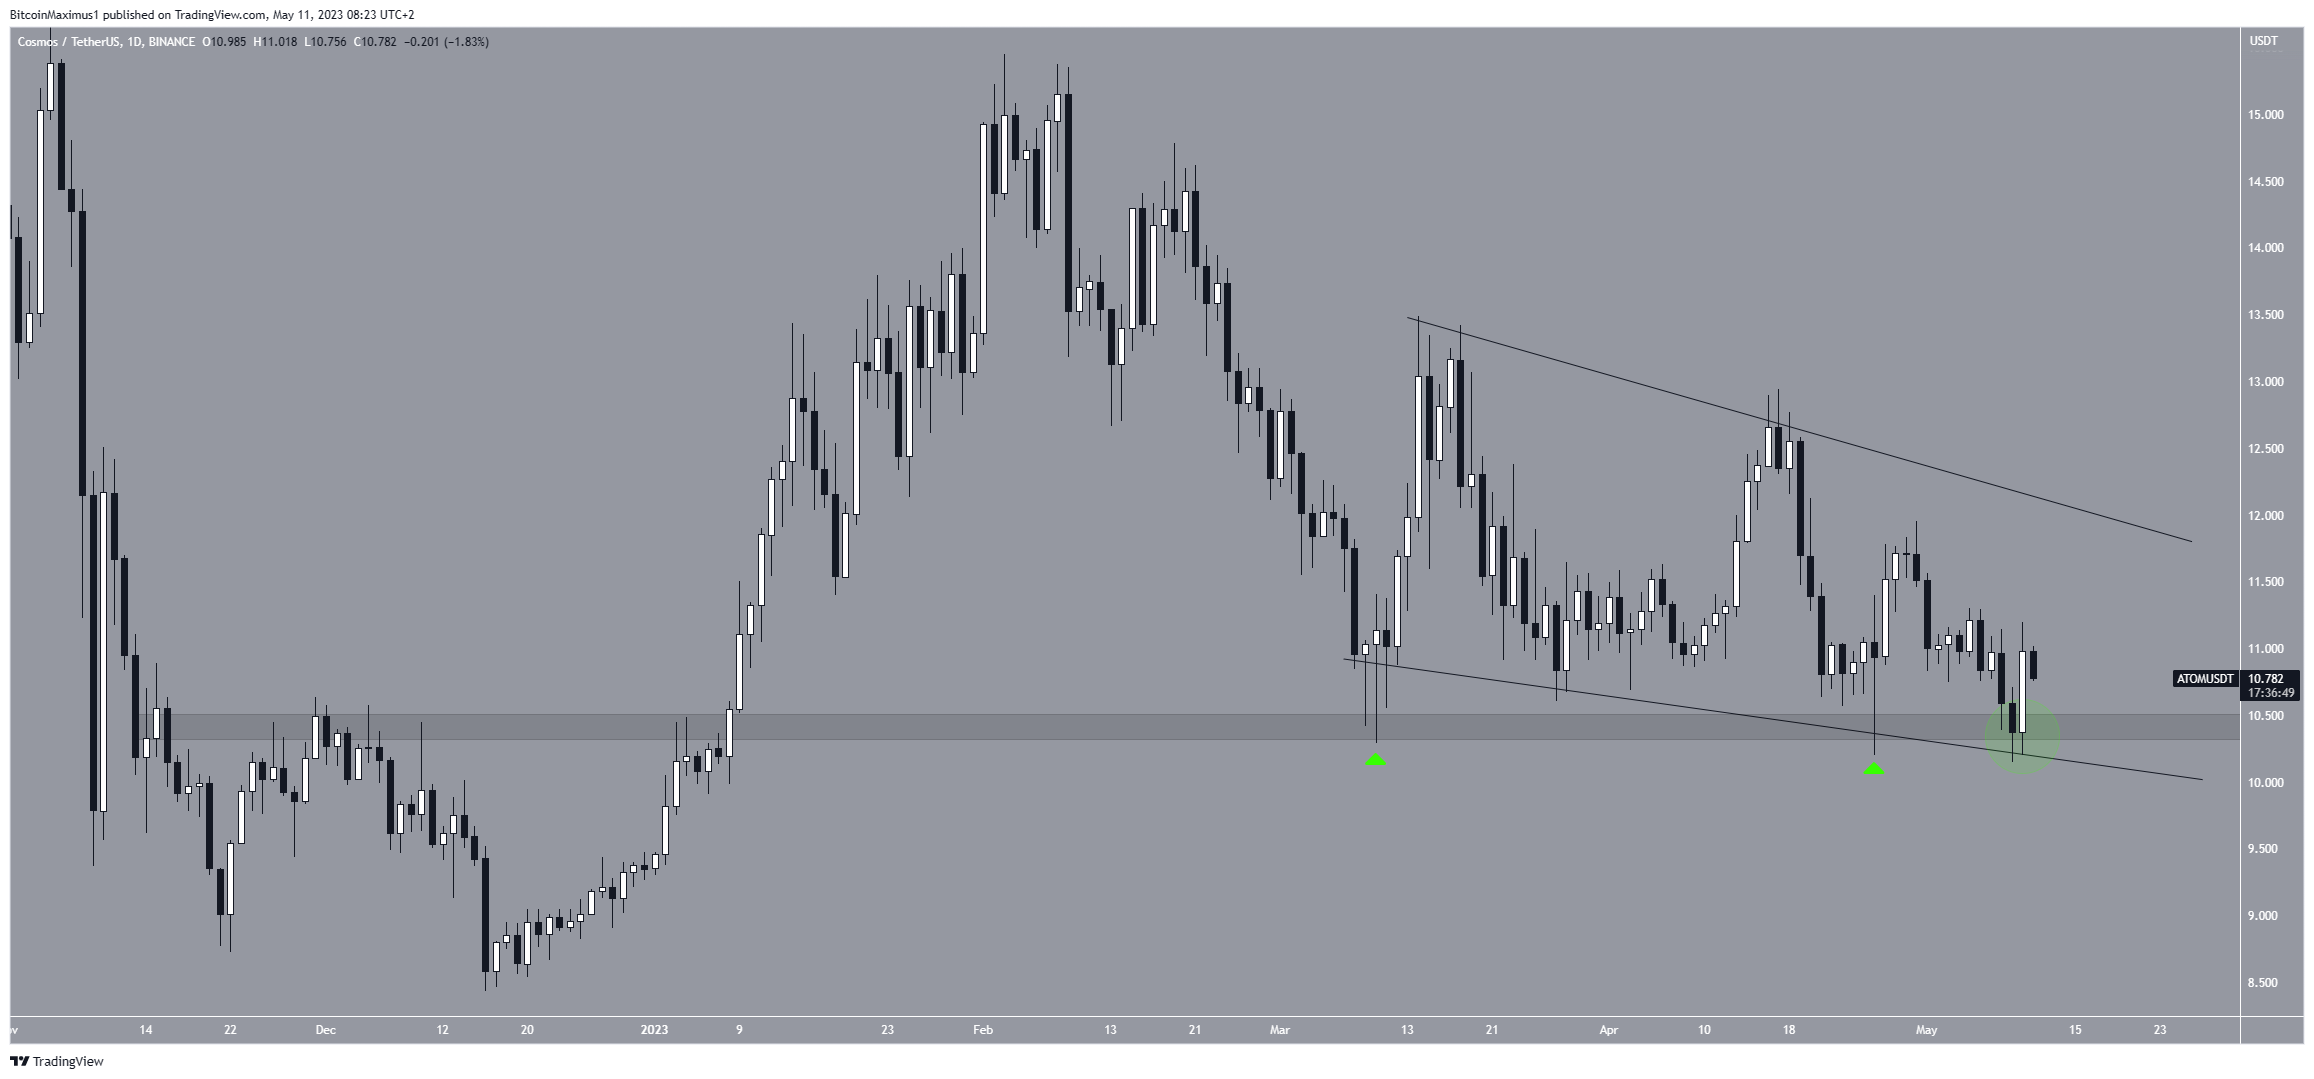
Finally, the price created a bullish engulfing candlestick on May 10 (green circle). This is a type of bullish candlestick in which the entire decrease from the previous period is negated in the next period.
It often leads to sharp upward movements, which would align with the bullish wedge.
ATOM Price Prediction: $14 in Sight
The technical analysis from the short-term six-hour time frame provides a bullish ATOM price prediction. This is due to the positive Relative Strength Index (RSI) readings.
By using the RSI as a momentum indicator, traders can determine whether a market is overbought or oversold and decide whether to accumulate or sell an asset.
If the RSI reading is above 50 and the trend is upward, bulls have an advantage, but if the reading is below 50, the opposite is true.
Even though the RSI is slightly below 50, it is moving upwards and has given two bullish signals. Firstly, the indicator generated a bullish divergence (green line). This is a type of occurrence in which a decrease in momentum does not accompany a price decrease and usually leads to significant bounces.
Secondly, the RSI broke out from a descending resistance line, another sign of a bullish trend.
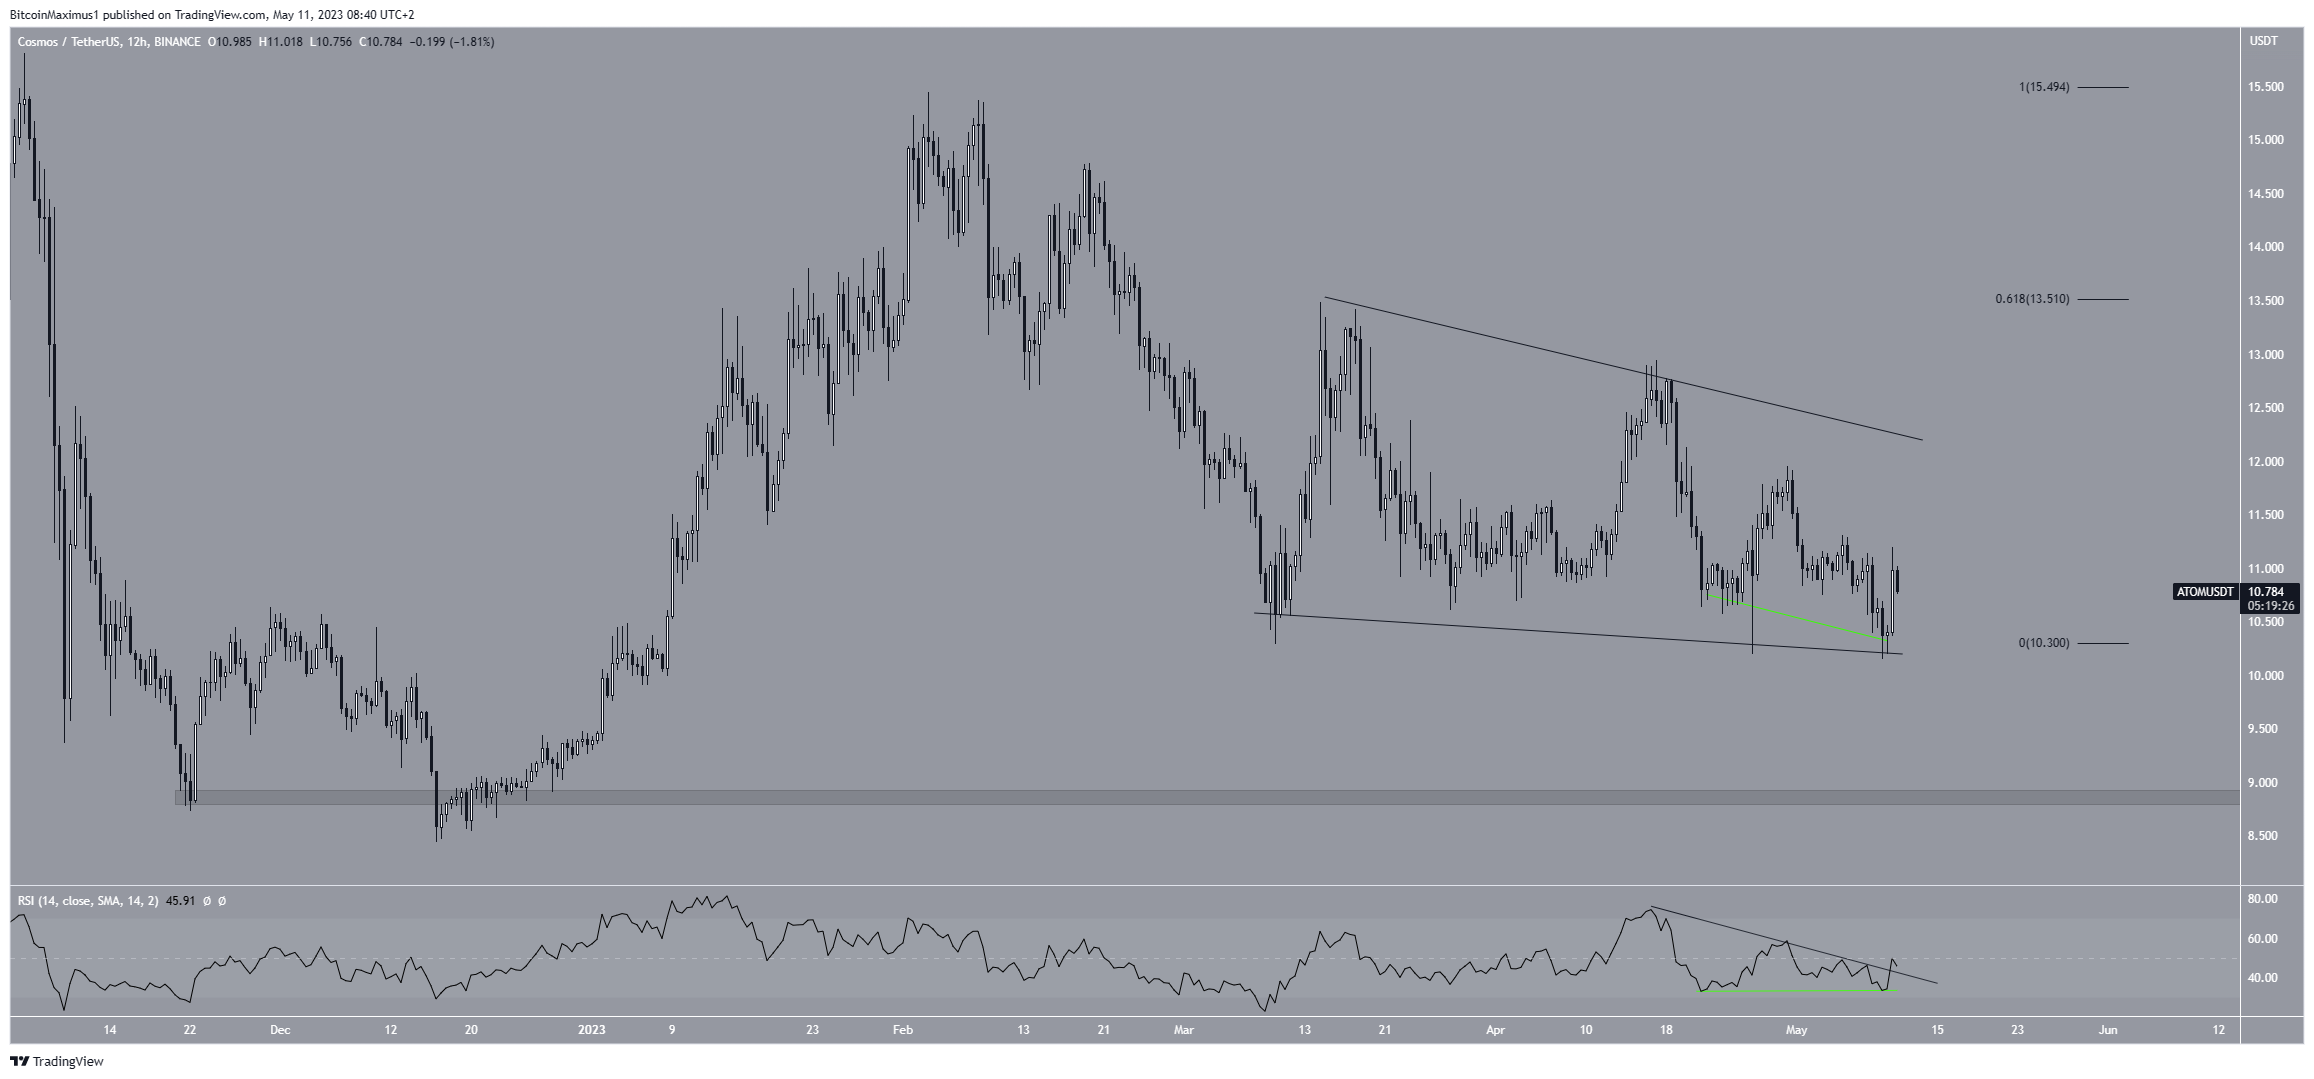
If the ATOM token price breaks out, the next closest resistance will be $13.50. On the other hand, if a breakdown follows, the price could drop toward its yearly lows at an average price of $8.80.
For BeInCrypto’s latest crypto market analysis, click here.


