
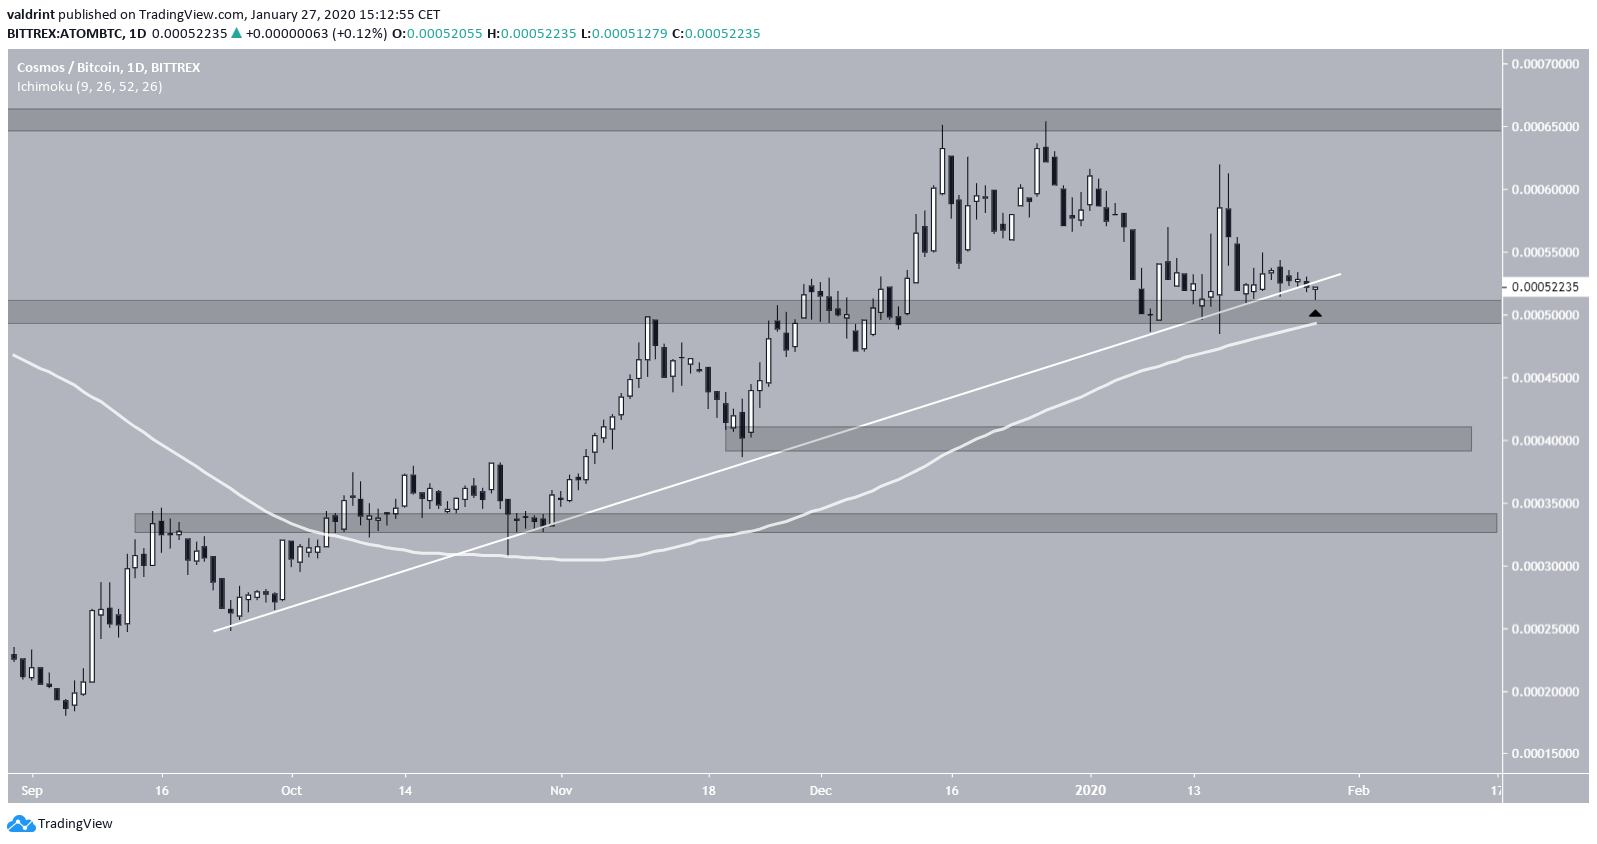
The ATOM price has been following an ascending support line since September 2019. It is currently right at this support line, making this a suitable place to enter the trade in anticipation of higher prices in the future.
ATOM Highlights
- The ATOM price is following an ascending support line.
- There is support at 50k, 40k, and 33k satoshis.
- The price is trading above its 100-day moving average (MA).
Trader and entrepreneur @HeyTaiZen outlined the ATOM price chart stating that the price is in an upward trend. Also, the price has reached the support line of this channel, making this a suitable price level to enter the trade in anticipation of higher prices.
I notice each time @cosmos hits the bottom of the trend channel & it has a "hammer" like candlestick pattern, there is a tendency for it to go up afterwards.
I already have enough $ATOM but if I didn't these are areas where I would buy.
Also notice $ATOM has been on uptrend. pic.twitter.com/3Ls9mAC643
— Tai Zen (@HeyTaiZen) January 26, 2020
Will the ATOM price continue increasing? If so, is the current price level optimal for entering the trade? Keep reading below if you are interested in finding out.
Note: We will use the ATOM/BTC chart instead of the ATOM/USD one since they have very similar movements, and the former is more widely traded.
Ascending Support Line
The ATOM price has been following an ascending support line since September 24, 2019. The price has validated this support line numerous times. While the price is arguably slightly below this support line, it has previously decreased below the support line only to create a long lower wick and begin moving upward.
In addition, the 100-day MA is following this support line very closely, offering support to the price. A price decrease below this support area would be a strong sign that the price has completed its upward movement.
The closest support areas are found at 50,000, 40,000, 33,000 satoshis, while the overhead resistance is seen at 65,000 satoshis.
Possible Trade Setups
Since ATOM does not have a long price history, there is less data to make a prediction. However, we are quite sure that a breakdown below the 200-day MA will take the price towards 40,000 satoshis.
Therefore, as stated in the tweet, this indeed is an optimal level to enter in anticipation of an upward move. Initiating a long trade at the current level with a stop loss below 48,000 satoshis and a target at the top of the range of 65,000 satoshis presents a risk ratio of 4.
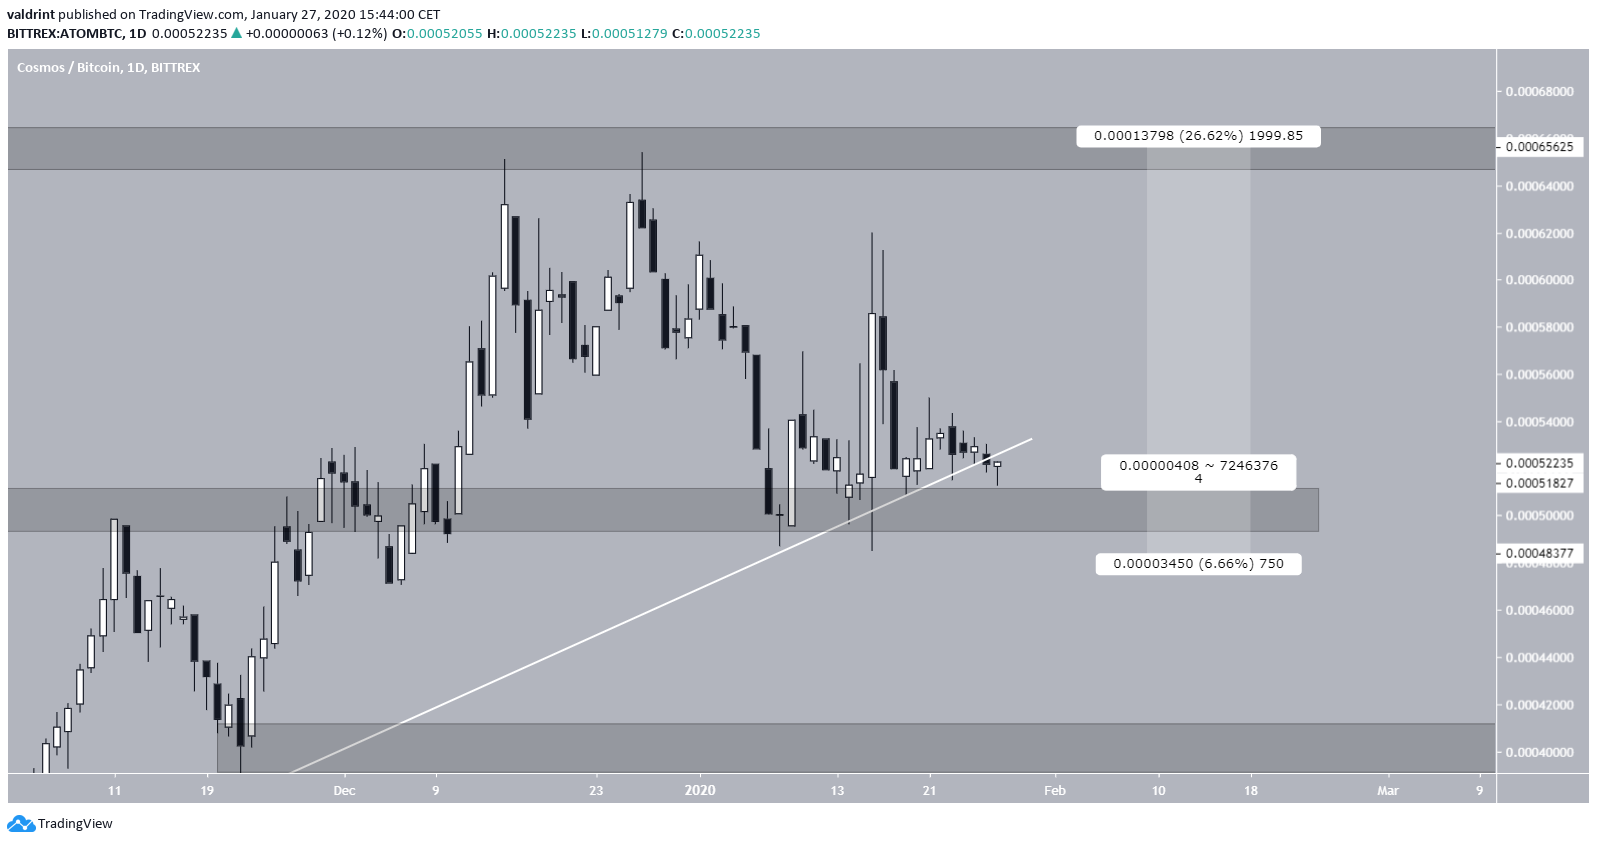
If the price moves above this area, the price could reach 80,000 satoshis. The same trade with a target of 80k sats offers a risk ratio of 8.
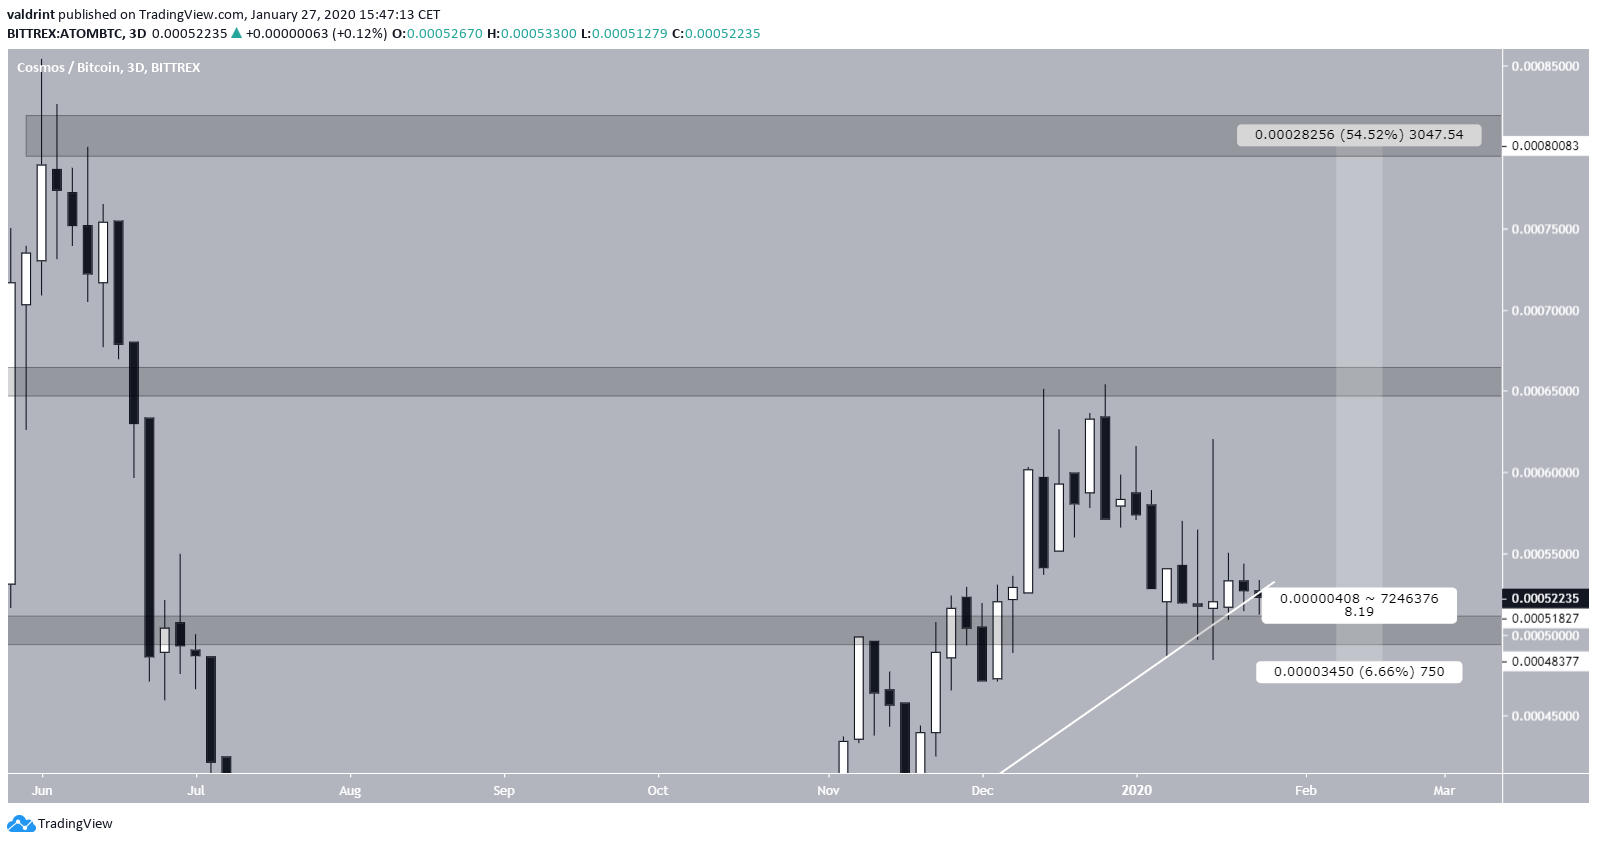
The full table of both trade setups is given below (all values are in satoshis).
To conclude, the ATOM price is following an ascending support line. While we are unsure if it will continue increasing, we think the current price level allows for an enticing trade setup.
