


Cosmos (ATOM) has broken out from a long-term resistance but has created a short-term bearish pattern which could lead to a slight retracement.
ATOM is the native token of the Cosmos Hub, which is the first blockchain launched in the Cosmos ecosystem. While Cosmos is not a layer-1 or layer-2 blockchain, it is a network of sovereign blockchains. Basically, it is designed to be the connector of all app-chains.
Since it would be extremely difficult for a single blockchain to scale in order to meet the demands of all the people in the world, it is likely that there will be numerous blockchains that interact with each other. In this case, Cosmos would be extremely valuable as a connector of these blockchains.
Over the past month, ATOM has been one of the best performers in the cryptocurrency industry, massively outperforming both Ethereum and the decentralized finance (DeFi) sector.
Long-term ATOM resistance
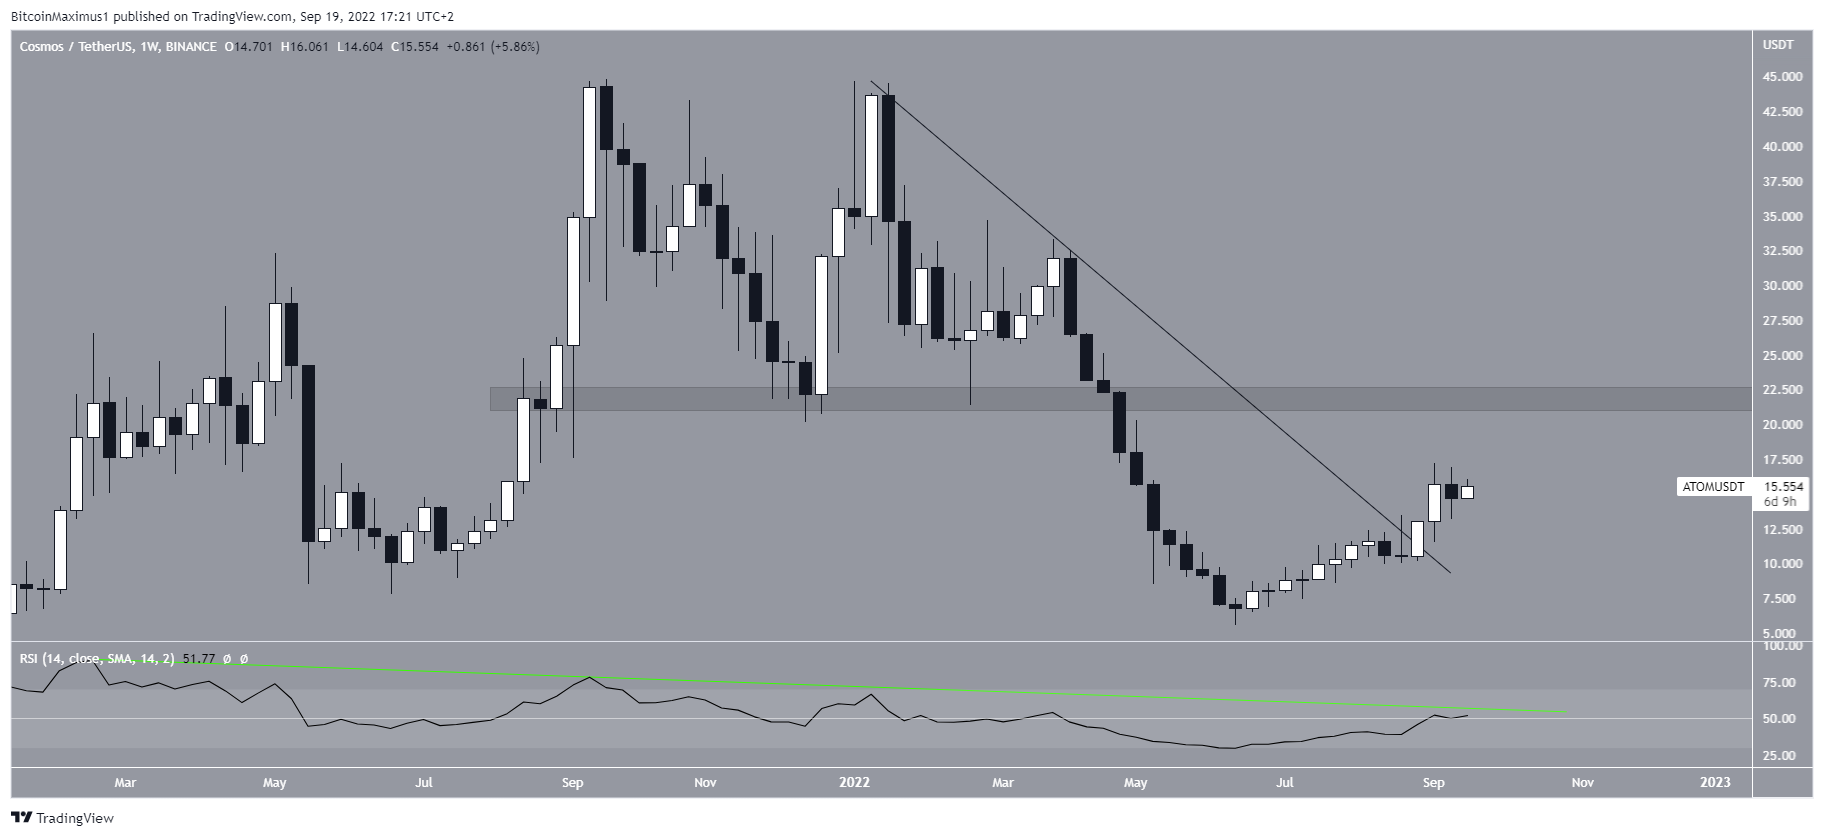
ATOM has been falling underneath a descending resistance line since creating its first lower high in Jan. 2022. The downward movement has led to a low of $5.50 in June 2022.
The price has been increasing since and managed to break out from the line in the final week of August. . . However, despite the breakout, the weekly RSI has yet to break out from its descending trendline (green line) nor has it moved above 50. A breakout would be required in order for the trend to be confirmed as bullish.
If one occurs, the next closest resistance area would be at $22
Double top pattern
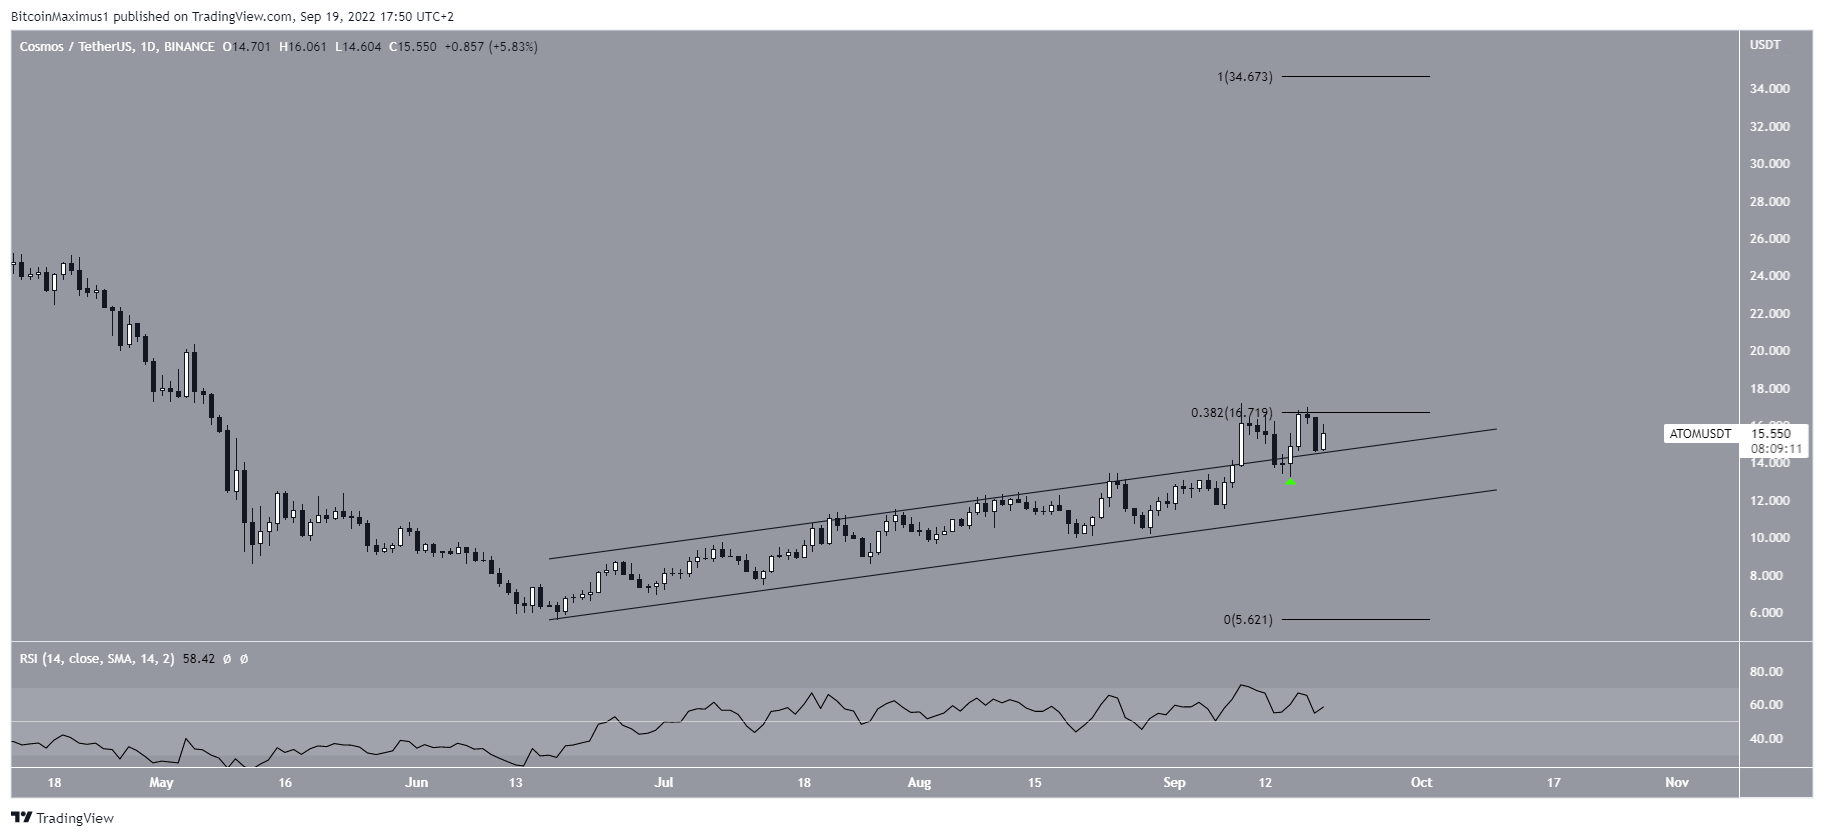
The daily chart shows that the price had been increasing since reaching its aforementioned low on June 18. It broke out from the channel on Sept. 9 and returned to validate it as support six days later (green icon).
The daily RSI supports the legitimacy of the breakout, since it is above 50. Currently, ATOM is attempting to break out from the 0.382 Fib retracement resistance at $16.70. If successful, it is likely to increase towards the previously outlined resistance at $22.
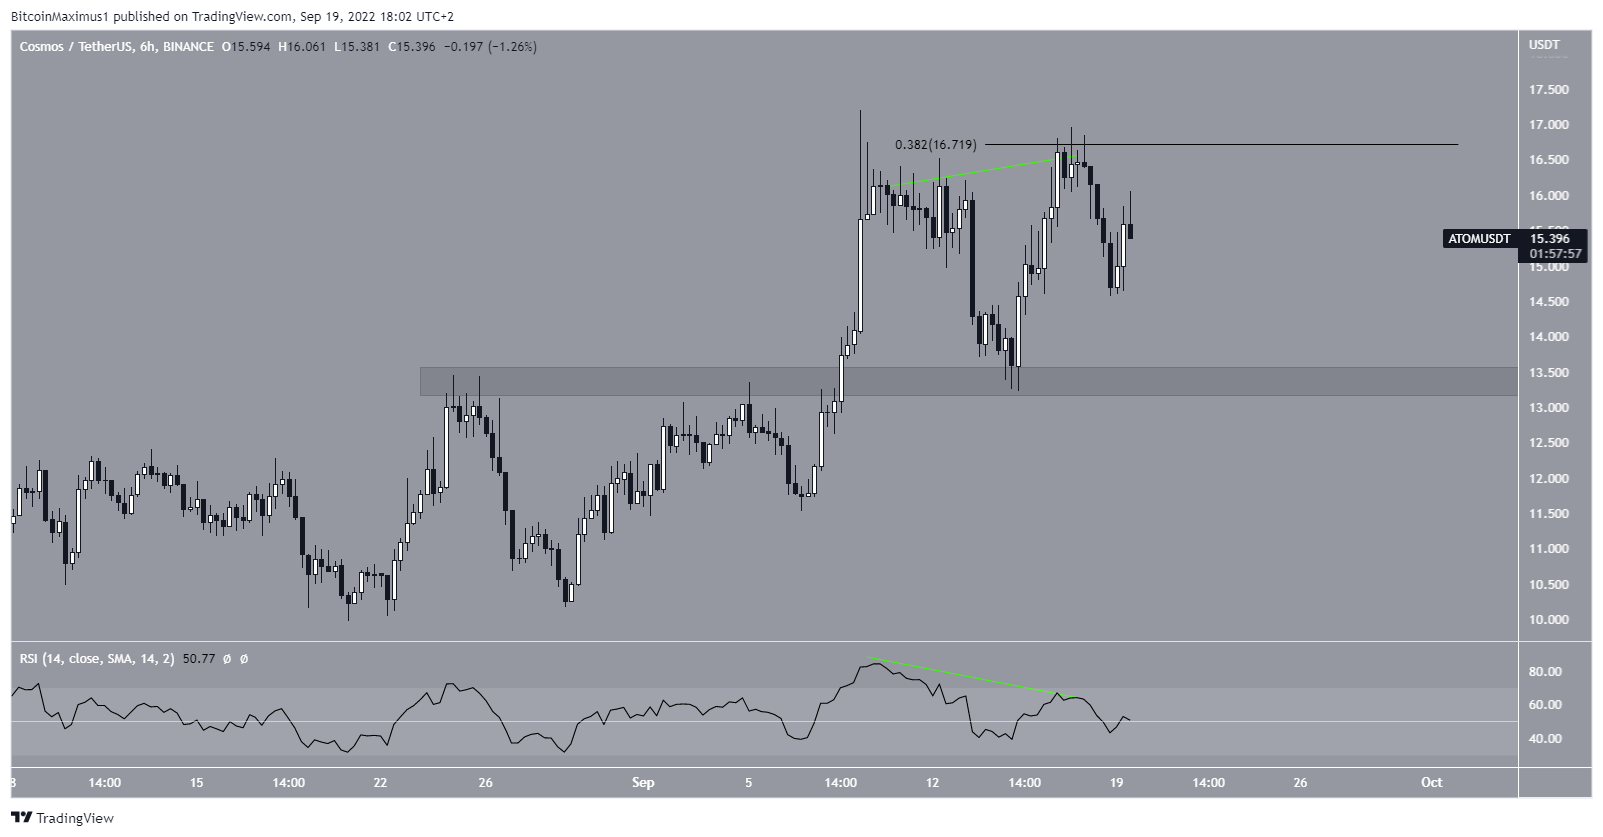
Despite the bullishness from the weekly and daily timeframes, the six-hour chart shows a double top, which is considered a bearish pattern. The double top was also combined with bearish divergence in the RSI (green line).
So, it is possible that a decrease towards the $13.40 area will occur, before the upward movement eventually resumes.
For Be[In]Crypto’s latest Bitcoin (BTC) analysis, click here.


