
Cosmos (ATOM) is increasing at a parabolic rate and is making an attempt at moving above the $26.70 resistance area.
Readings in both high and low time-frames suggest that it will eventually be successful in doing so.
Parabolic rate of increase
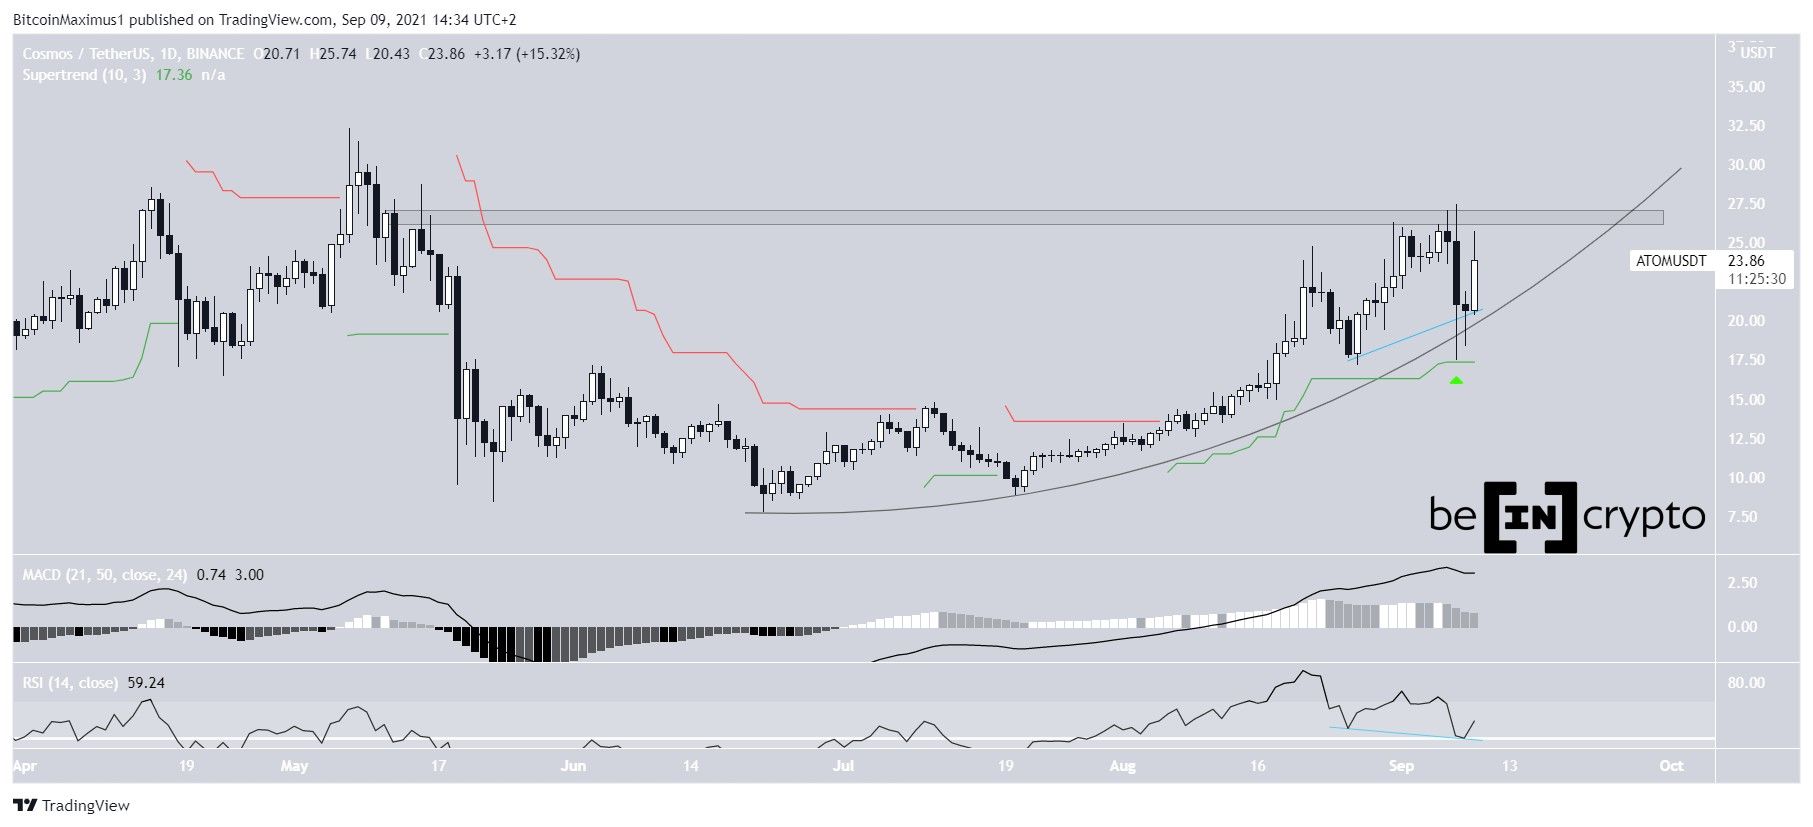
ATOM has been increasing alongside a parabolic ascending support line since June 22. The Sept. 7 drop caused another validation of the support line (green icon), and also a touch of the Supertrend line. The ensuing bounce created a very long lower wick.
Currently, ATOM is facing resistance at $26.70. A breakout above this are would likely take the token towards a new all-time high price.
The MACD and especially RSI both support this increase. While the MACD has begun to decrease, it is still positive. The RSI is still above 50 and has generated hidden bullish divergence, a strong sign of trend continuation.
Therefore, the daily chart suggests that an eventual breakout is likely.
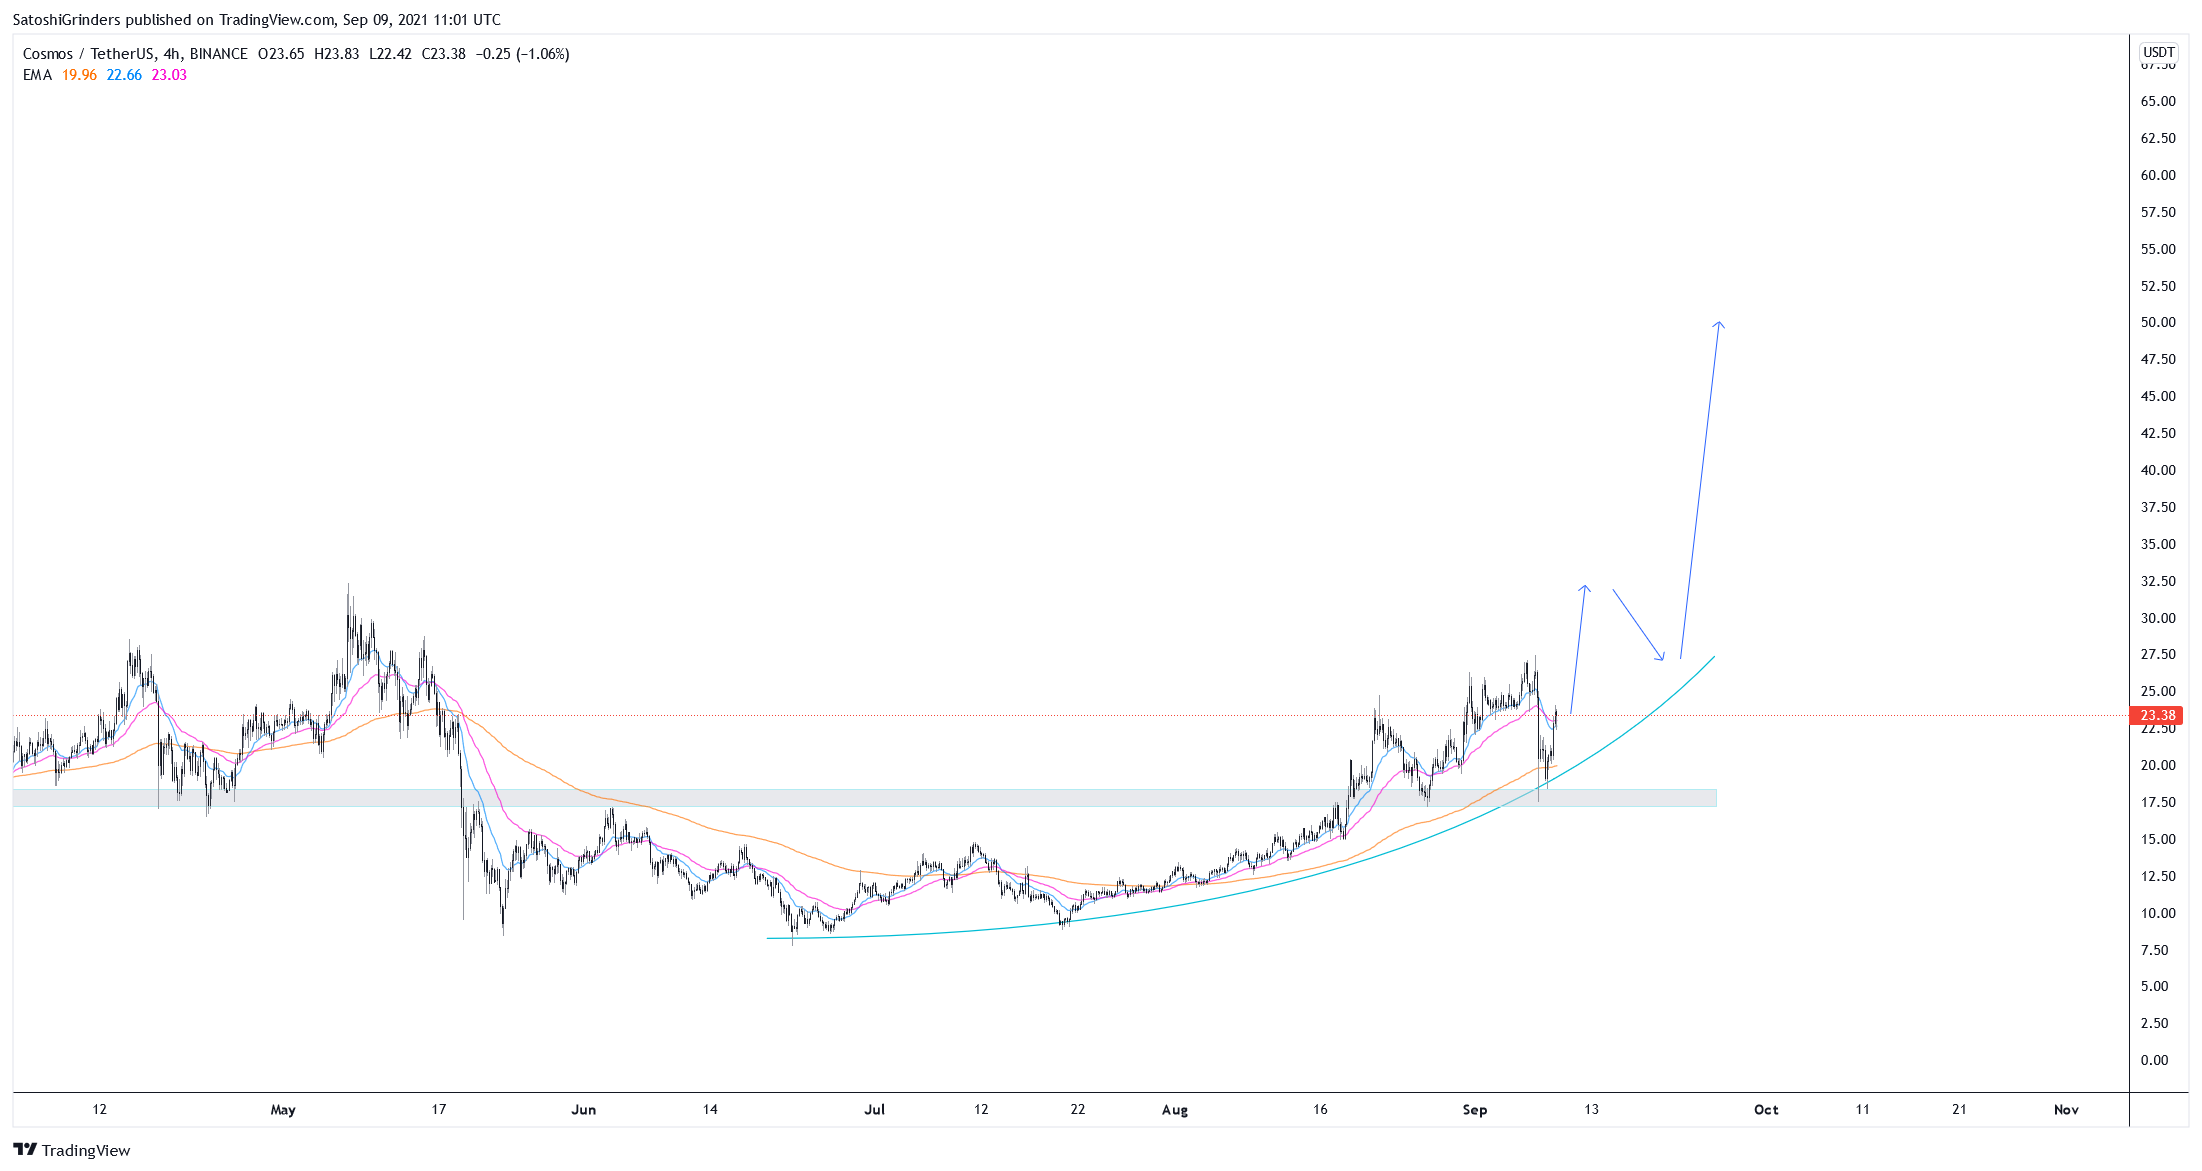
Cryptocurrency trader @thebull_crypto outlined an ATOM chart, stating that it will likely be the next coin to see a parabolic pump. As seen above, the readings from the daily chart agree with this assessment.
Future movement
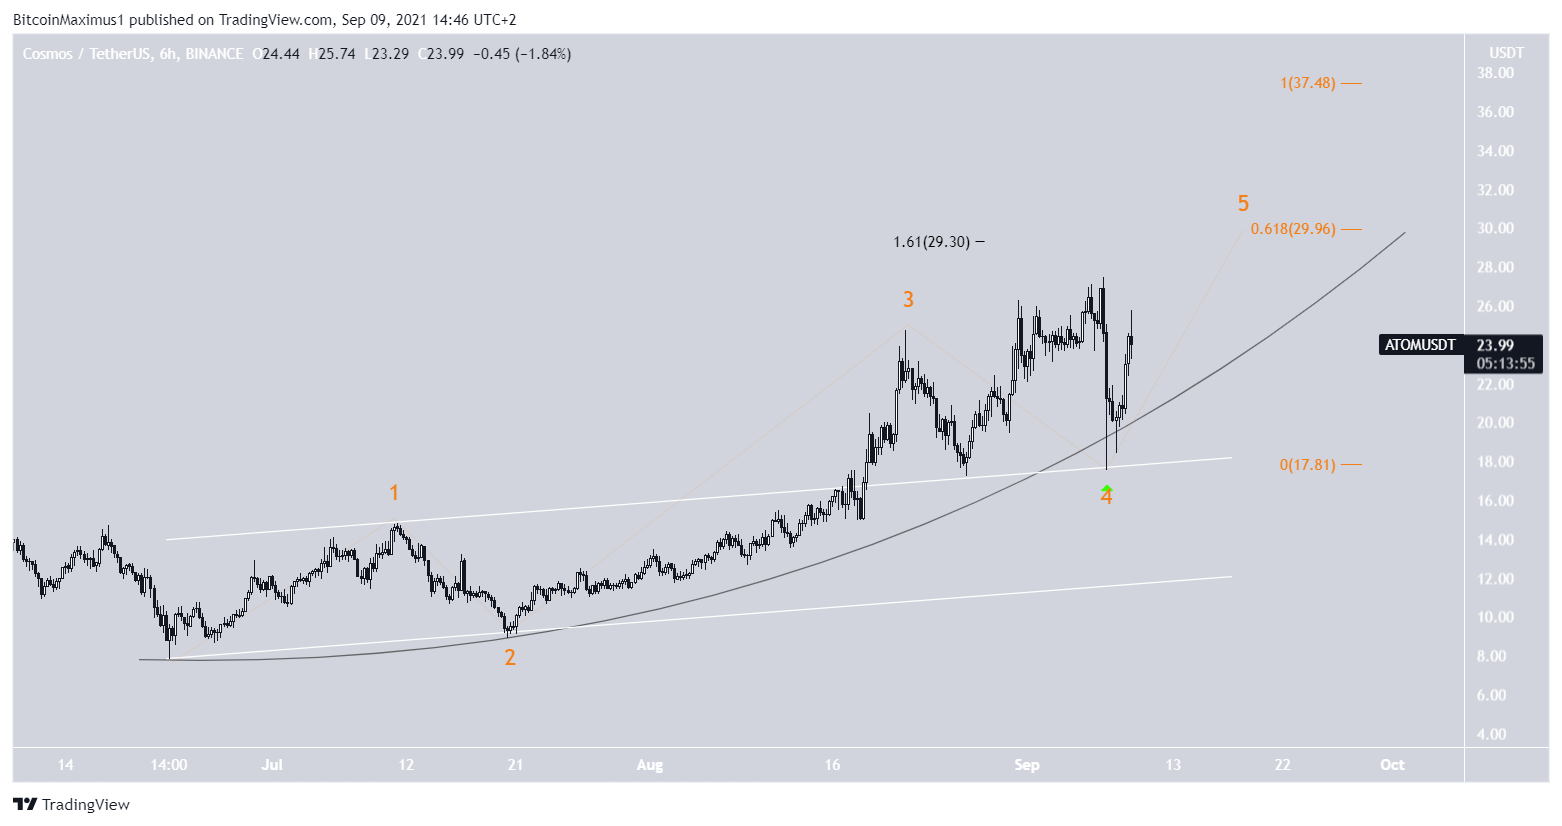
The shorter-term six-hour chart shows that ATOM has broken out from an ascending parallel channel and validated it as support afterwards (green icon). This also completed a fourth wave pullback.
The most likely target for the top of the upward movement is between $29.30-$30. The target is found by the 1.61 external Fib retracement of wave four (black) and the 0.618 length of waves 1-3. The next most likely target would be at $37.50.
ATOM/BTC
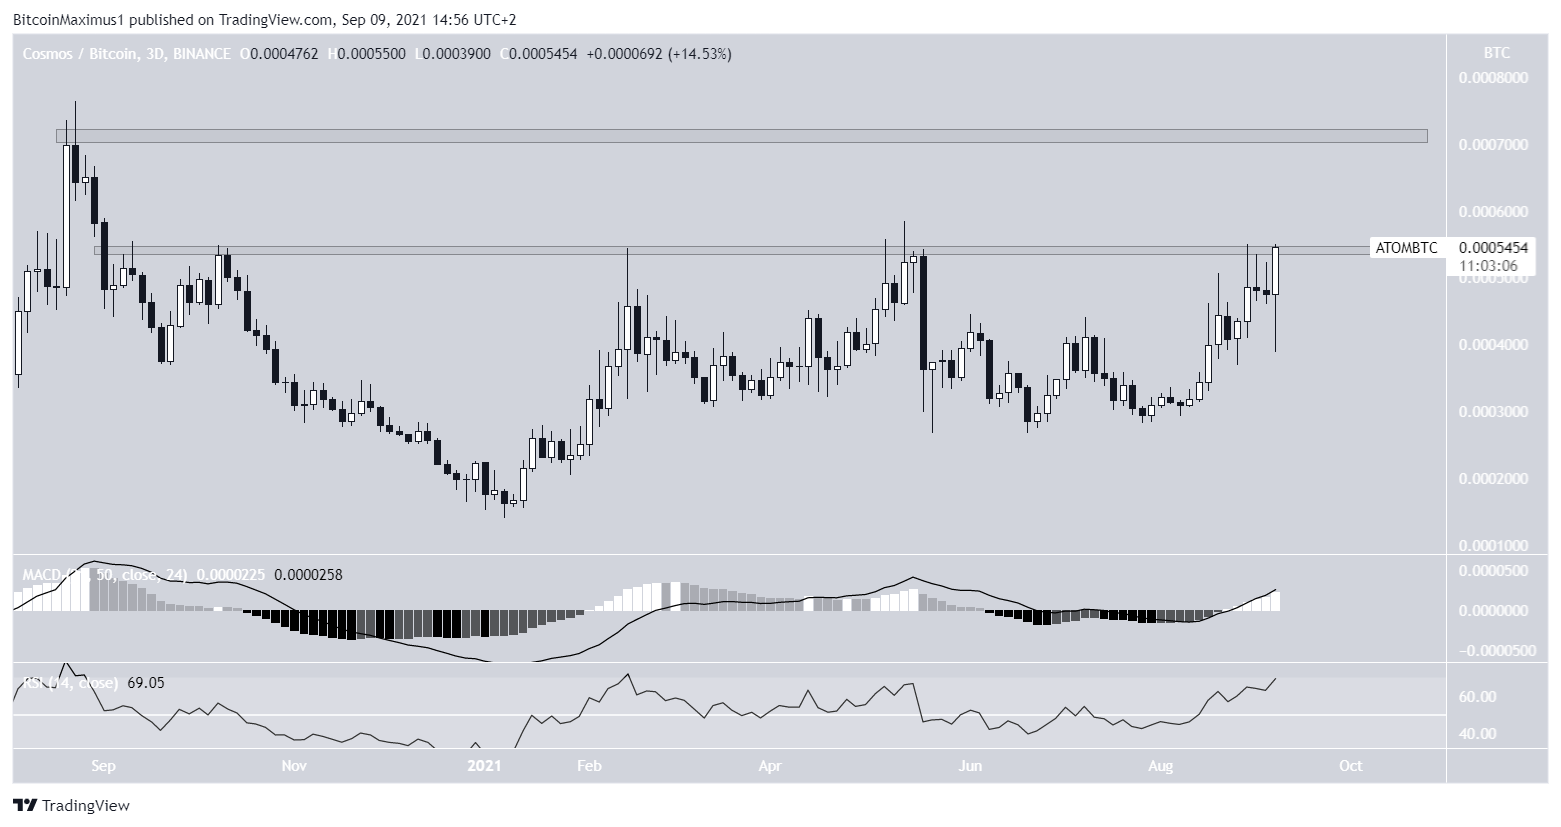
The ATOM/BTC chart shows that the token is in the process of breaking out above the 54,000 satoshi resistance area.
If it is successful in doing so, the next resistance would be at 72,000 satoshis.
The MACD and RSI are both increasing, supporting the possibility of a breakout. When combined with the bullish ATOM/USD chart, this makes a breakout very likely.
For BeInCrypto’s latest Bitcoin (BTC) analysis, click here
