
Aster (ASTER) price has slipped around 4% in the past day, but big holders aren’t backing away. Instead, they seem to be quietly positioning for what could be the token’s next recovery leg. On the charts, momentum is shifting after days of pressure, and a familiar pattern is starting to form.
These early hints may be what whales are tracking as they accumulate through the dip.
Whales Buy the Dip as Momentum Turns Positive
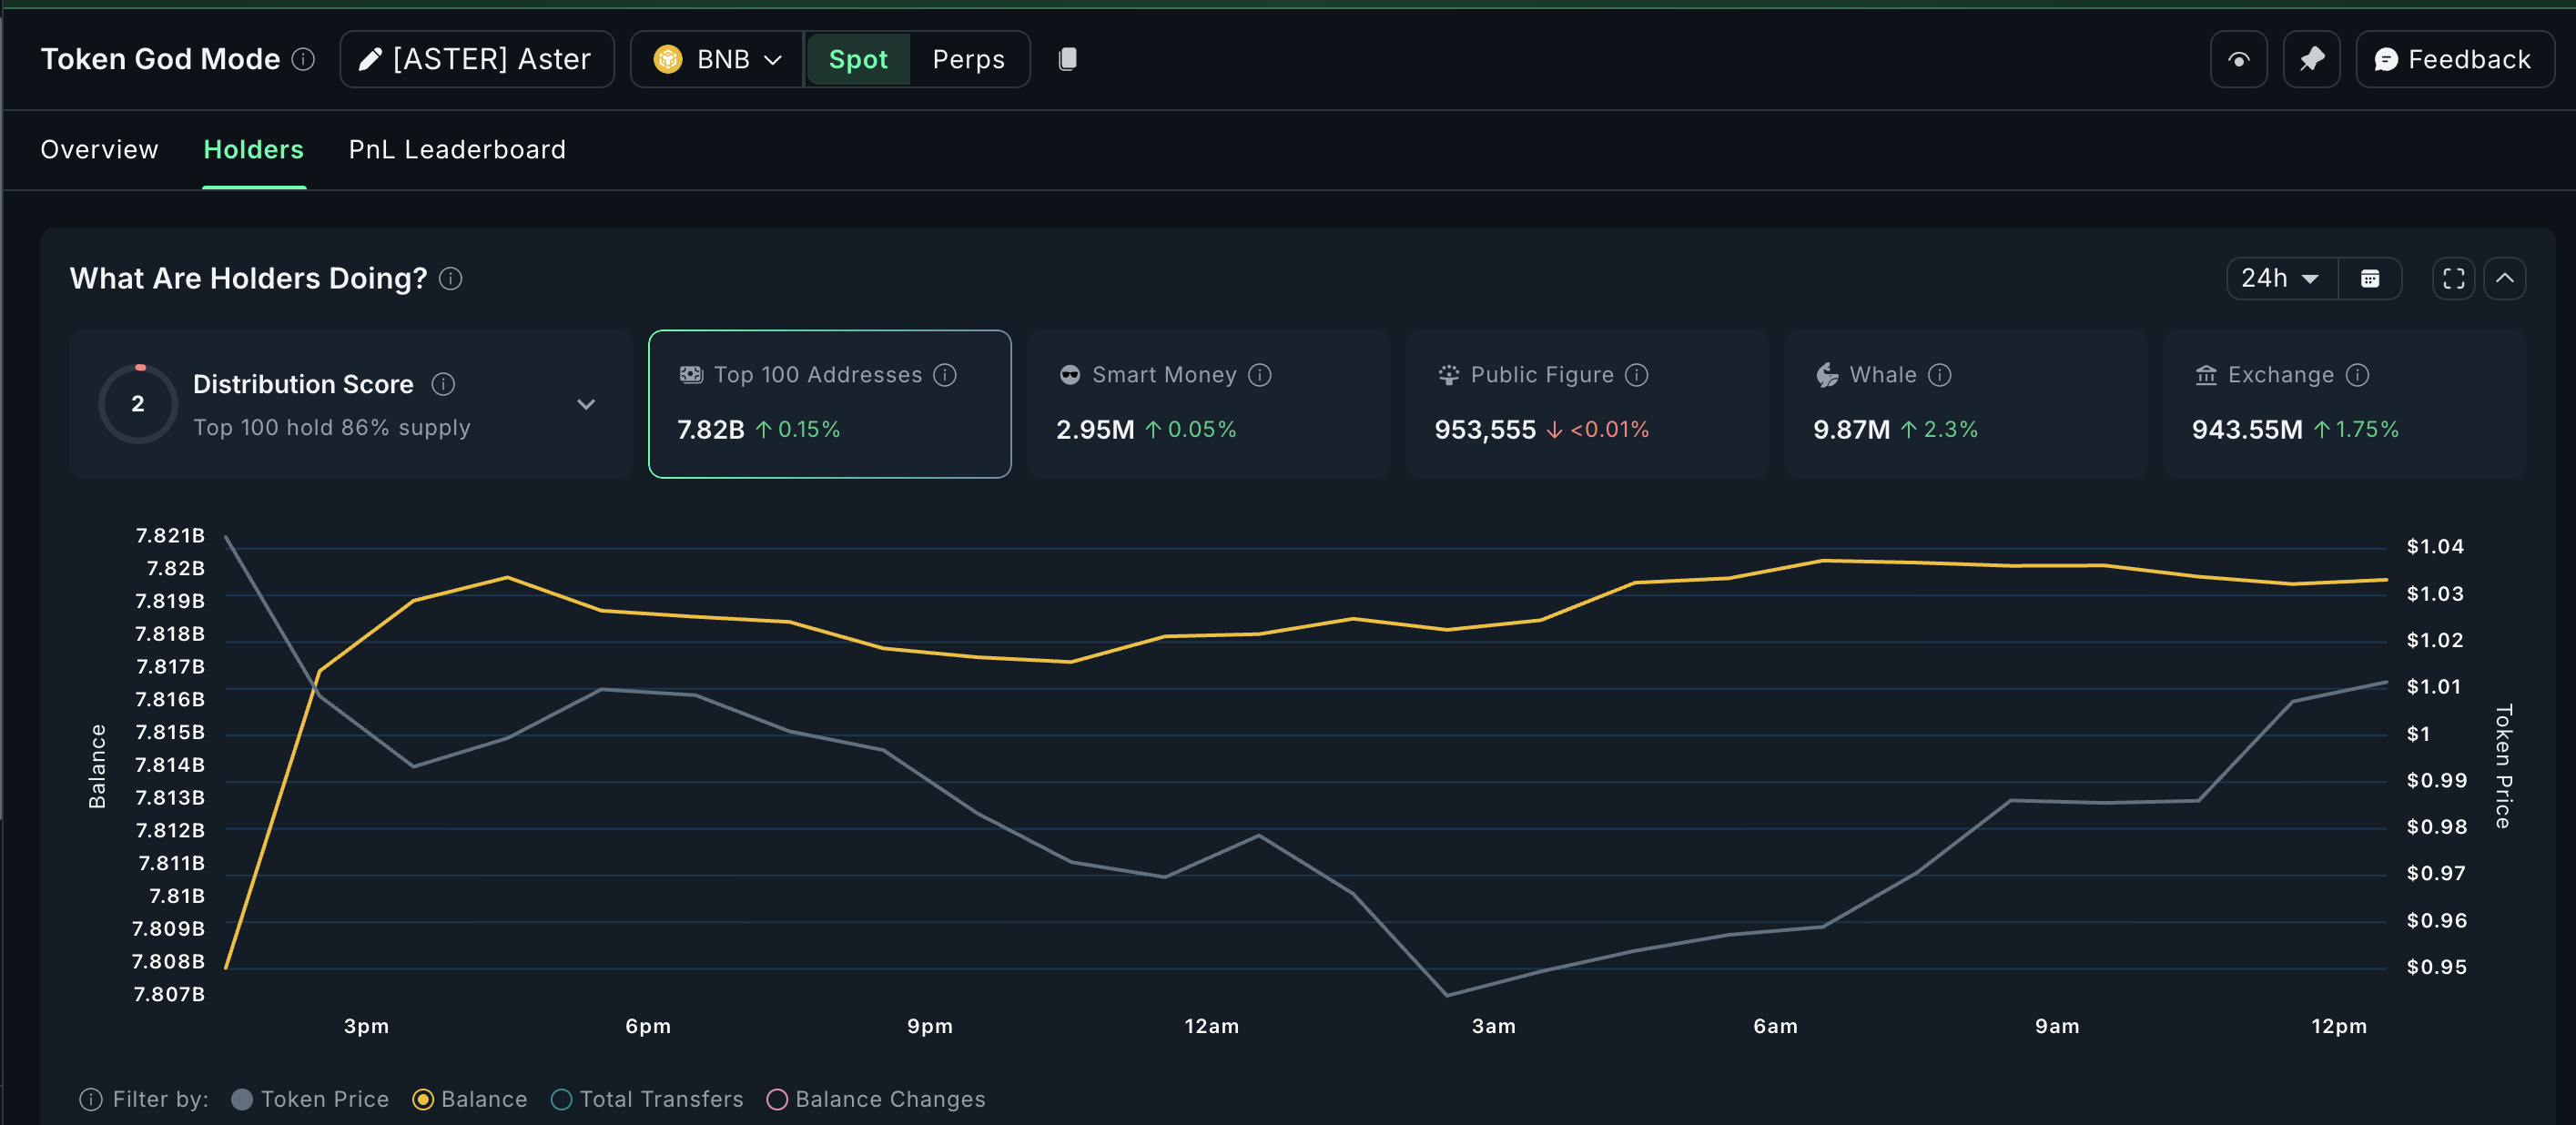
On-chain data shows that large Aster wallets have been adding more tokens despite the drop. Over the past 24 hours, smaller whales increased their holdings by 2.3%, adding about 221,900 ASTER, bringing their total stash to 9.87 million ASTER.
Meanwhile, mega whales — the top 100 addresses — added 0.15% to their holdings, picking up roughly 11.7 million ASTER and bringing their total to 7.82 billion ASTER.
Want more token insights like this? Sign up for Editor Harsh Notariya’s Daily Crypto Newsletter here.
Together, whales accumulated around 11.93 million ASTER in a single day, worth about $11.93 million at the current ASTER price level. This kind of coordinated build-up often appears near the end of downward moves, when stronger hands start absorbing weak sell volume.
Whales could be reacting to what’s happening in momentum. The Moving Average Convergence Divergence (MACD), which compares short- and long-term averages to gauge trend strength, is now flashing three bullish signs.
First, the histogram bars have turned lighter red, showing that selling pressure is easing. The MACD line (blue) is now curling upward toward the signal line (orange), suggesting a possible bullish crossover.
And third, a bullish divergence has formed between October 17 and October 22 — while the price made a lower low, the MACD made a higher low, a signal that downside energy is fading.
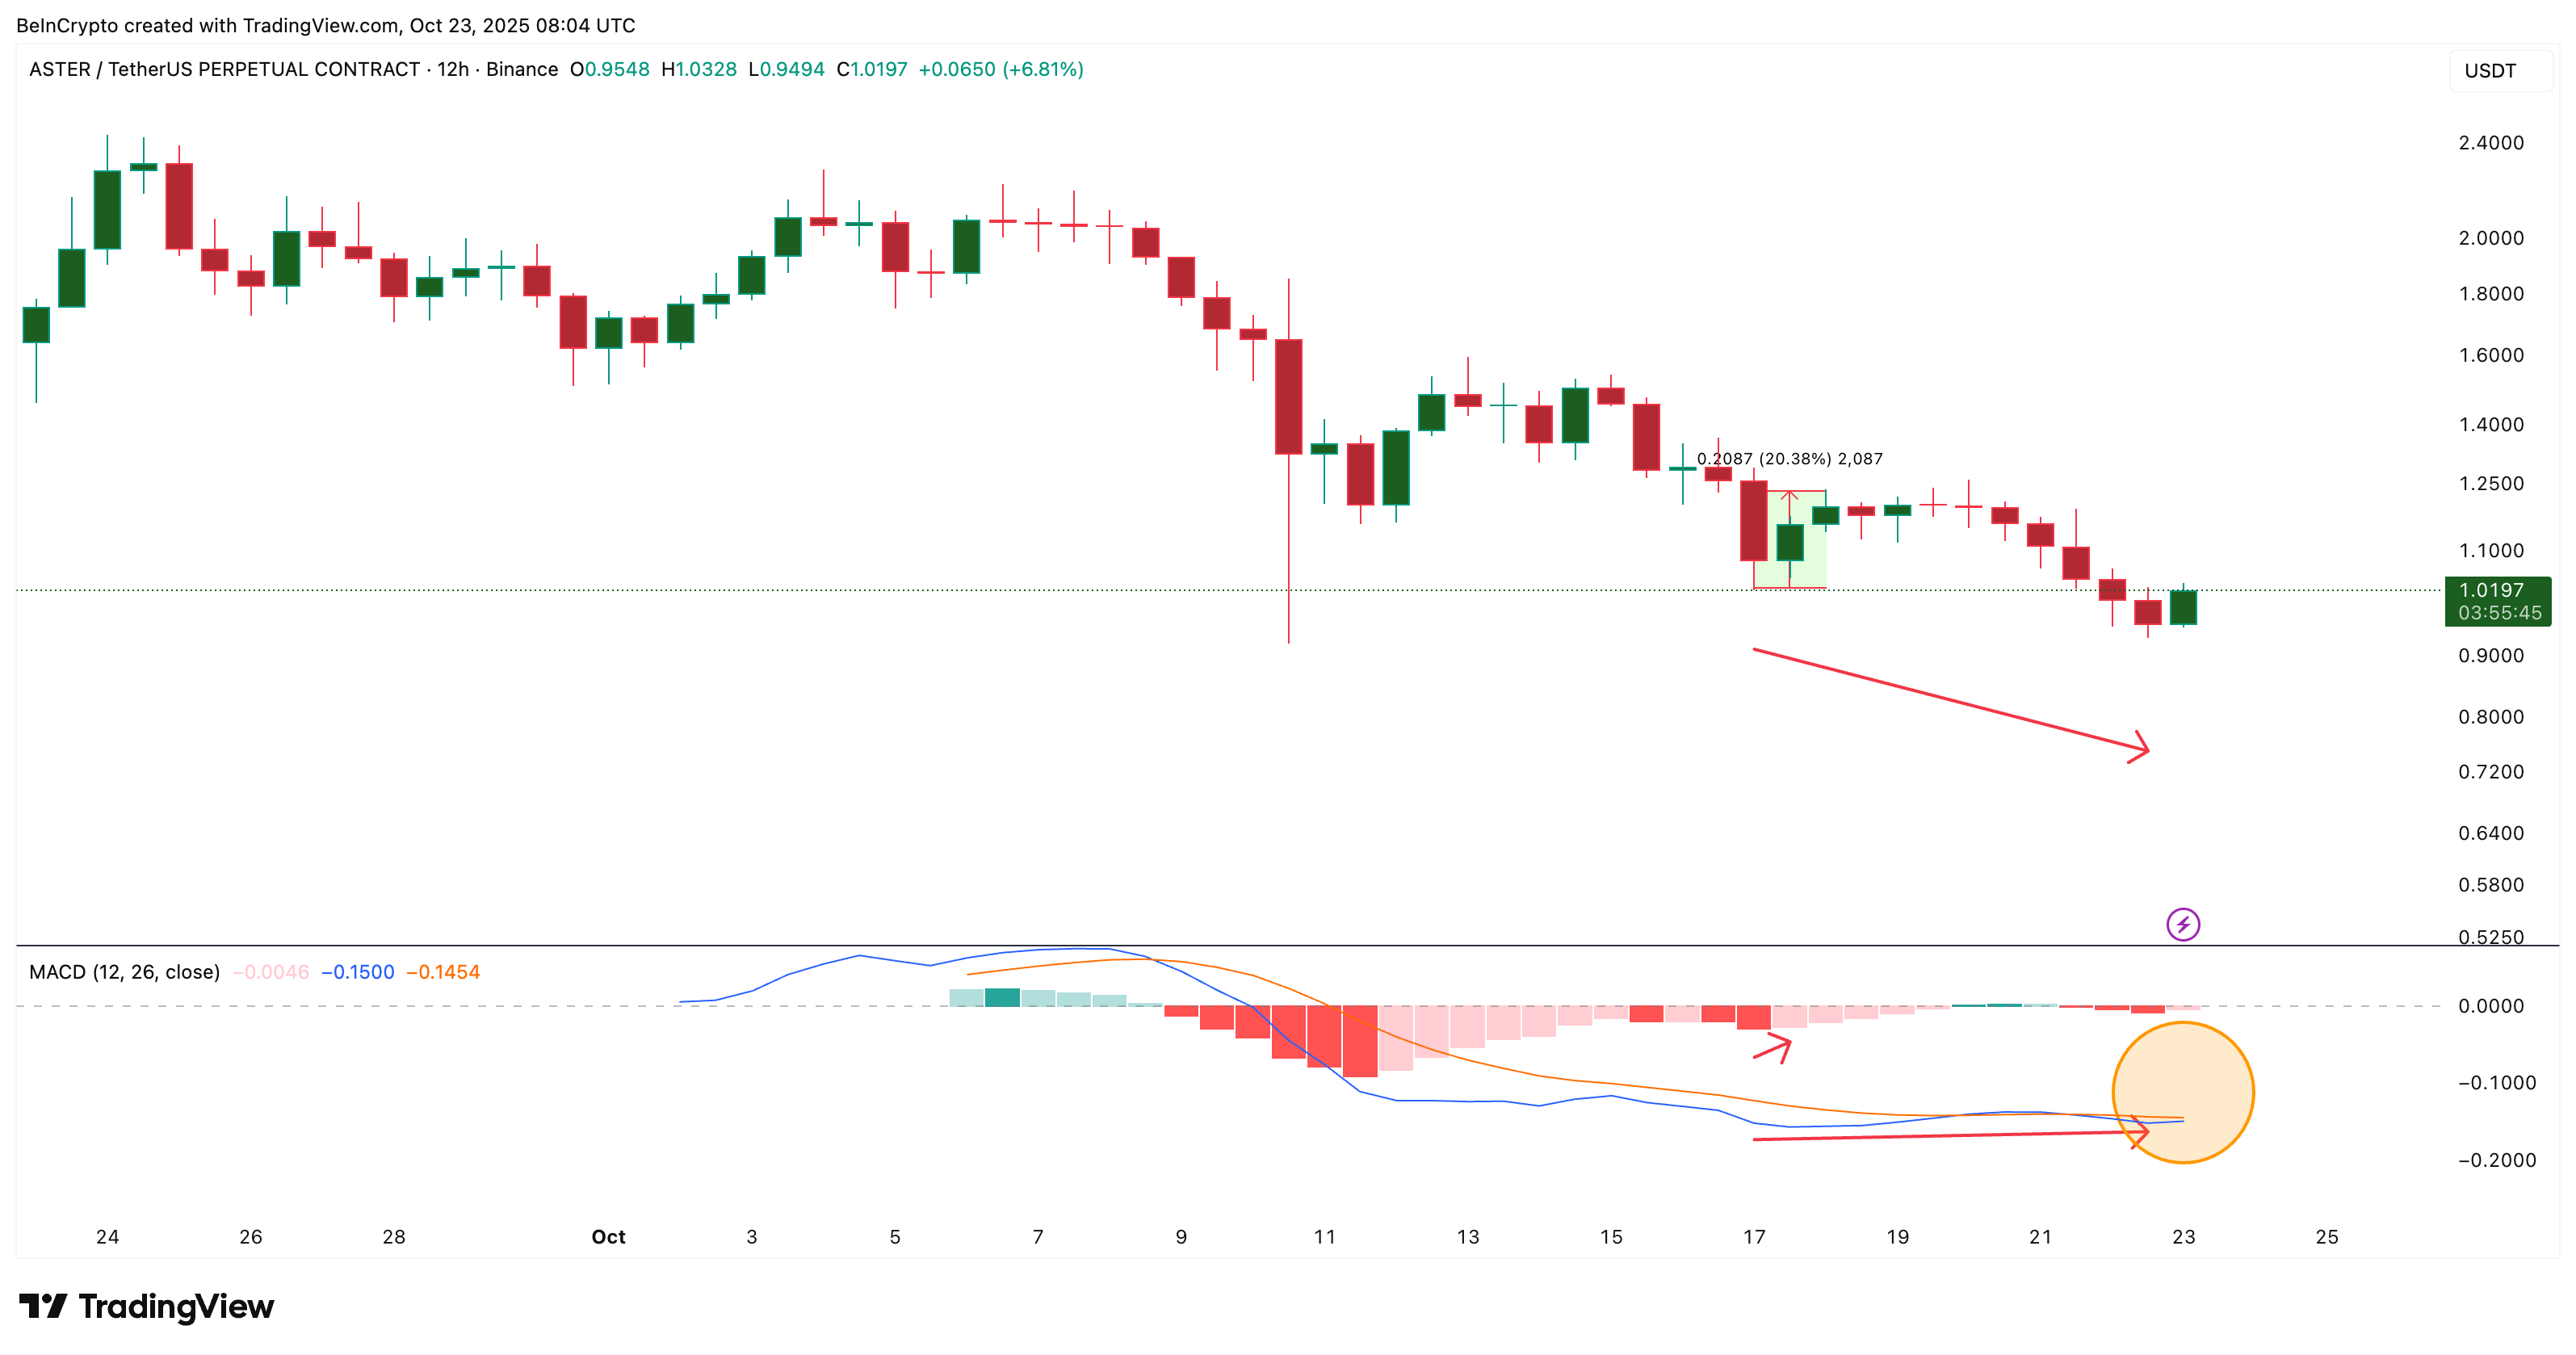
When the same lighter-histogram setup appeared on October 17, ASTER rallied nearly 20%. The two new elements this time — the upward curl and the divergence — add weight to the idea that whales might be seeing another bullish phase forming.
ASTER Price Structure Points to a Reversal Setup
Aster’s broader chart shows a broadening falling wedge, which forms the fourth bullish sign in the current setup. Unlike a typical wedge that tightens, this one is expanding, with each swing showing slightly wider highs and lows. This structure often appears before sharp reversals, as volatility builds and sellers start losing control.
$0.93 remains key support, while $1.12 is the first resistance to clear. A confirmed breakout above that could open targets near $1.28 and $1.53. If the move holds, ASTER could break out of the falling wedge at above $1.79.
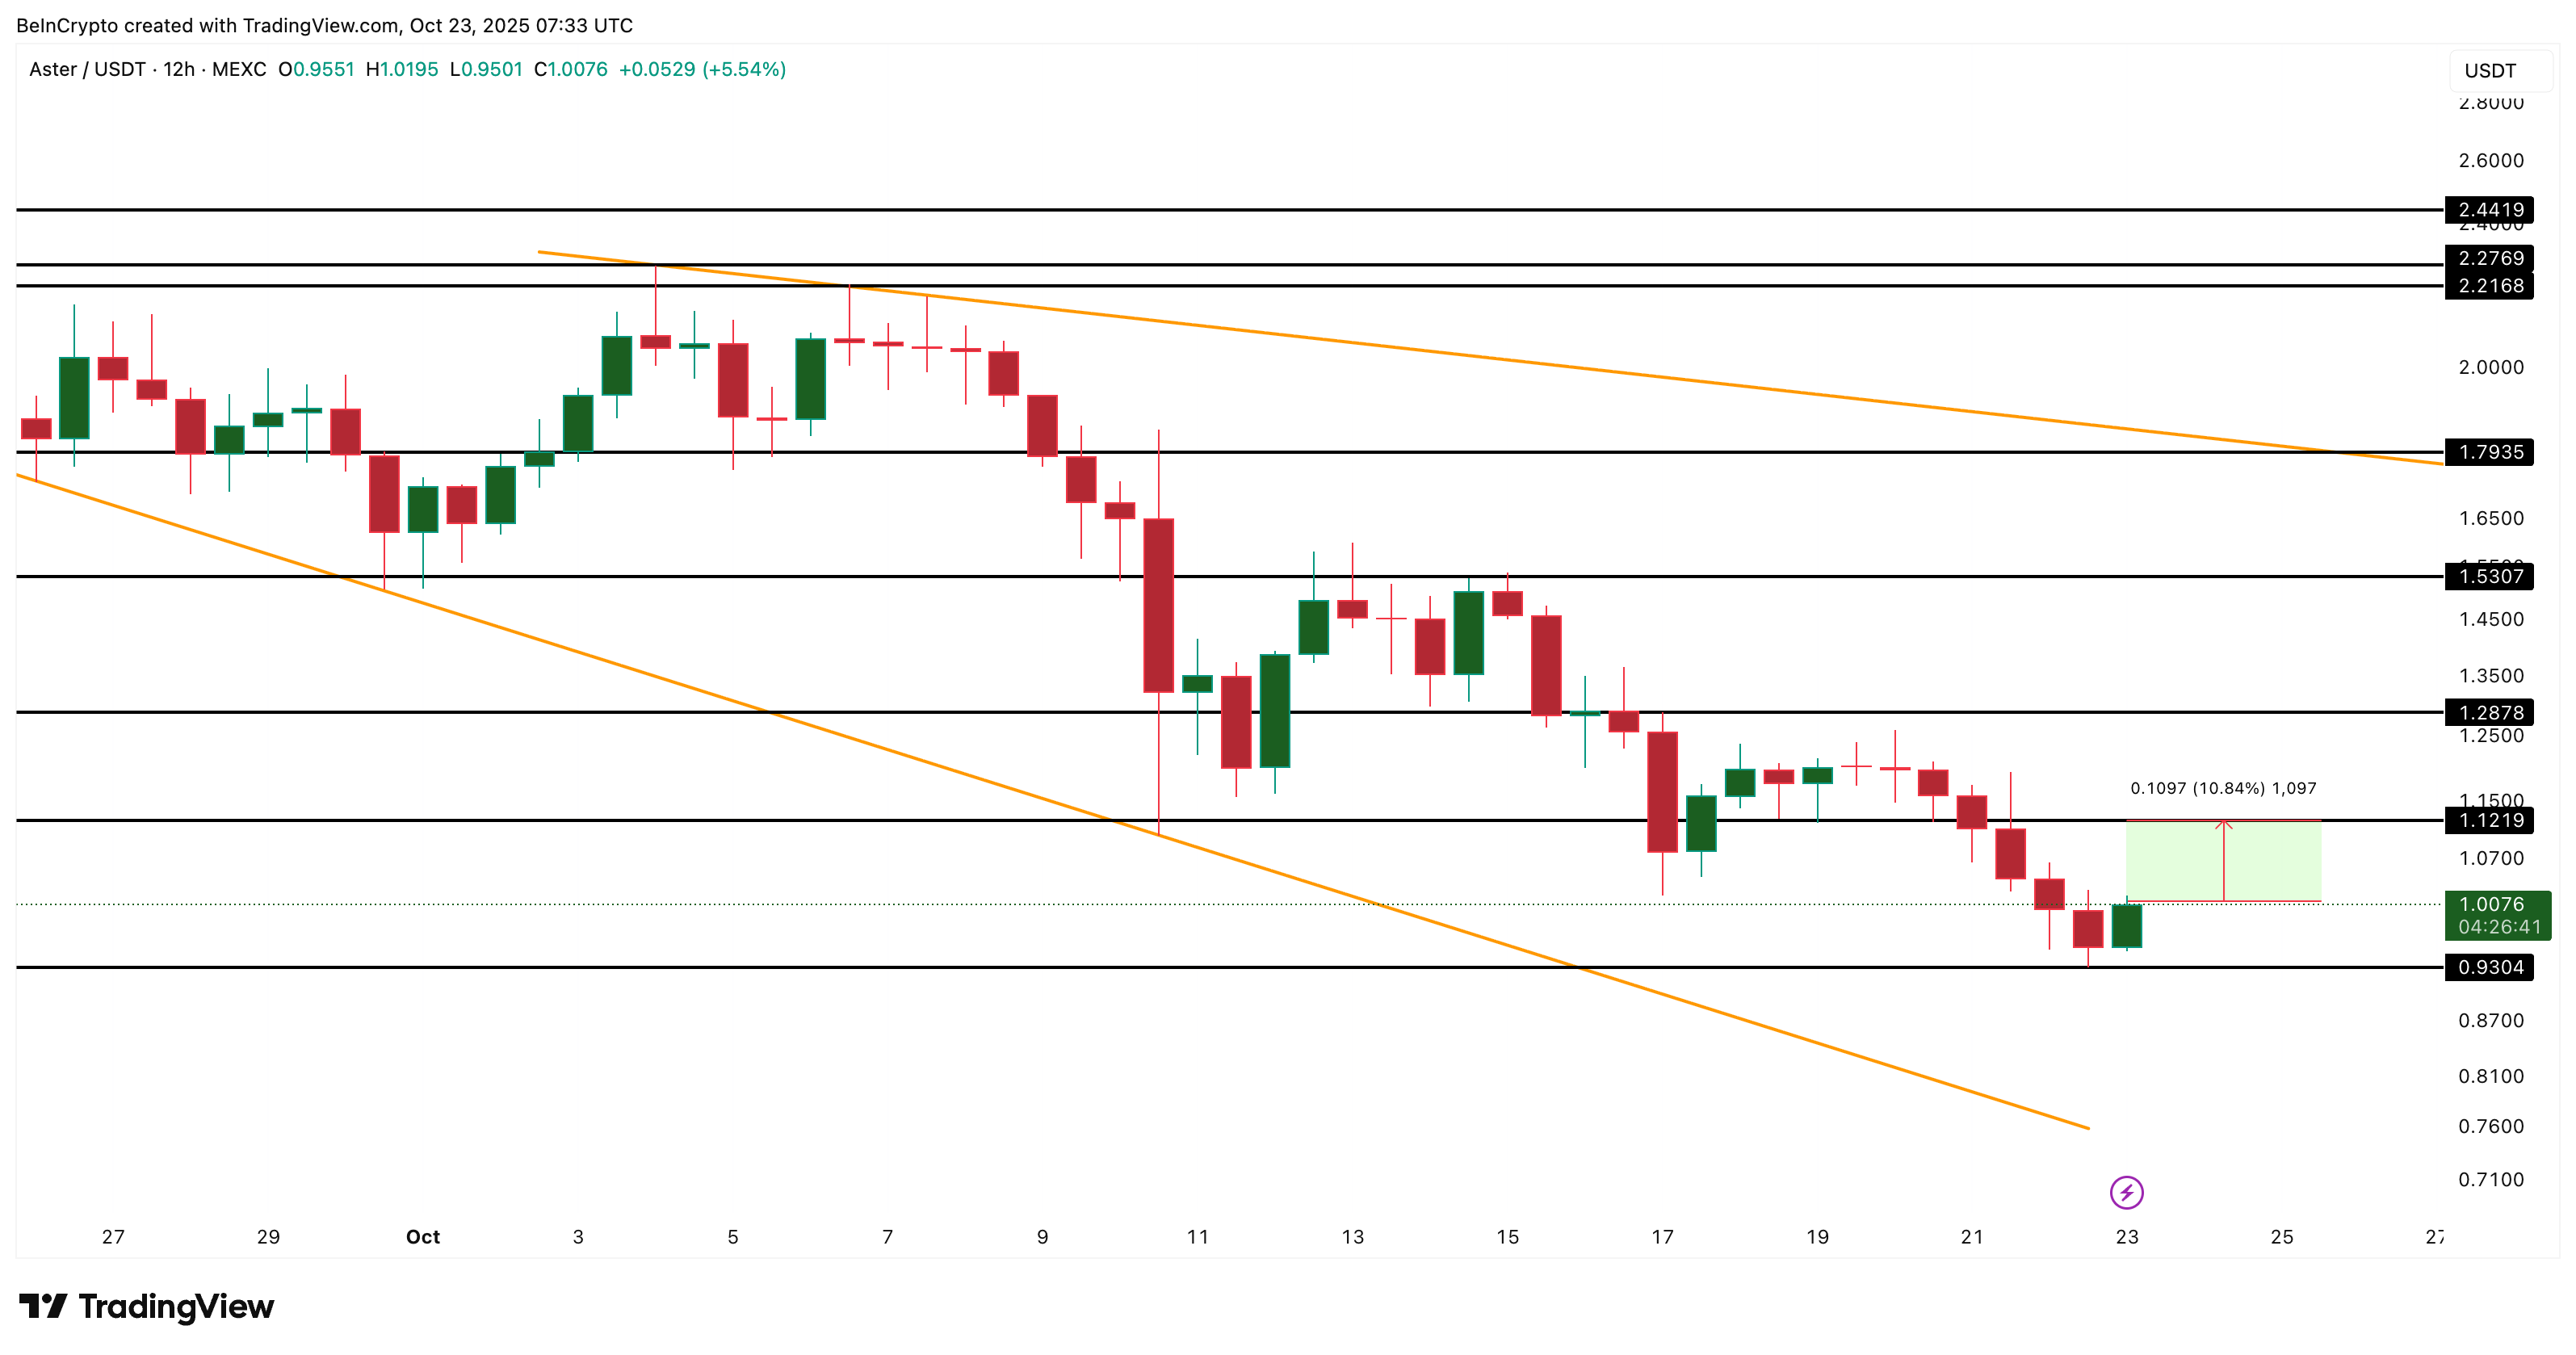
A breakdown below $0.93, however, would weaken this setup and expose a move back to $0.80.
