
ASTER’s recent listing on Binance has pulled the token back into the spotlight. While the ASTER price briefly cooled to under $2 after strong gains, large-holder activity and strengthening indicators suggest the story is far from over.
The short-term data points to a tug-of-war between liquidity positioning and genuine selling, but if the bulls are right, leaving ASTER now might not be the best decision ever. More so as it’s mere 17% south of its recent all-time high.
Mega Whales Accumulate
On-chain data shows ASTER’s biggest holders are quietly strengthening their grip.
The top 100 addresses — or “mega whales” — now hold about 7.84 billion ASTER, up 1.76% in 24 hours. That’s roughly 134 million ASTER, worth around $264 million at current prices.
Meanwhile, public-figure wallets have also grown their holdings by 5.34%, adding about 236,000 ASTER (almost $465,000).
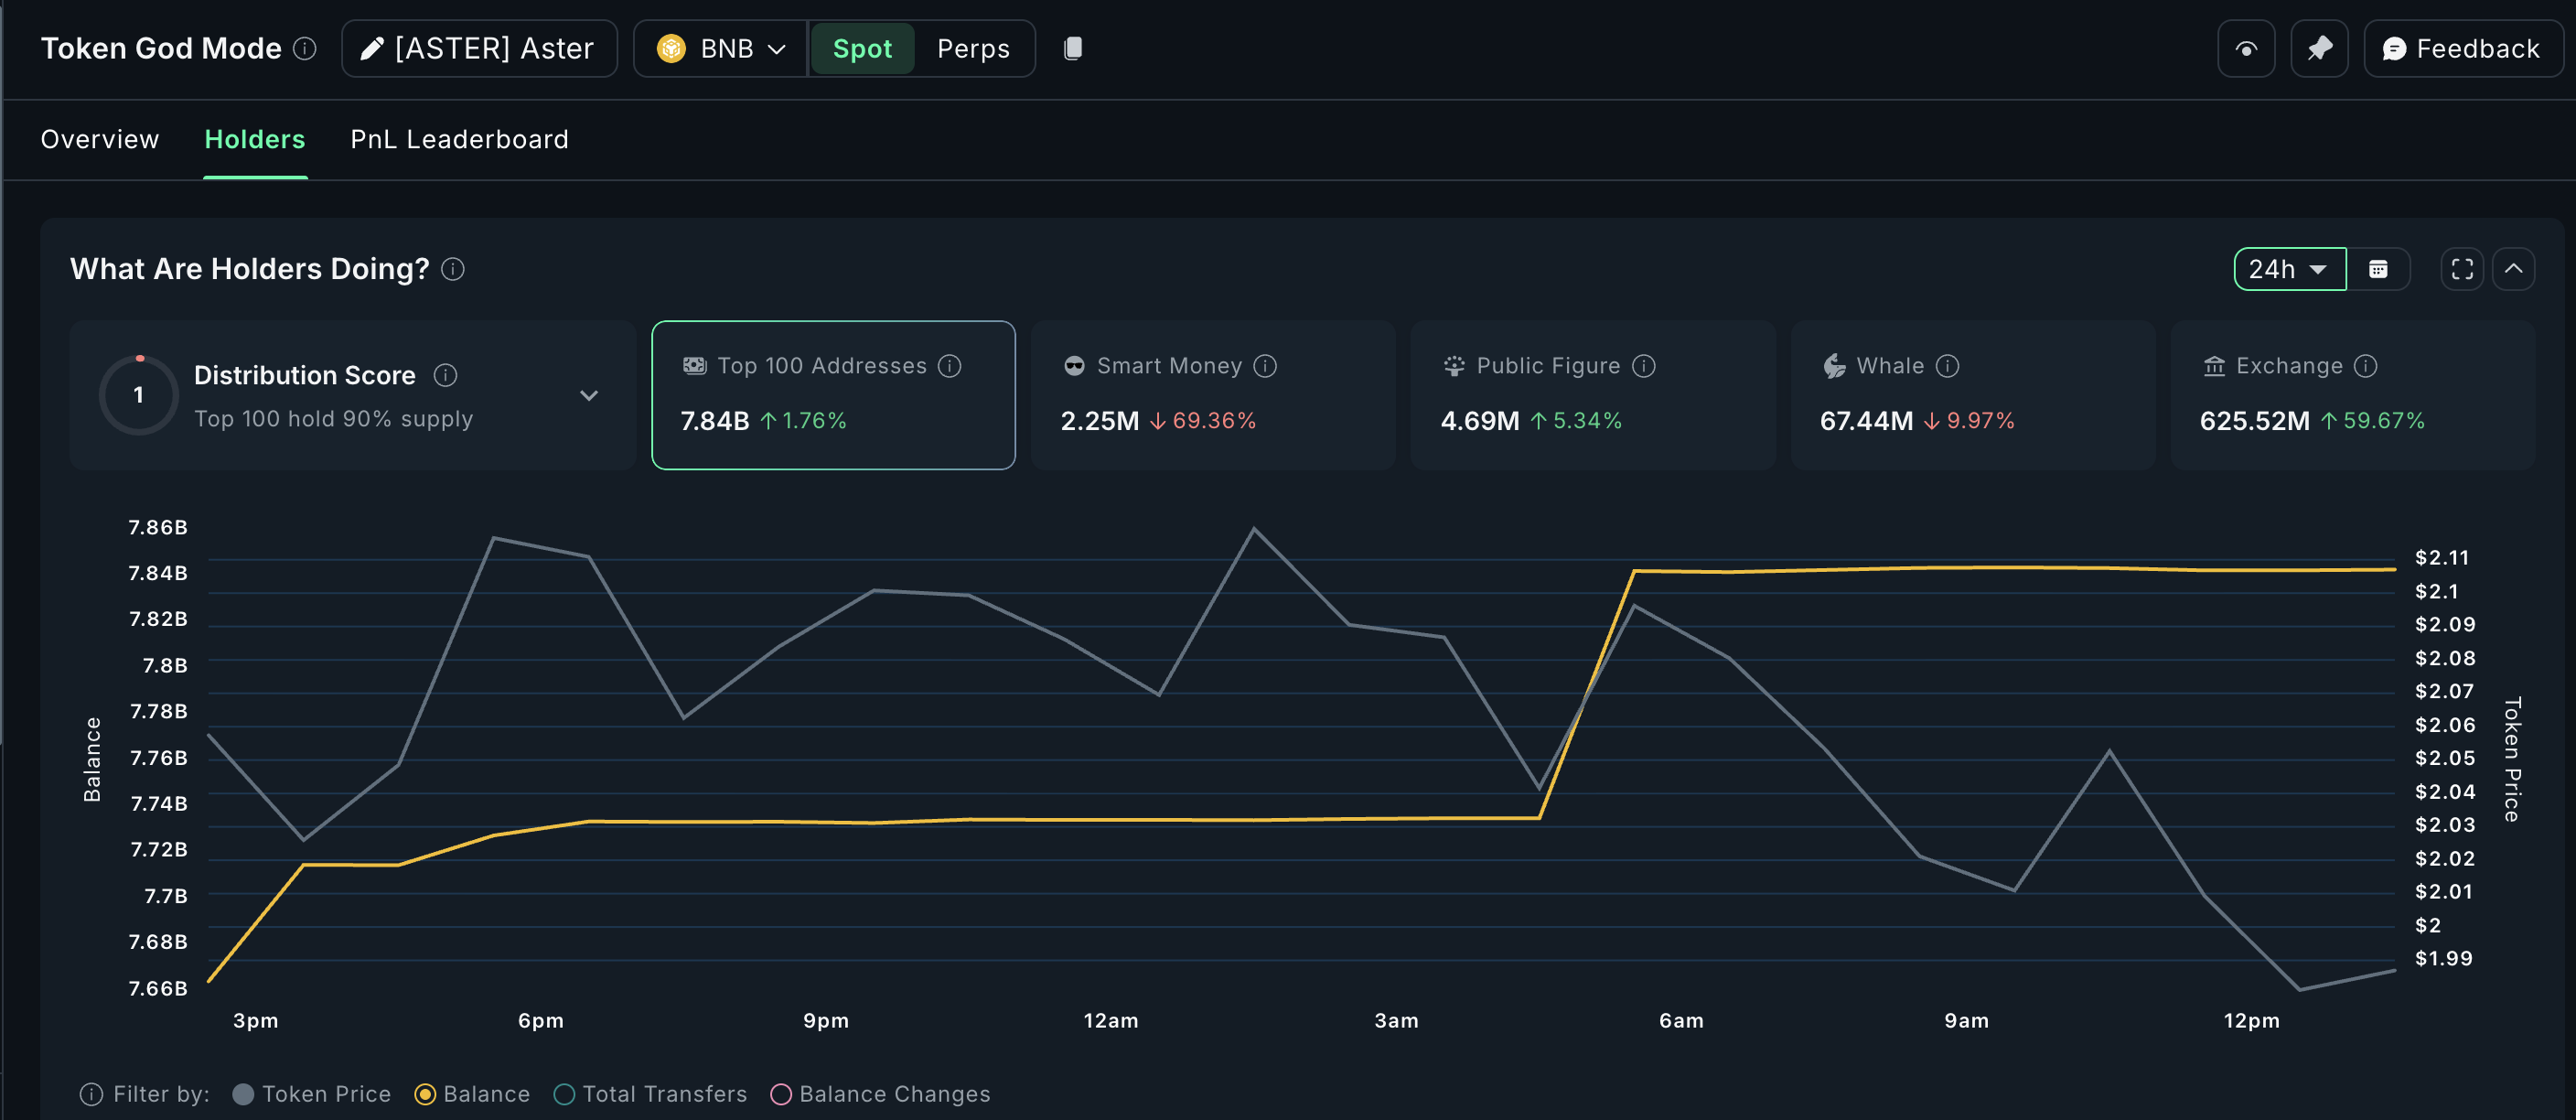
In contrast, smart-money wallets reduced exposure by nearly 70%, while whales trimmed holdings by 9.97%, selling about 7.5 million ASTER ( close to $15 million).
Exchange balances have surged 59.6% to 625 million ASTER, which could look like heavy selling — but that might be misleading. Given Binance’s new listing, part of this jump could be liquidity repositioning.
Want more token insights like this? Sign up for Editor Harsh Notariya’s Daily Crypto Newsletter here.
Supporting that, the Money Flow Index (MFI) — which measures buying and selling pressure based on price and volume — is trending upward.
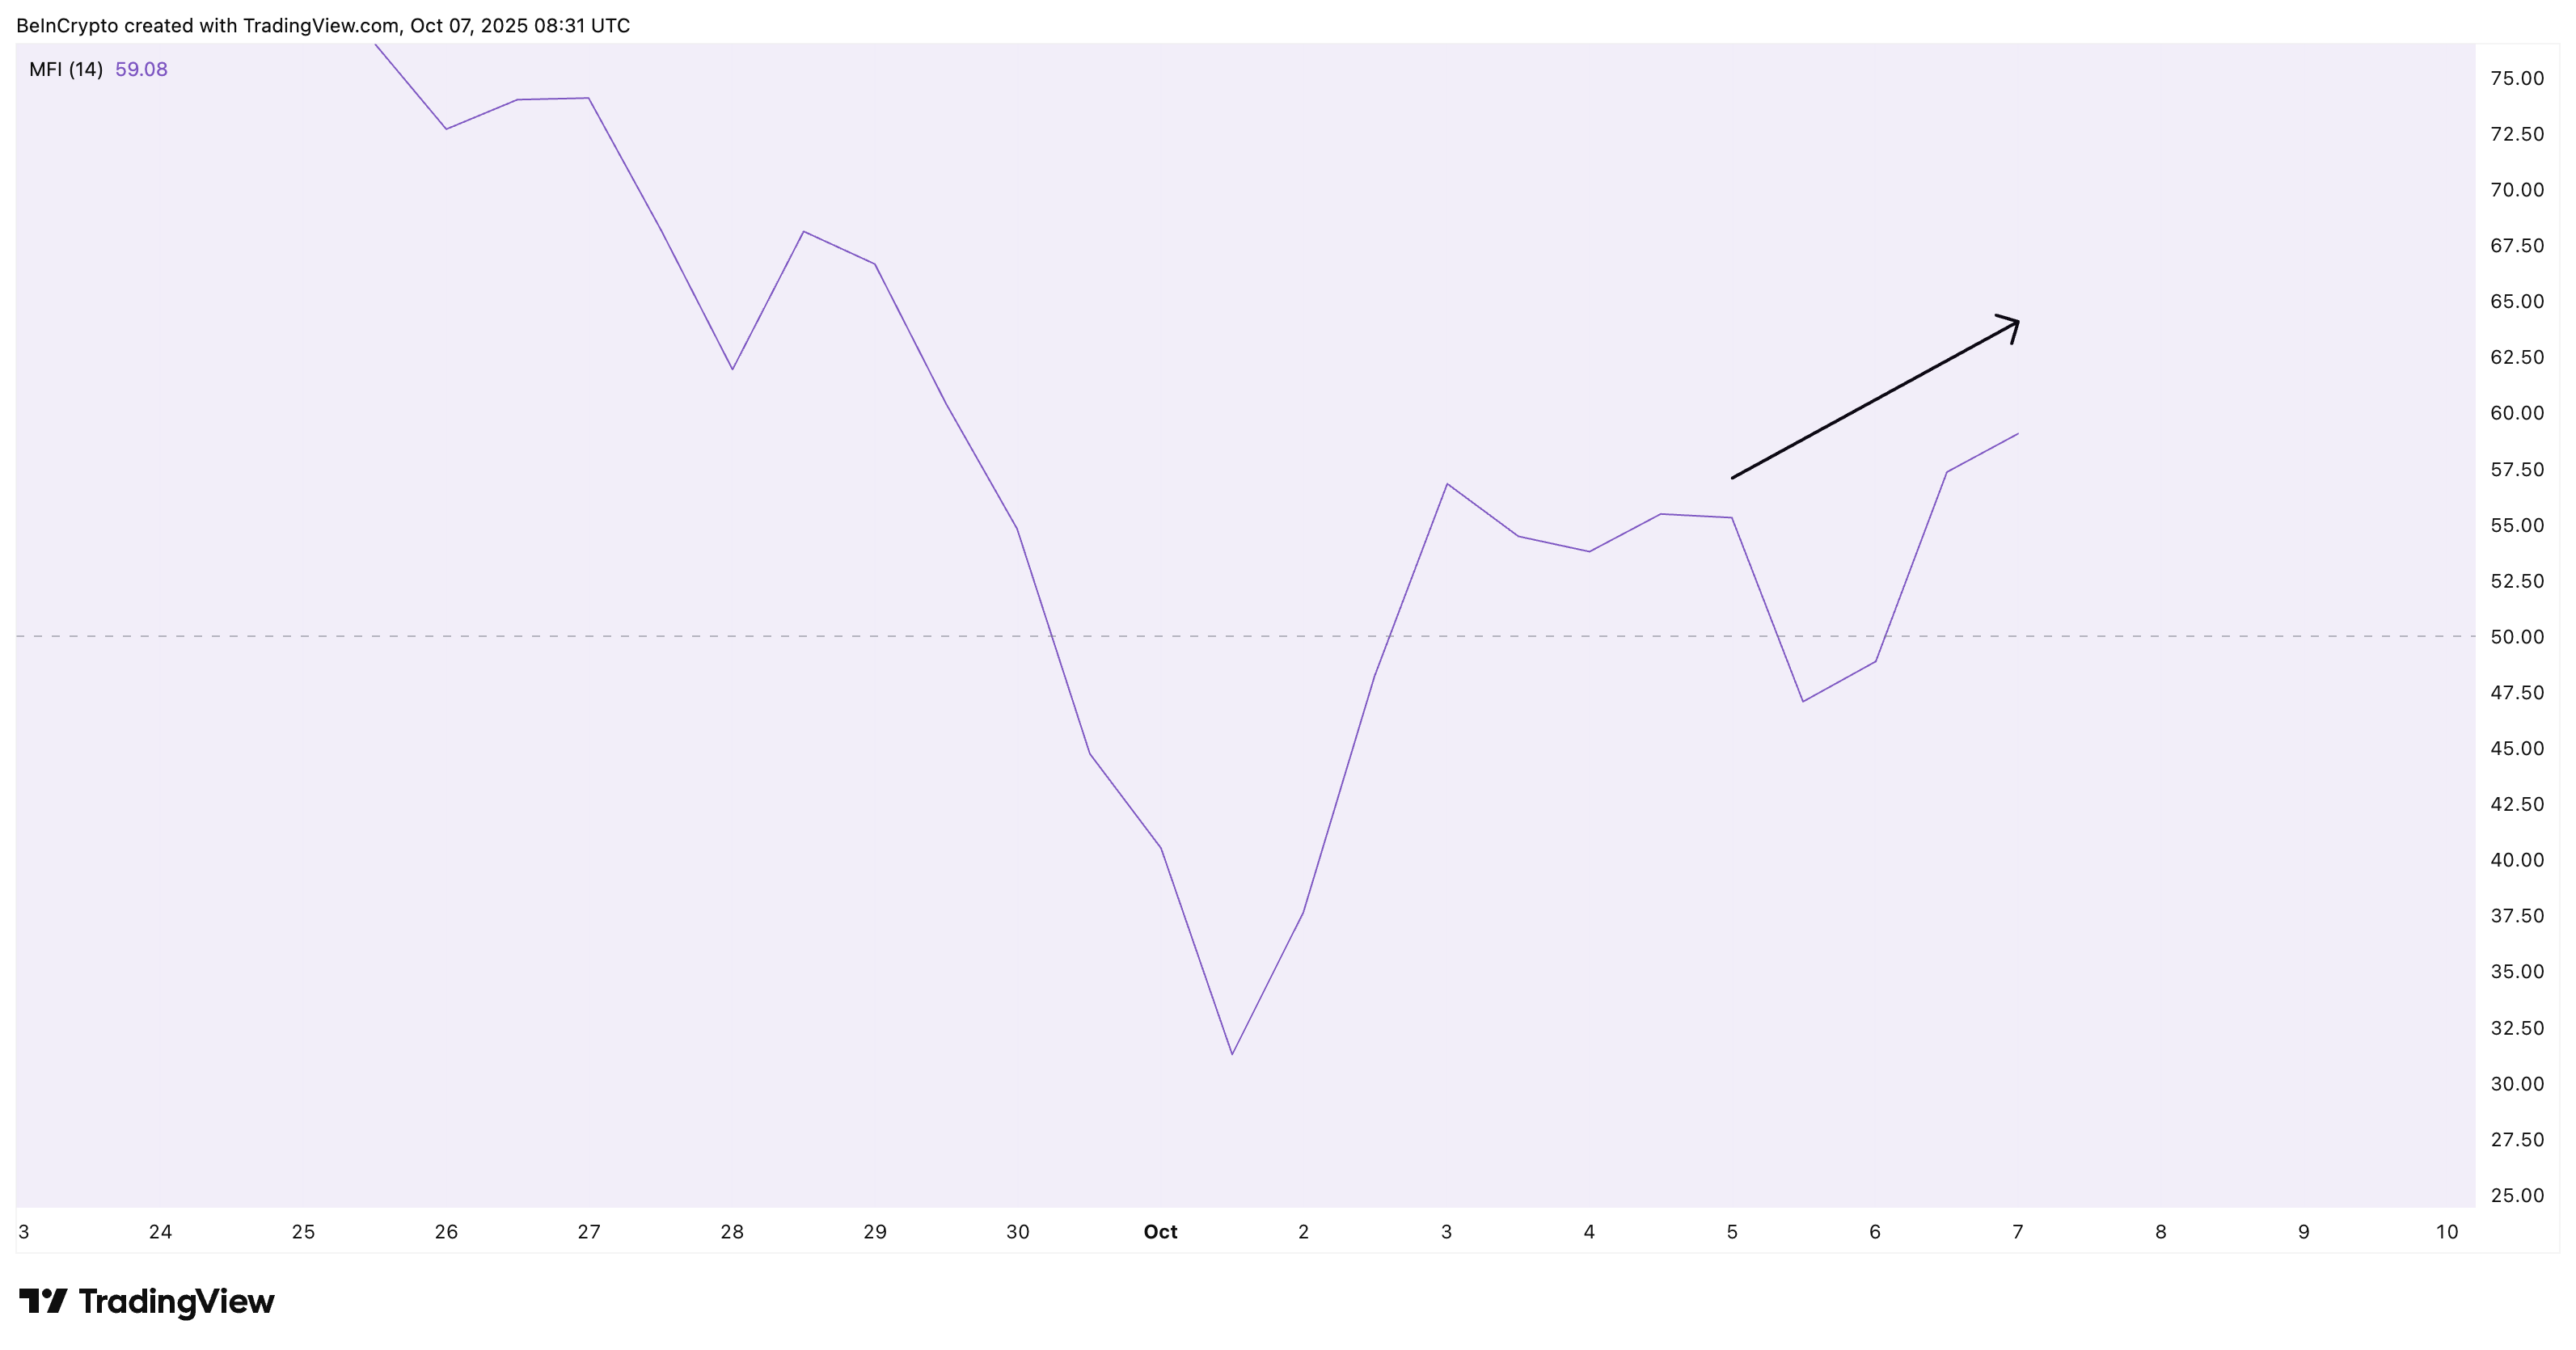
If these inflows were truly sell-driven, MFI would have dropped. Instead, it’s rising toward 65, signaling that money is still flowing into ASTER.
The Bull-Bear Power (BBP) indicator backs this up. BBP compares buying and selling momentum; when it’s green, bulls dominate. Since October 5, BBP bars have turned positive, showing renewed strength.
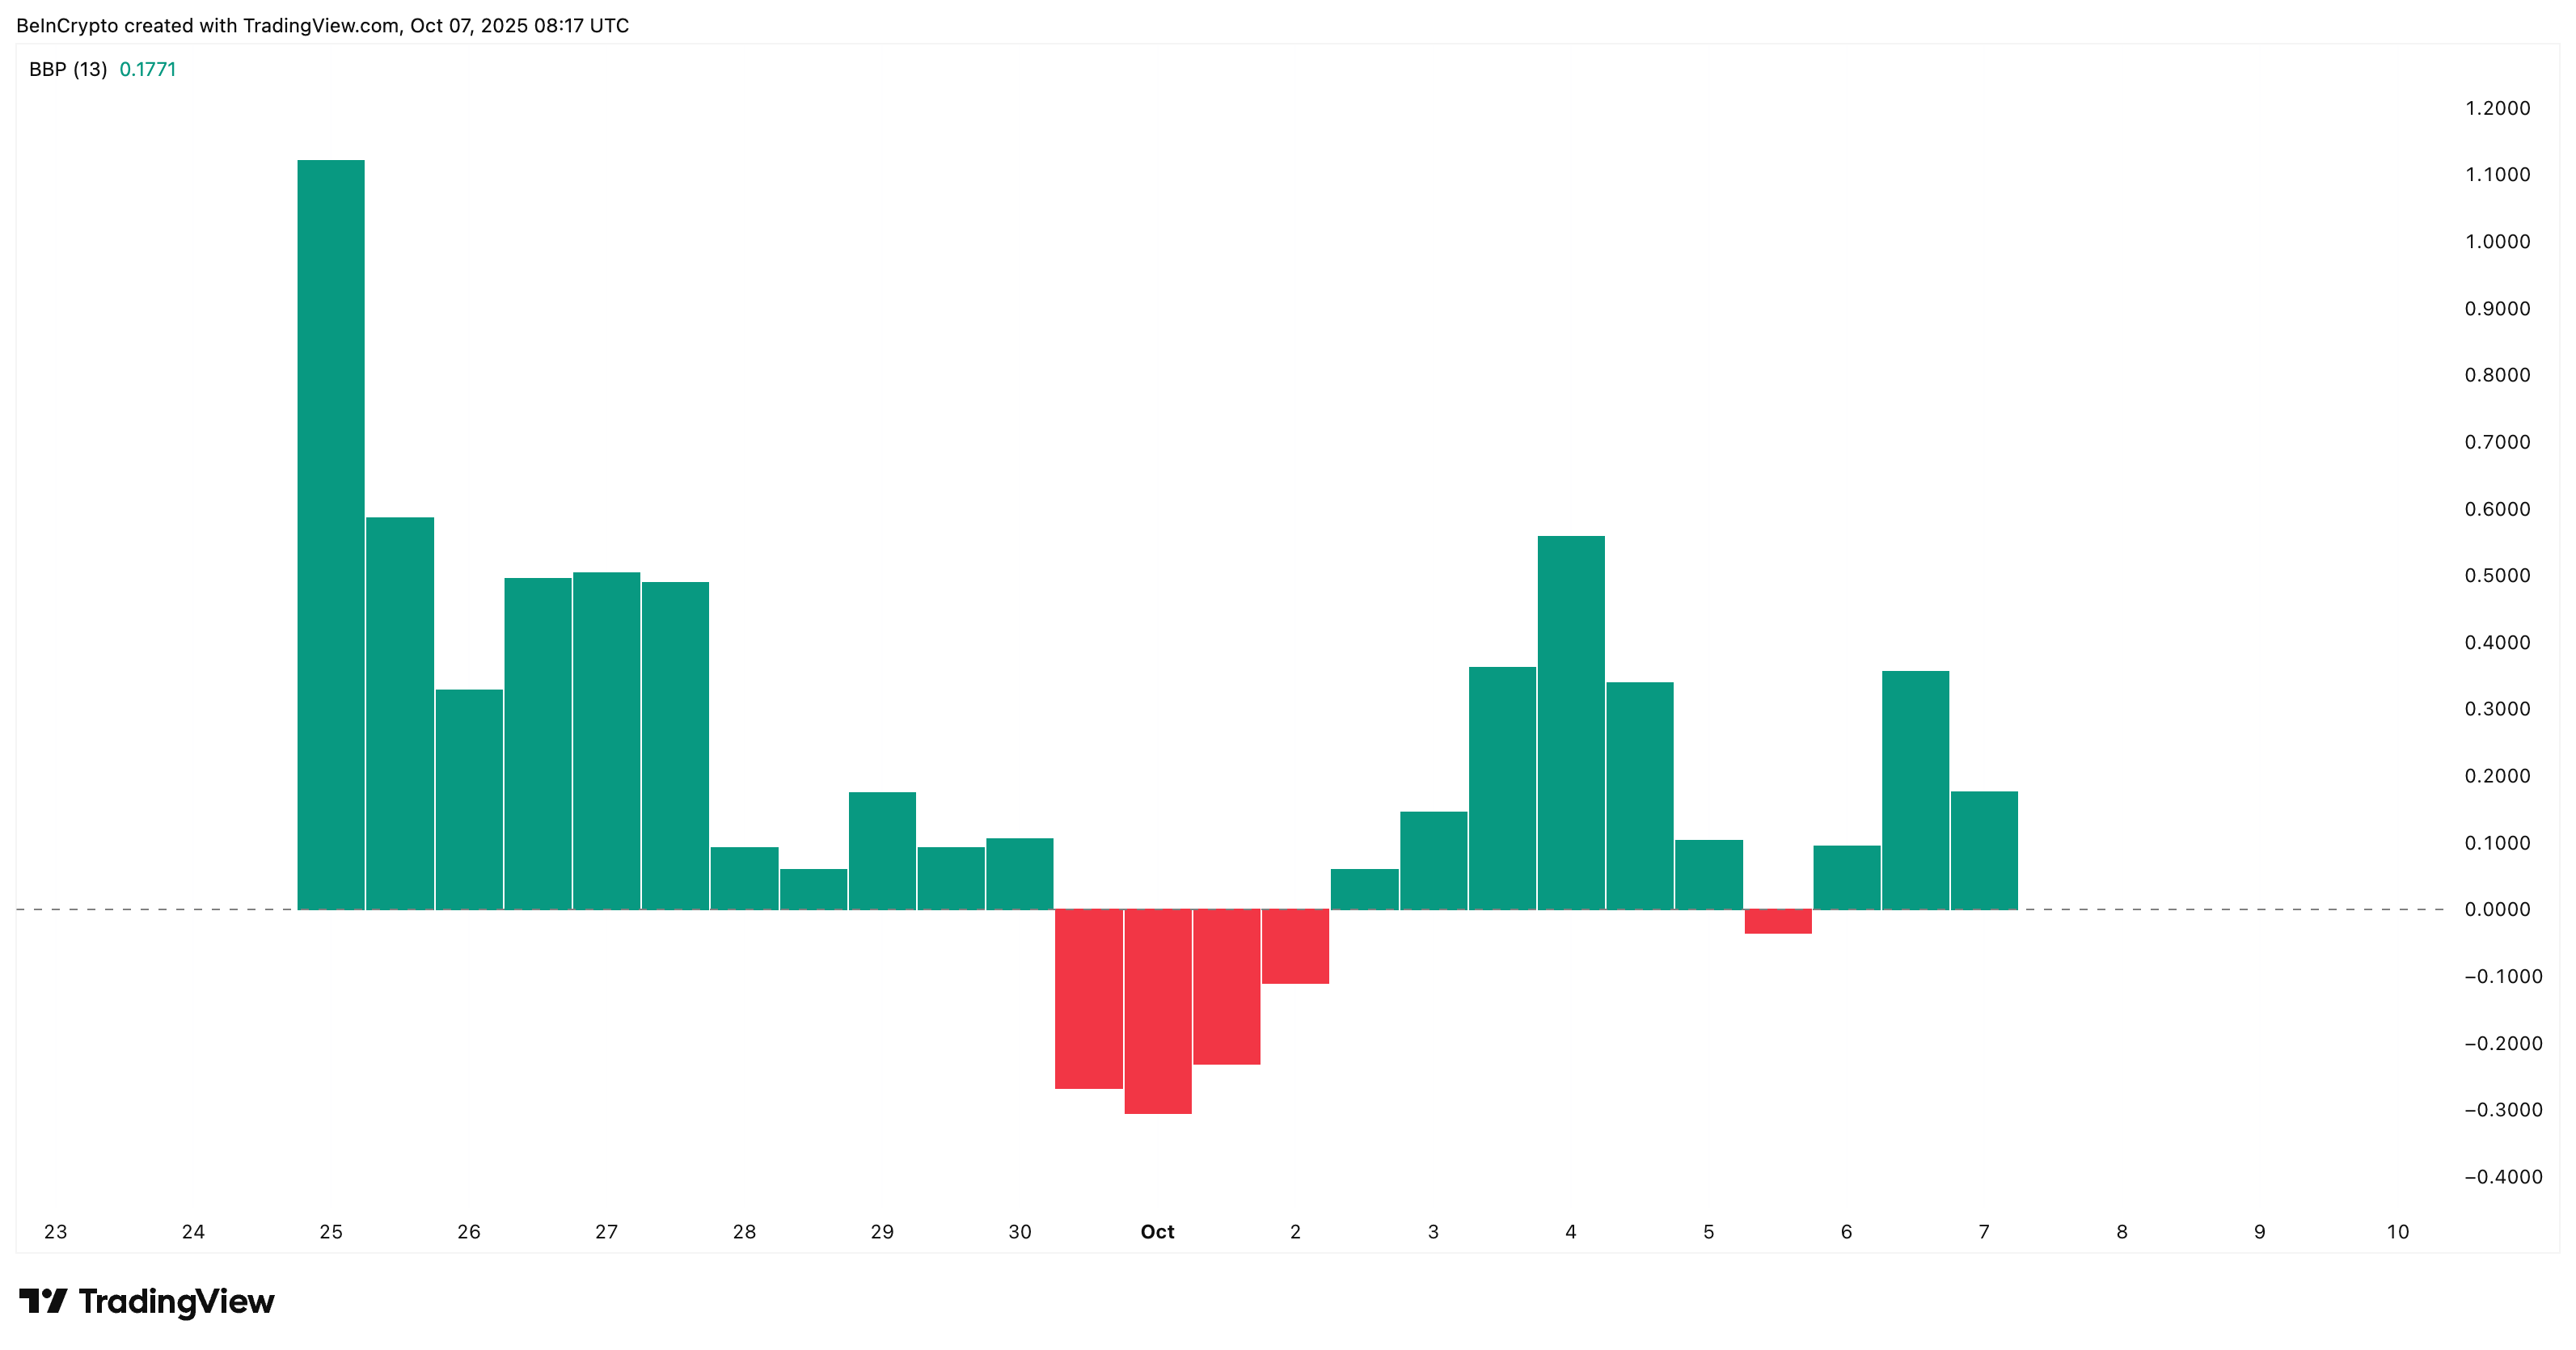
These two readings together suggest the so-called “selling pressure” might be a liquidity mirage, not a trend reversal.
Hidden Bullish Divergence Keeps ASTER Price Uptrend Intact
The 12-hour chart shows ASTER trading within an ascending triangle (with the ascending trendline acting as support), a structure that usually favors buyers.
Between September 30 and October 5, the Relative Strength Index (RSI) — which tracks market momentum — made a lower low, while prices made a higher low. This is called a hidden bullish divergence, a pattern that often confirms the continuation of an uptrend courtesy of fading selling pressure.
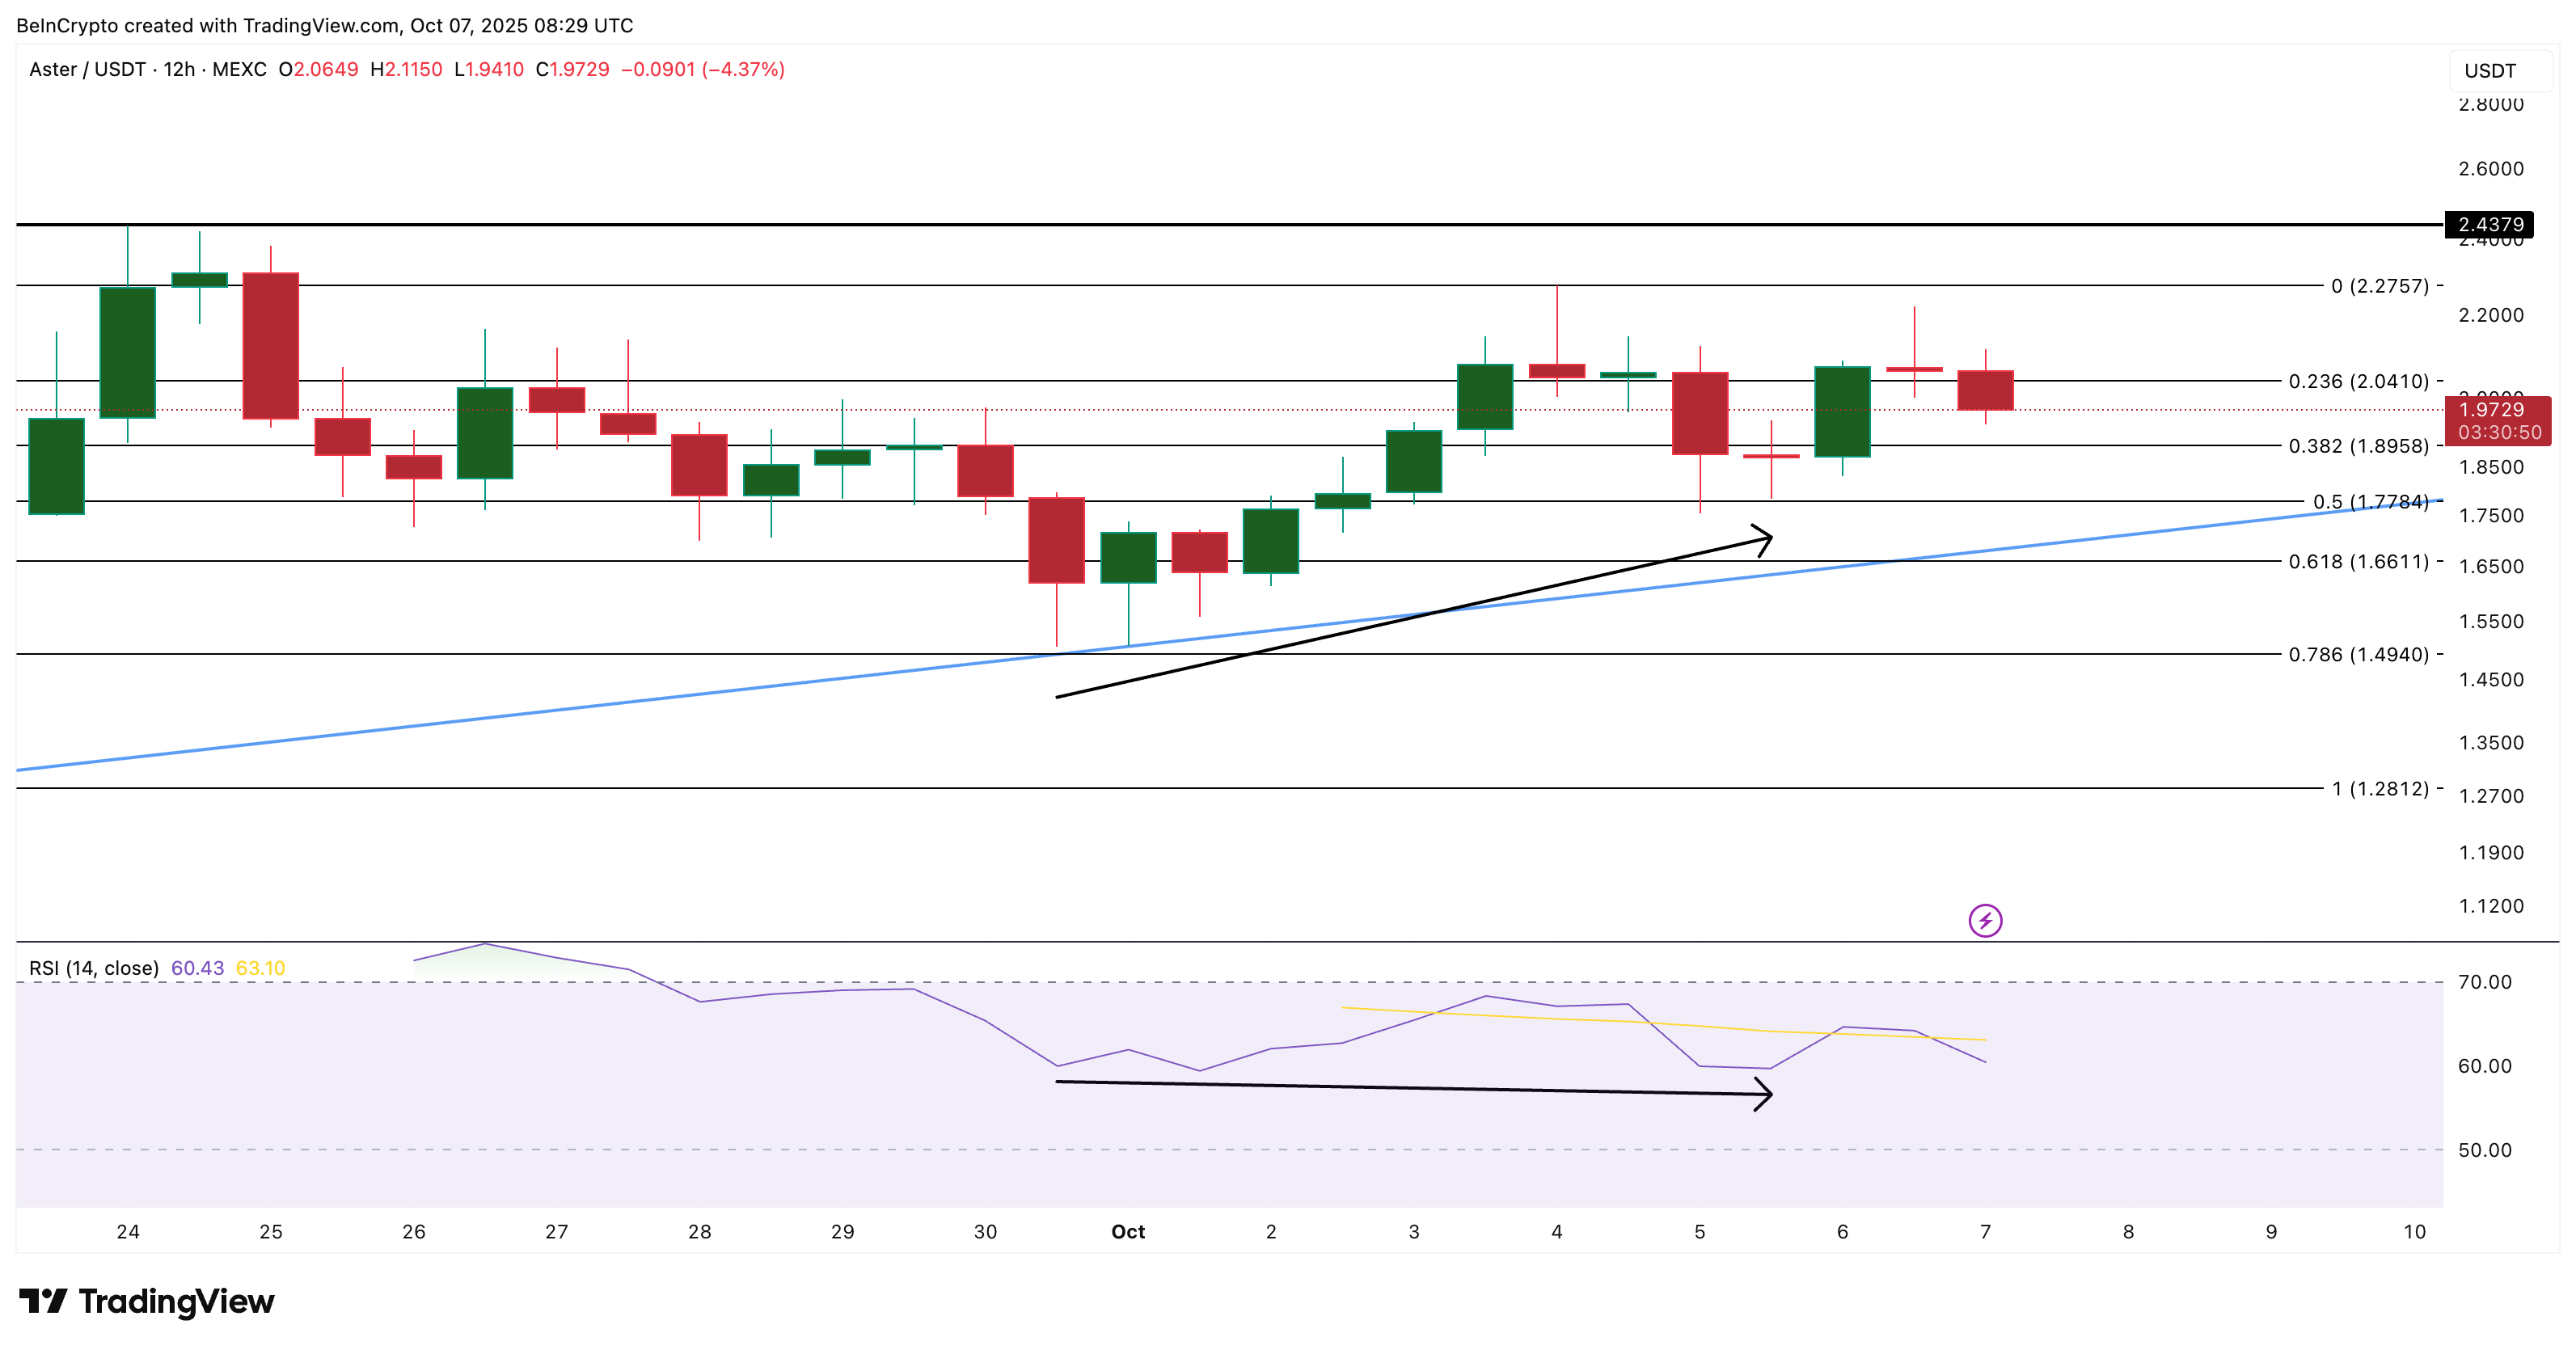
Key resistance sits at $2.04, $2.27, and $2.43 (ASTER’s all-time high). A 12-hour candle close above $2.27 would confirm breakout strength and could open the door to a new high above $2.43.
However, if the ASTER price dips under $1.77 and then under $1.66, thereby breaching the triangle on the downside, the bullish hypothesis would get invalidated.
As long as RSI stays above 50 and BBP remains positive, bulls hold the edge. For now, ASTER’s price action tells a simple story: the big holders haven’t left the table — and neither should the market’s attention.
