


Ark (ARK) aims to create an entire ecosystem of linked blockchains. On Mar 4, 2019, a core update (Core v2.2) was announced. It is planned for Mar 11.
Slight increases in value have been observed since Mar 4. As the update grows nearer, the price may continue to rise. However, if the update does not generate investor and trader attention, it may have little effect on the overall price.
Key Highlights
- A flash crash caused rapid decreases in Ark’s value on Feb 17. A second market-wide flash crash followed on Feb 24.
- Ark is currently trading below the lows experienced after the second crash.
- Price recently broke out of a descending wedge.
- The breakout was preceded by bullish divergence.
- There are resistance areas near $0.61, $0.65 and $0.72.
The Start of The Drop
After reaching highs of over $0.80, Ark suffered a flash crash on Feb 17, 2019. Its price fell to around $0.56. After a weak rebound, the price continued to make lower lows until a second flash crash occurred on Feb 24.
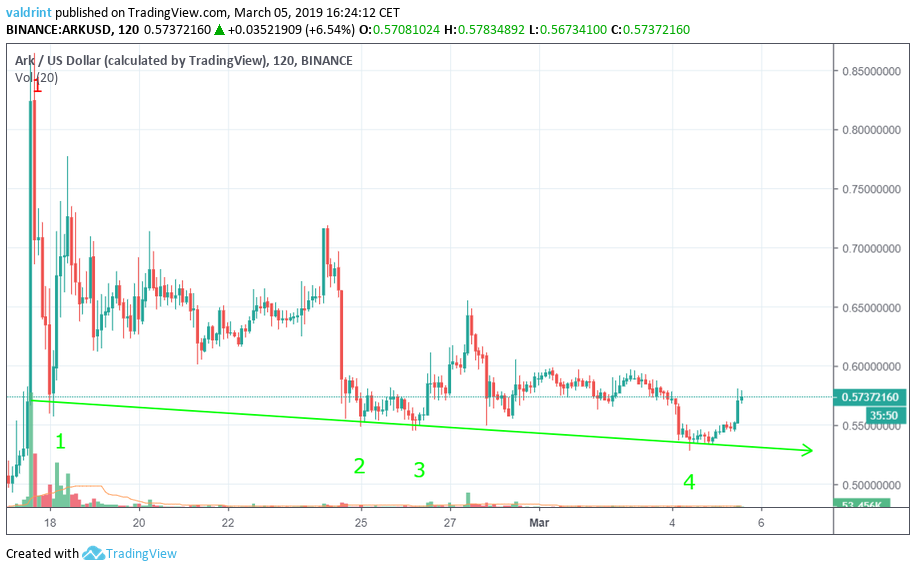
Subsequent average prices were slightly lower than after the first crash. Gradual volatility precipitated an unsuccessful recovery. ARK was trading at its lowest lows on Mar 4 before a slight price increase.
Tracing the descending lows generates a downward trending support line. ARK has been mostly trading above the line with only slight, almost unnoticeable dips breaks. The descending support line was validated four times.
The Descending Wedge
After the crash of Feb 17, the unsuccessful rebound attempt ended at $0.07.
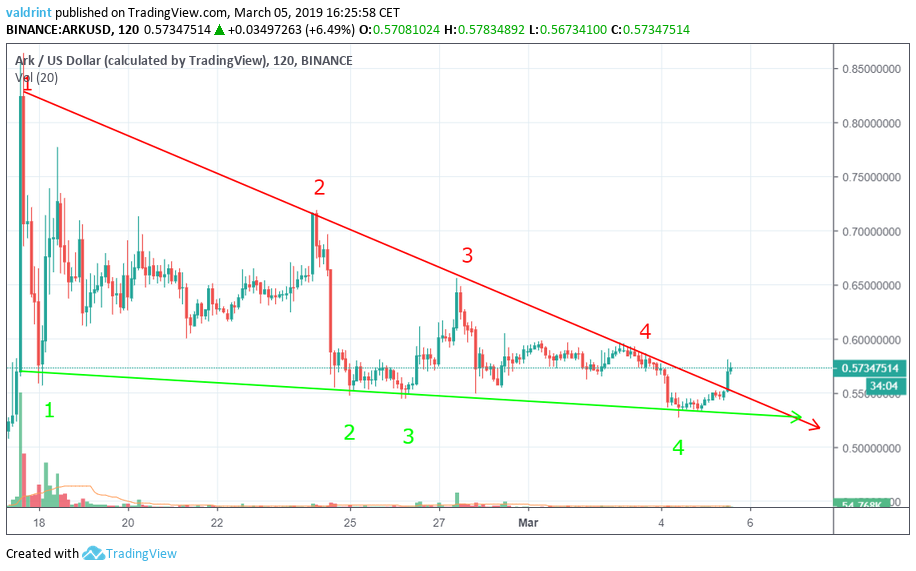
The resistance line is created by the inverting the method used to trace the support line. Instead of connecting recent lows, recent highs are connected. Like the support, the resistance line was also traced along four points.
Initially, the price increased at a slower rate than that projected by the line, but it reverted to the mean at the fourth high. On Mar 5, ARK broke the resistance line.
Furthermore, the resistance and support lines have combined to create a descending wedge. When found in a downtrend, it is considered a bullish reversal pattern. Price increases may be expected to continue over the short term period.
Identifying The Divergence
The moving average convergence divergence (MACD) is a trend indicator that shows the relationship between two moving averages (long and short-term) and the price. It is used to gauge the strength of a move.
The relative strength index (RSI) is an indicator which calculates the size of the changes in price in order to determine oversold or overbought conditions in the market.
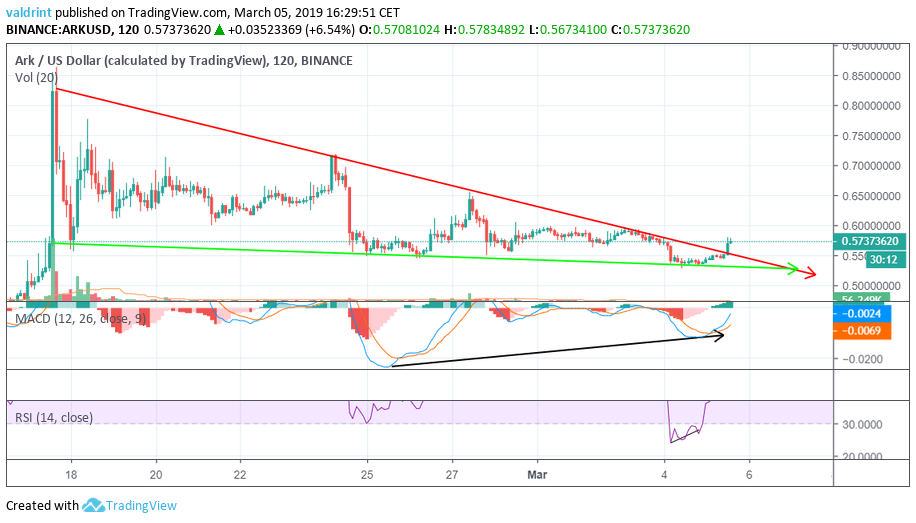
While price made successive lower lows on Feb 26 and Mar 4, the MACD made lower highs. This is called bullish divergence and precedes increases in price.
The divergence in the RSI occurred during Mar 4. It is not significant compared to the divergence in the MACD, but can be used to confirm the validity of the divergence.
After The Breakout
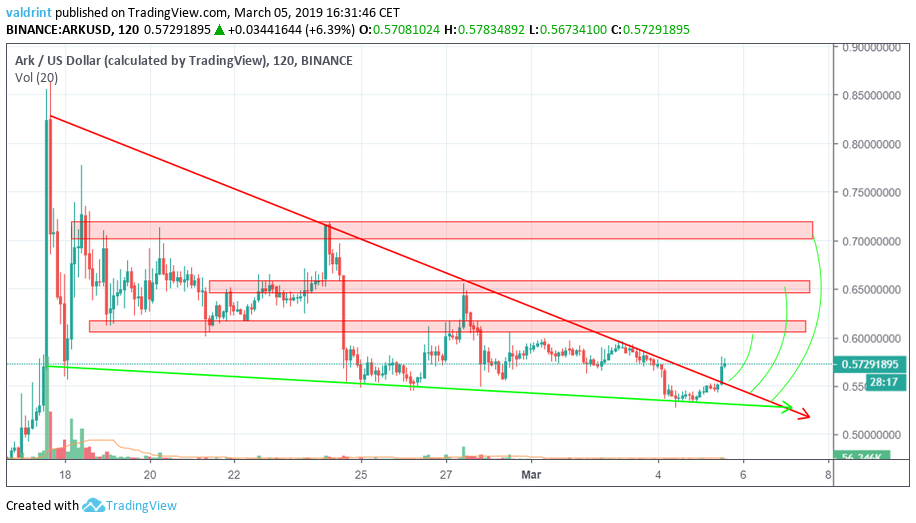
Resistance areas are formed when the price reaches a certain level several times. They can act as a ceiling that prevents the price from breaking further upward. In the case of a breakout, they can be used to effectively predict where price movements will come to a stop.
Ark broke free of the resistance line on Mar 5.
The use of divergence in the RSI and the MACD combined with the use of support/resistance lines can be effective in predicting a reversal. The validity of the movement increases if bullish divergence occurs in a bullish pattern and vice versa.
Given the above information, the price of ARK may increase to the first resistance area near $0.61 and possibly to the other two at $0.65 and $0.72 respectively.
Do you think that the price of ARK will stop at the first resistance area or will prices keep growing from there? Let us know your thoughts in the comments below, and check our out latest Bitcoin Price Predictions!
Disclaimer: This article is not trading advice and should not be construed as such. Always consult a trained financial professional before investing in cryptocurrencies, as the market is particularly volatile.


