


The Arbitrum (ARB) price is navigating through a challenging period, highlighted by several indicators suggesting investor interest might be waning.
The most striking is the Relative Strength Index (RSI) sliding to its lowest since November 2023, combined with a steep decline in daily active addresses. This confluence of factors points to a complex landscape for ARB, raising questions about its near-term price trajectory.
ARB Metrics Indicate Cooling Interest
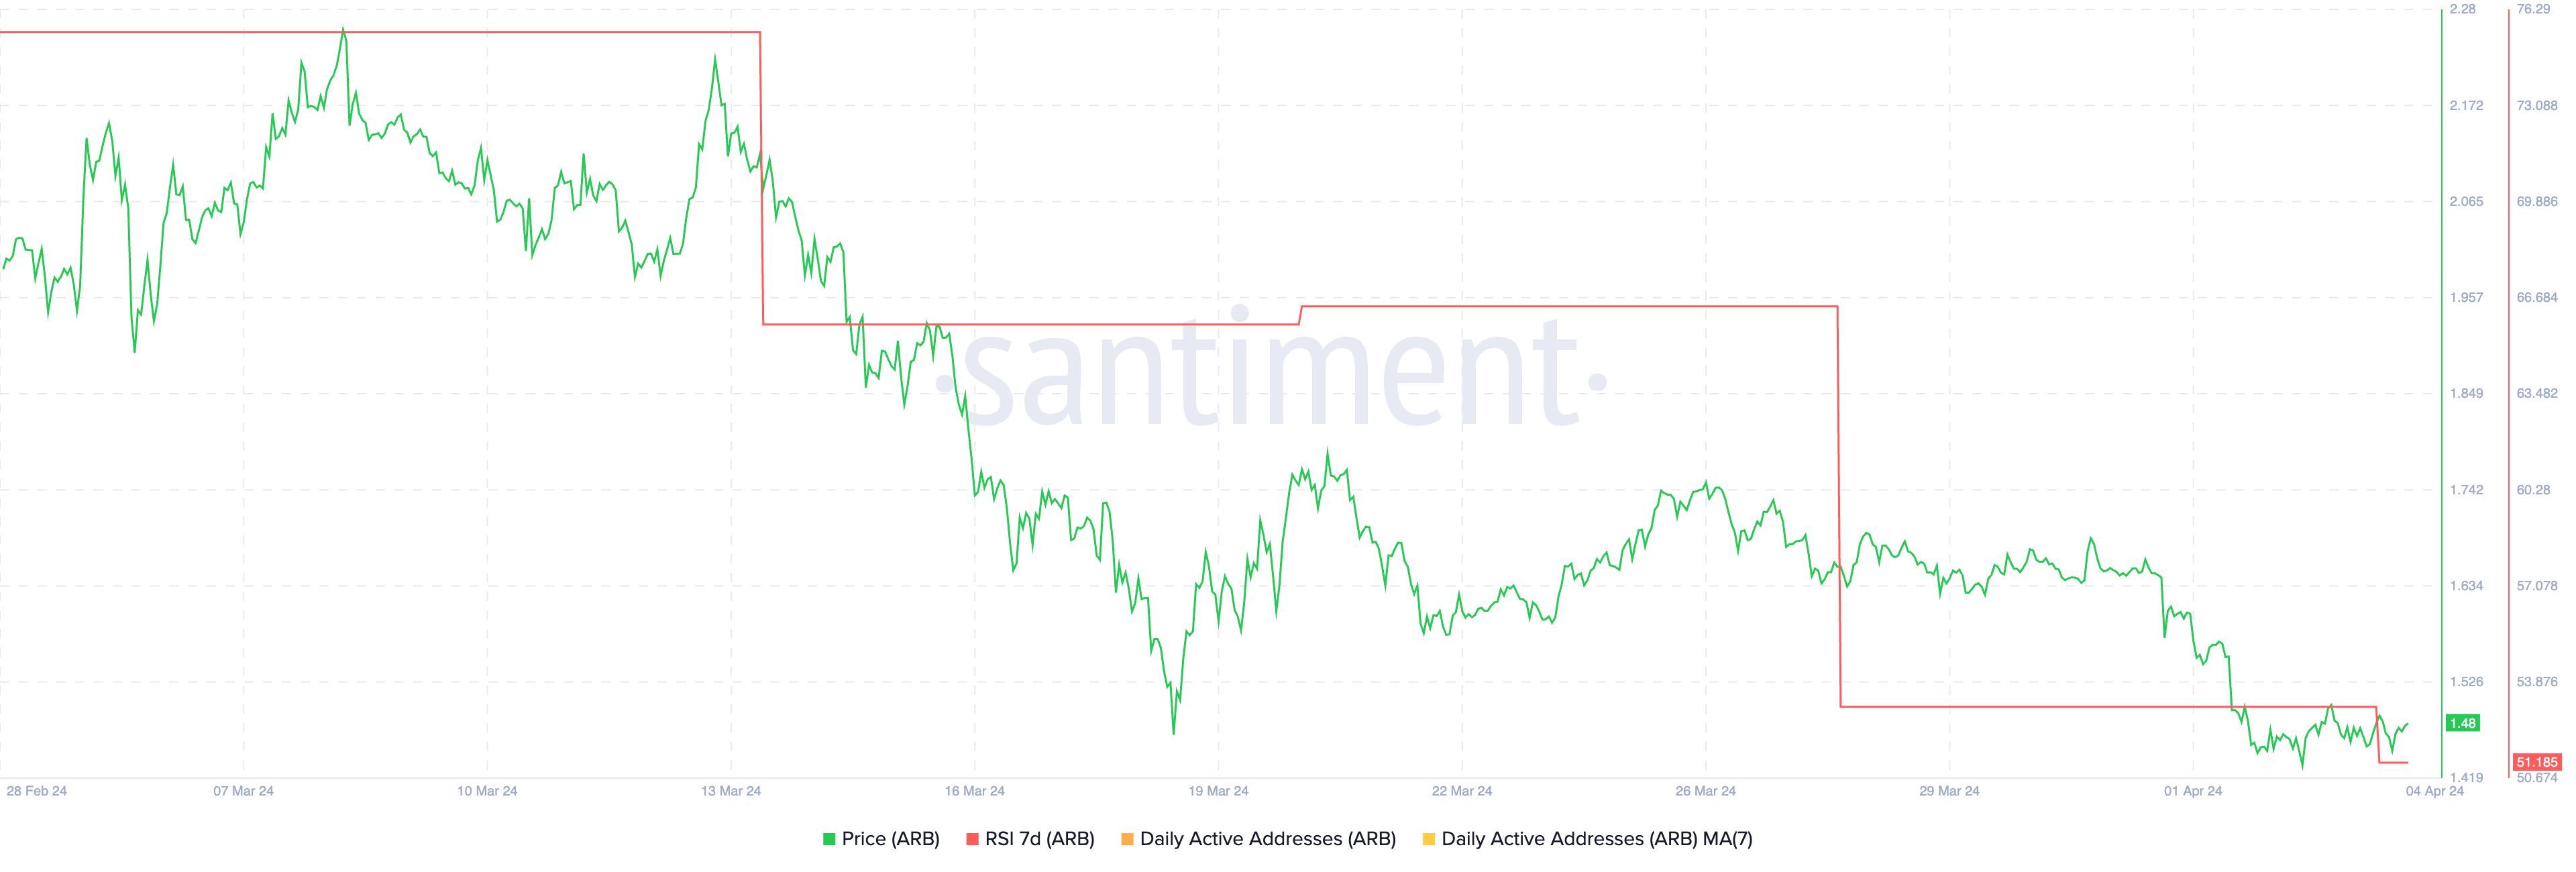
The RSI, a momentum oscillator that measures the speed and change of price movements, has shown a noticeable decline from a high of 75 on March 13 to 51. This indicates a shift from previously strong buying pressure to a more neutral stance.
Despite being in the neutral range, this gradual decline hints at a slowdown in market activity and potential challenges in price appreciation if the trend of diminishing interest continues.
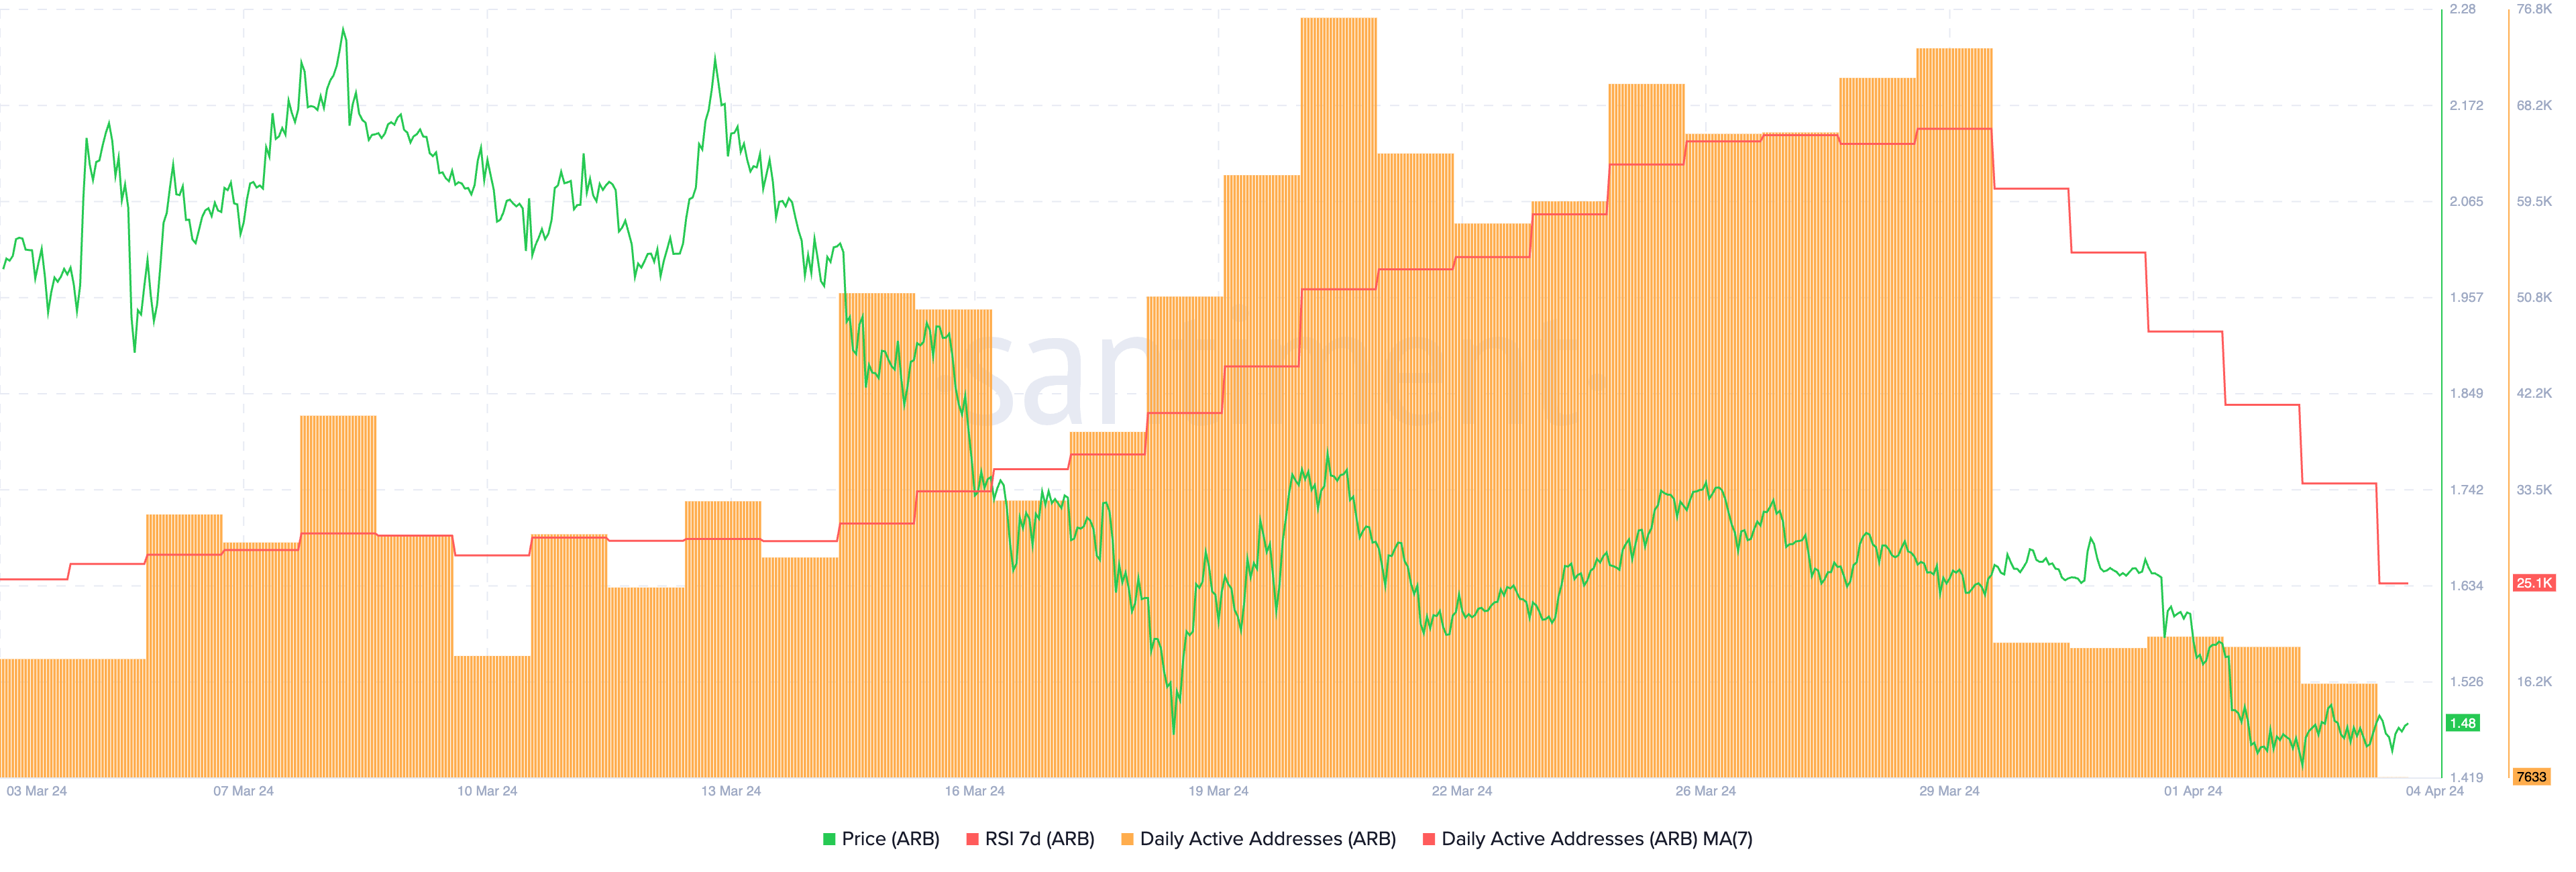
Moreover, daily active addresses on the Arbitrum network have fallen to one of the lowest levels since January. This suggests a notable decrease in user engagement and transactions.
Indeed, this decline, particularly sharp since March 29, is a bearish signal, reflecting waning interest or use that could negatively affect ARB’s demand and price.
Read More: A Guide to Arbitrum Blockchain Explorer
Arbitrum Price Prediction: Lower Lows
March saw a death cross occurrence in ARB’s Exponential Moving Averages (EMAs), a bearish signal typically heralding a potential bear market. Since this event, Arbitrum’s price has faced a sharp 44.62% correction.
If the current downtrend exacerbated by competition among Ethereum scaling solutions continues and critical support levels at $1.22 and $1.03 are breached, ARB could potentially fall to as low as $0.98.
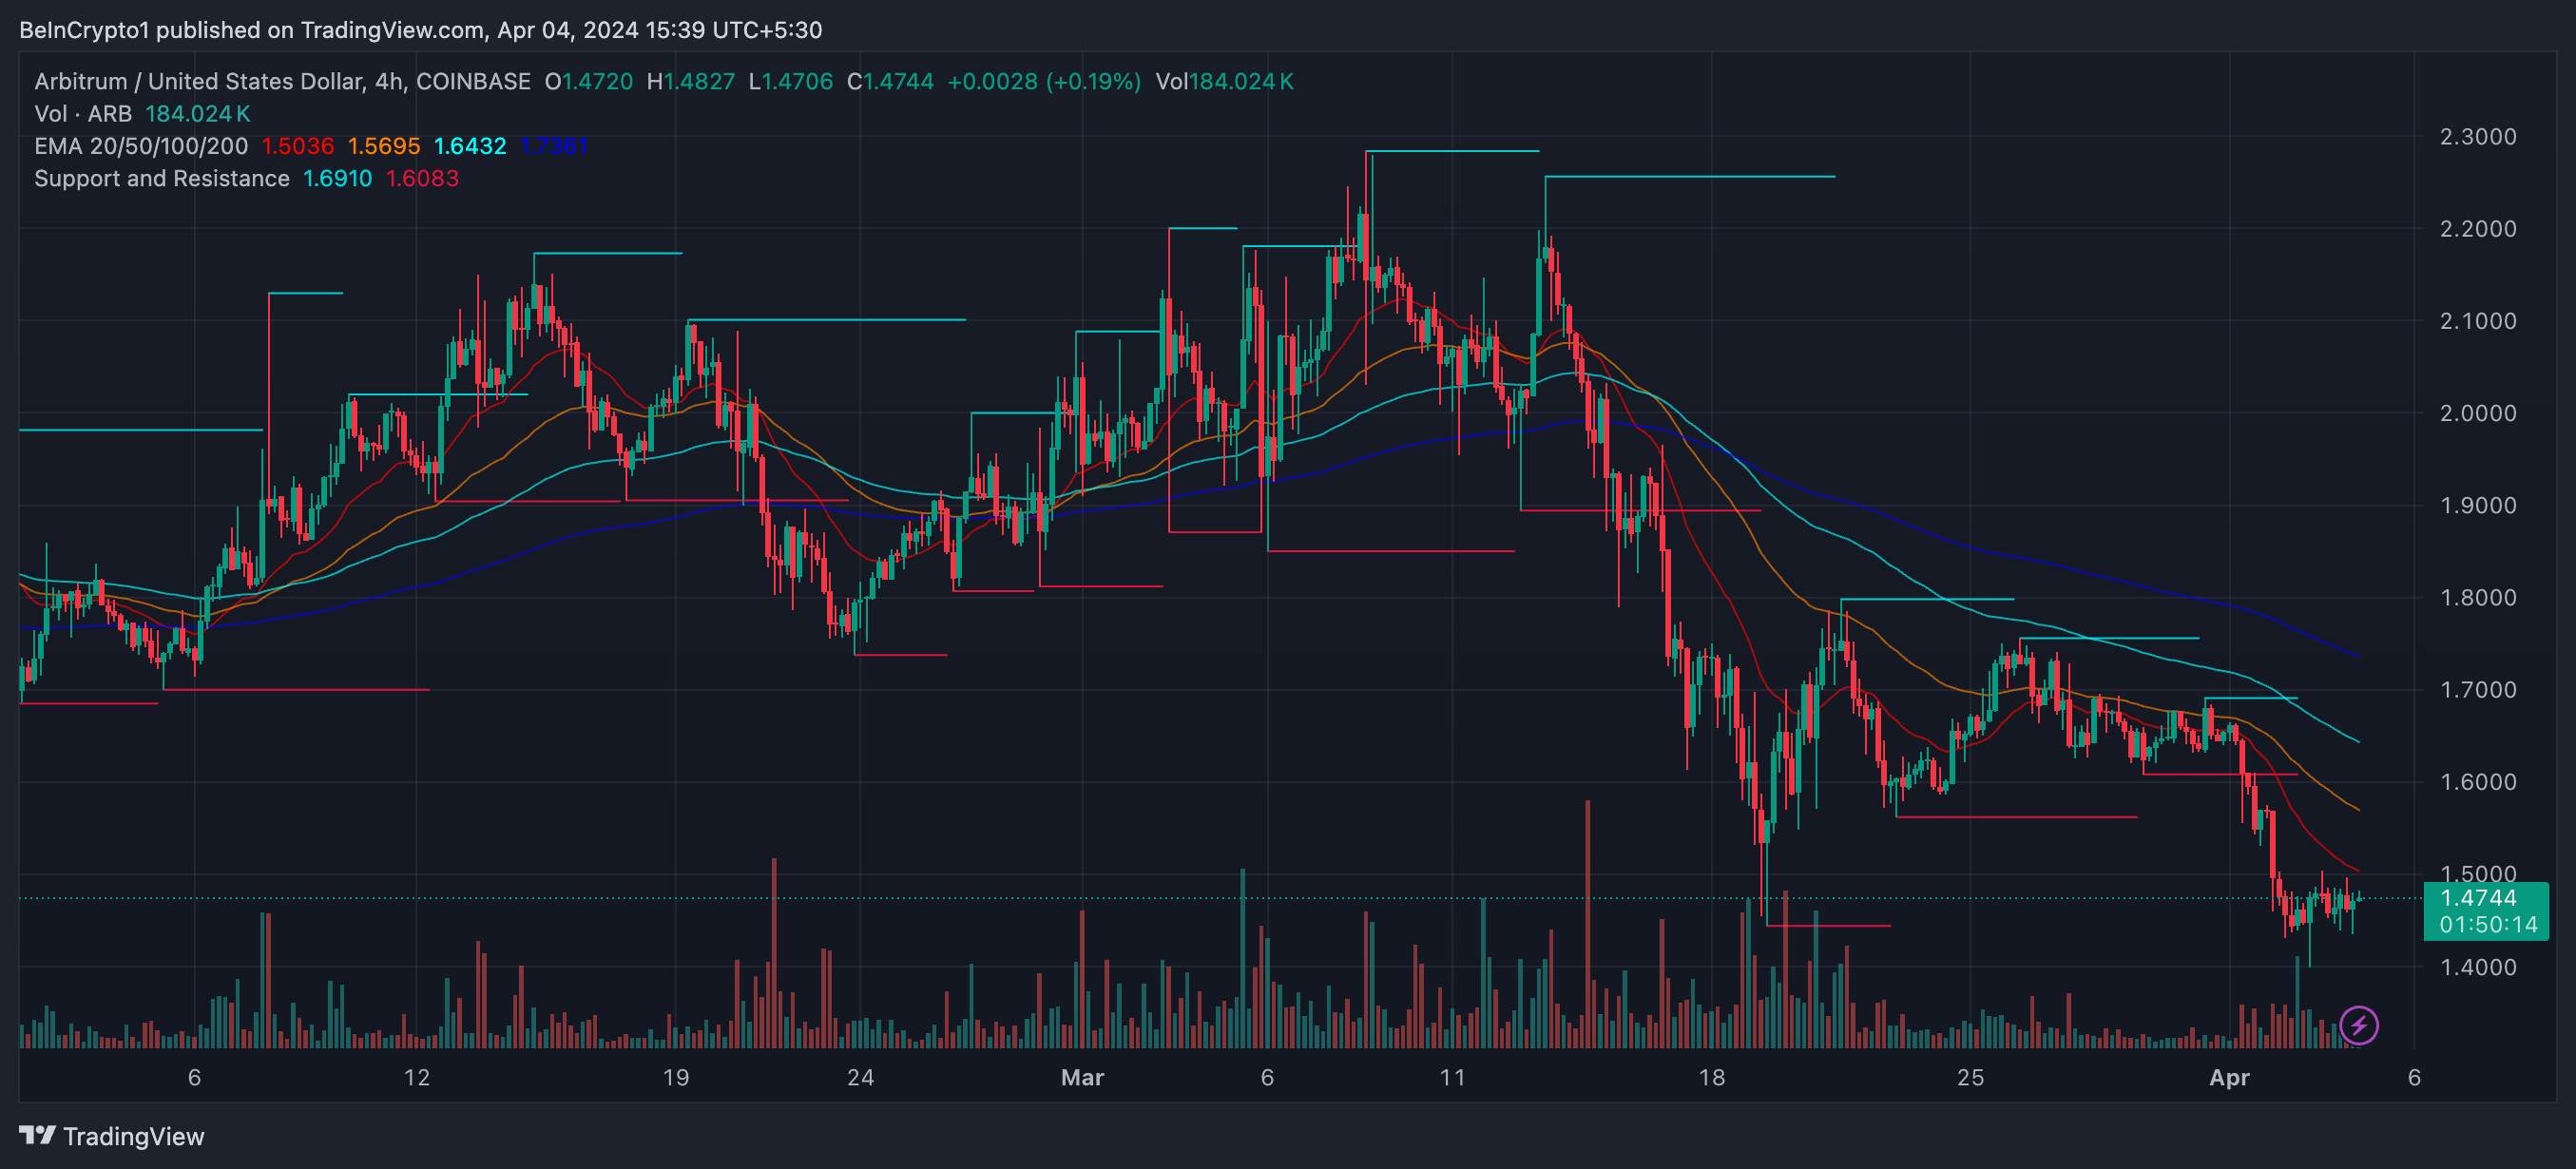
Conversely, a shift in market sentiment could propel ARB to recovery targets of $1.75 or $1.80, offering hope for a bullish reversal amidst current market challenges.


