


Aptos Price Prediction: APT price has completed a corrective structure and is expected to break out from the current corrective pattern.
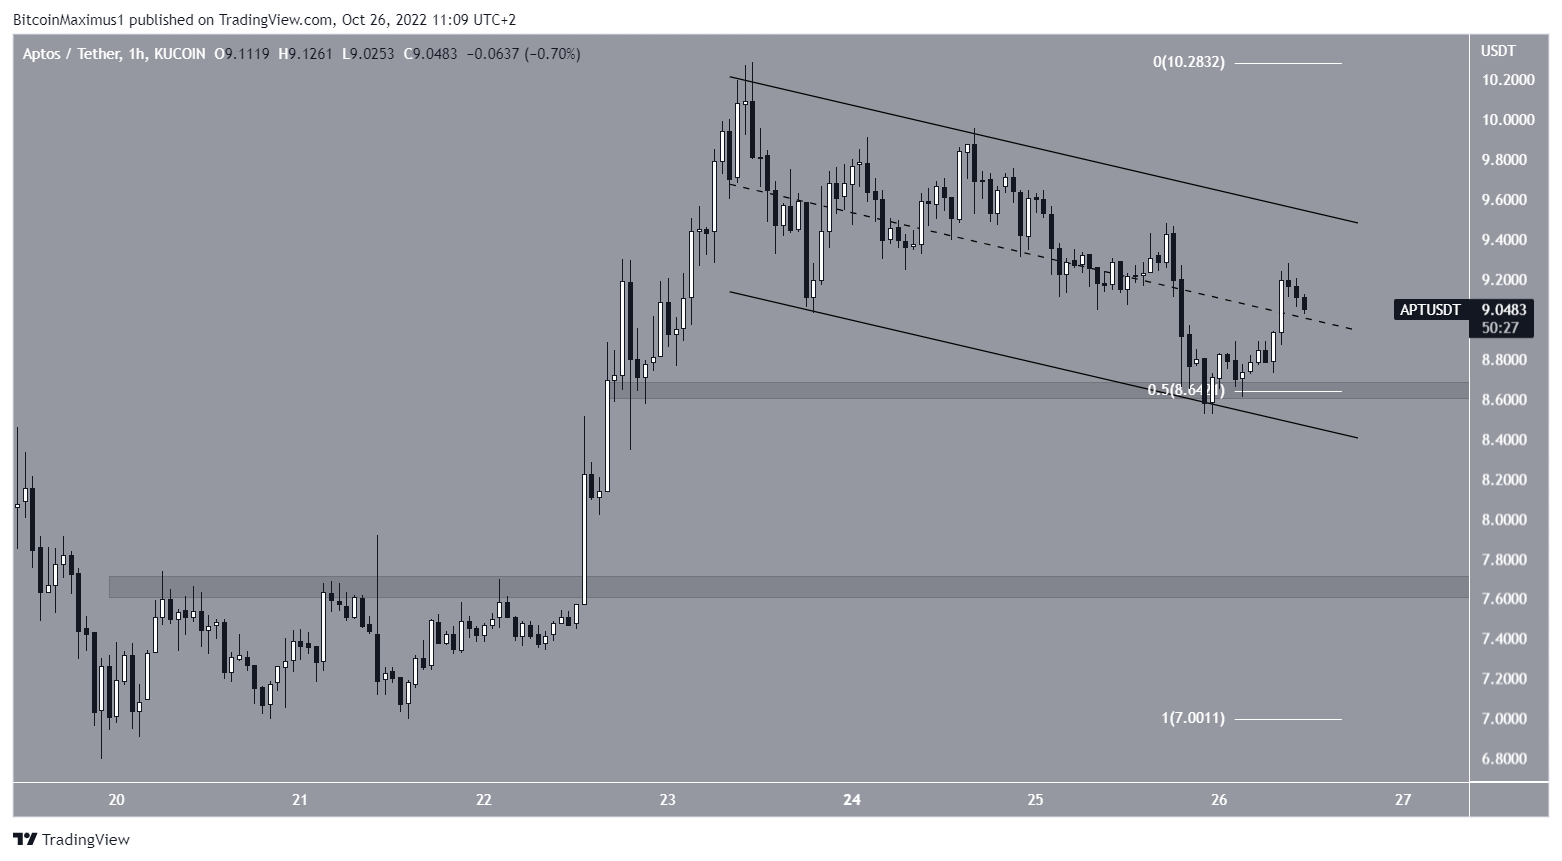
APT price has been decreasing inside a descending parallel channel since reaching a high of $10.27 on Oct. 23. Descending parallel channels usually contain corrective movements. If that is the case, a breakout from the channel would be expected.
However, neither the resistance nor support lines have been validated sufficient times. Additionally, Aptos price is at risk of breaking down below the middle of the channel. If this occurs, it will dampen the chances of a potential breakout.
The main support area for APT price is at $8.65. This is both the 0.5 Fib retracement support level and a horizontal support area. So, a potential breakdown below it could be the catalyst for the acceleration of the downward movement.
Aptos Price Prediction: Wave Count Supports Breakout
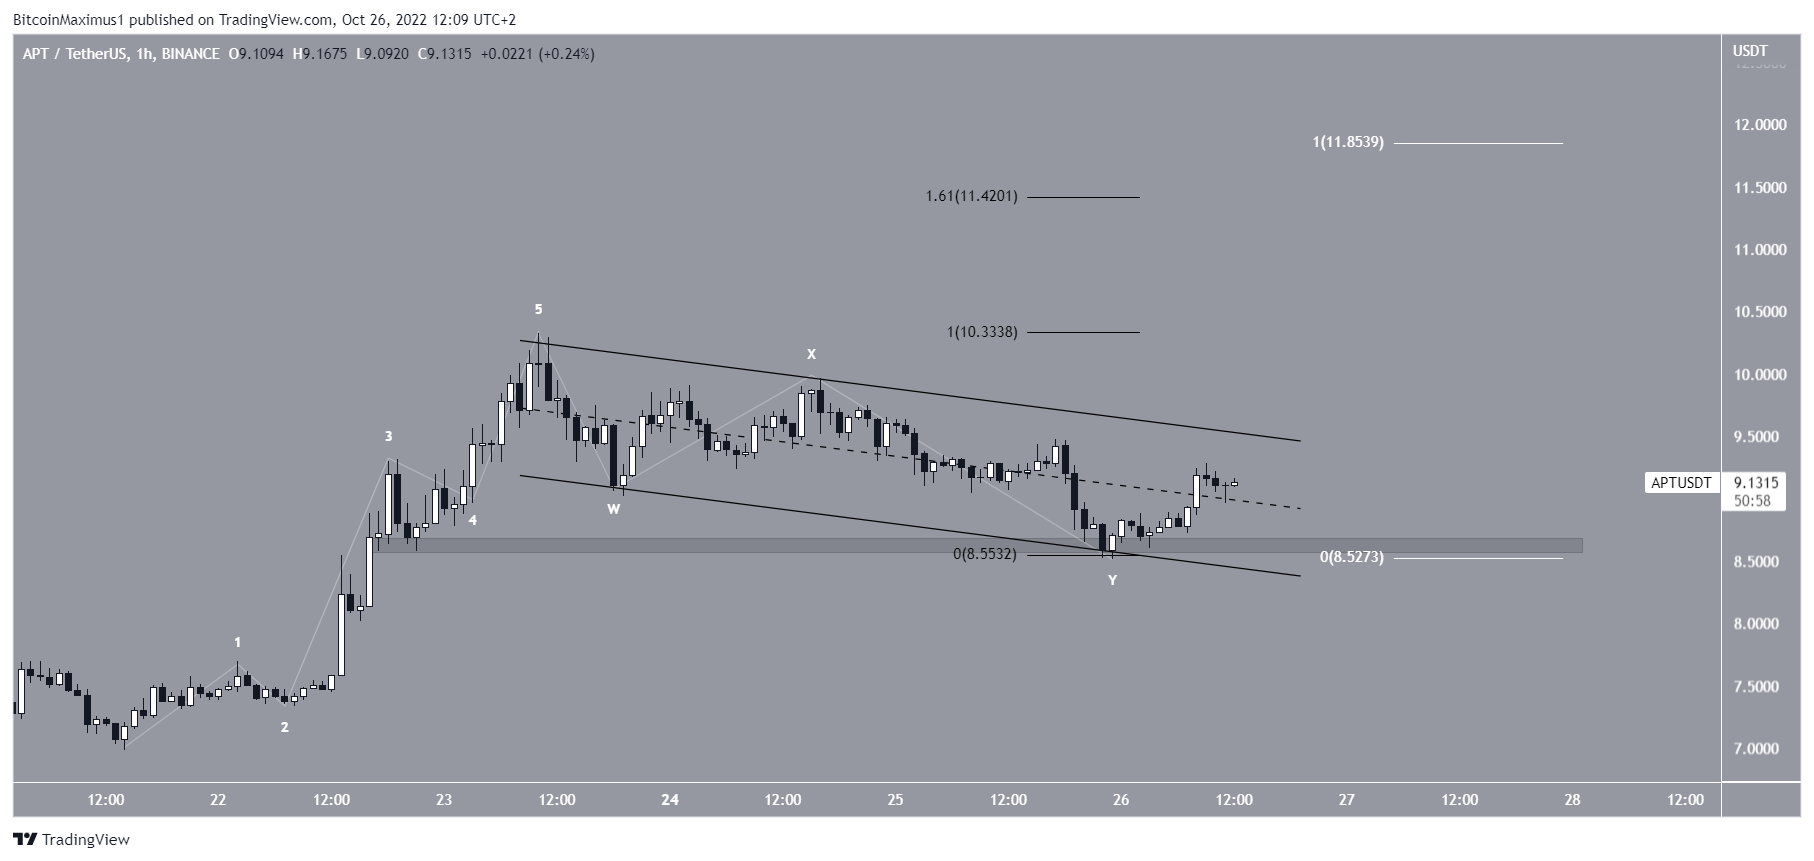
The wave count also gives a bullish APT price prediction.
Measuring from the Oct. 21 low, Aptos price seems to have completed a five-wave upward movement (white). Afterward, the movement inside the channel is likely a W-X-Y corrective structure. Due to the length of the correction, it is likely that the decrease is complete.
If so, a breakout from the channel is expected, which would confirm the continuation of the upward Aptos price movement. The first potential target for the top of the increase is at $11.42, created by the 1.61 external Fib retracement (black) when measuring the entire drop.
If both upward movements have the same height, this will lead to an APT price high of $11.85. Therefore, the $11.40-$11.85 area is likely to act as the top for the future Aptos price.
For the latest BeInCrypto Bitcoin (BTC) and crypto market analysis, click here
Disclaimer: BeInCrypto strives to provide accurate and up-to-date information, but it will not be responsible for any missing facts or inaccurate information. You comply and understand that you should use any of this information at your own risk. Cryptocurrencies are highly volatile financial assets, so research and make your own financial decisions.


