

The Aptos (APT) price broke out from a resistance pattern and could soon being a massive upward movement toward a new all-time high.
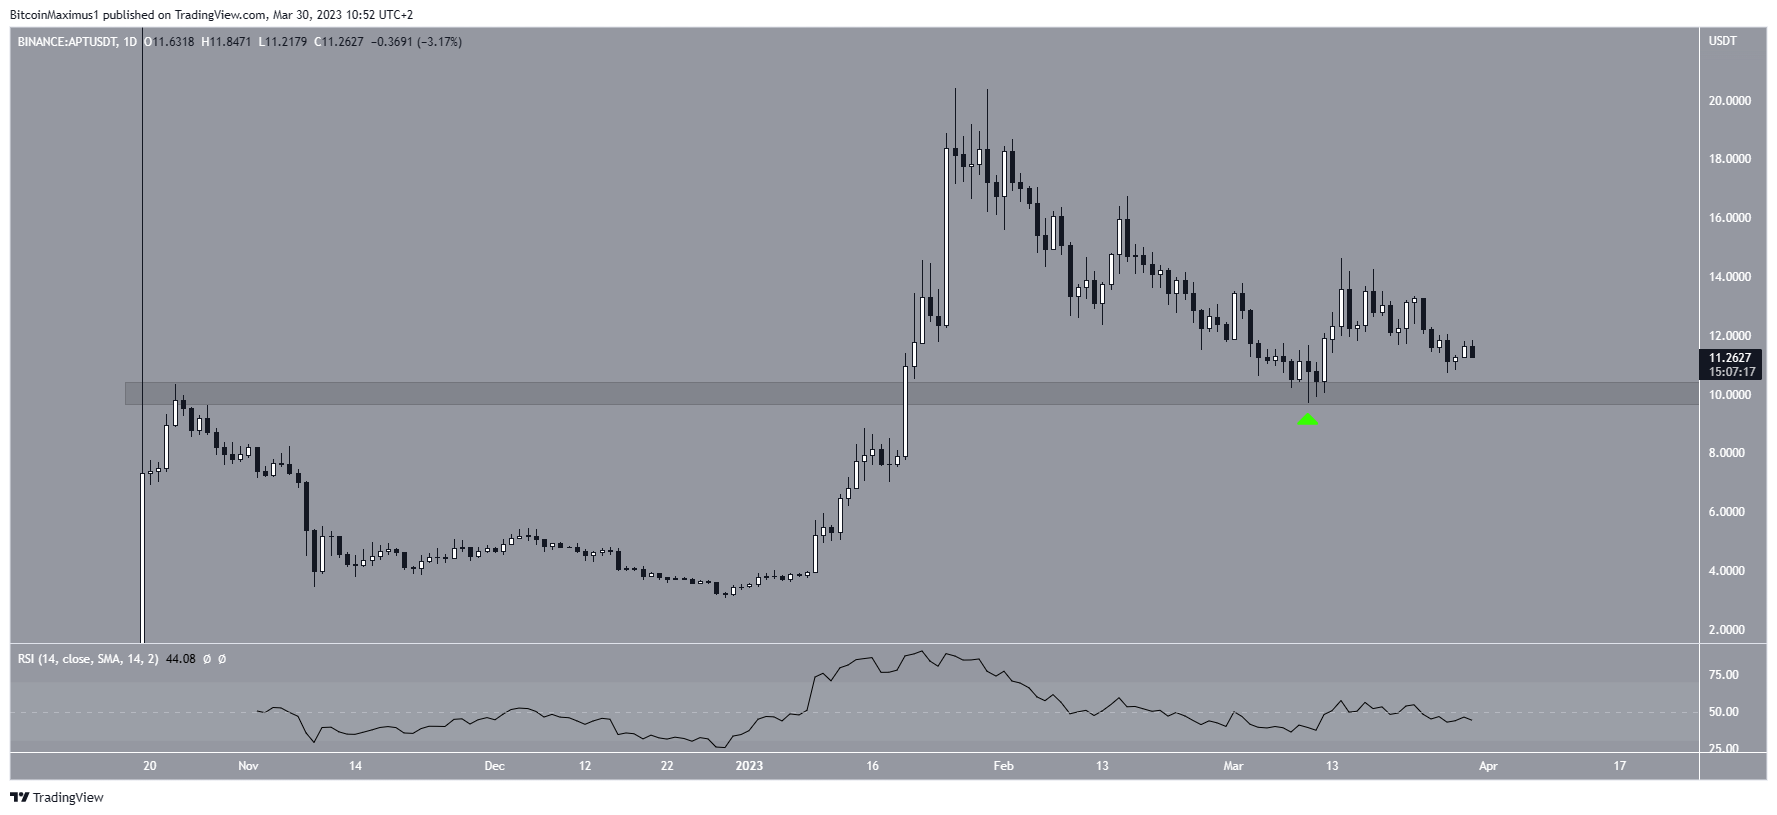
The APT price has fallen since reaching an all-time high of $20.40 on Jan. 26. The decrease led to a low of $9.70 on March 10 before the price bounced (green icon).
The bounce validated the $10 horizontal area, which previously had provided resistance.
However, despite the bounce, the daily RSI failed to move above 50 and has fallen below it again. Moreover, the price is very close to the $10 horizontal area once more.
As a result, neither the price action nor technical indicators provide decisive clues for the trend’s direction.
Aptos (APT) Price Wave Count Suggests Big Move Ahead
The wave count for APT provides a bullish outlook. After a massive upward movement in the beginning of the year, the APT price corrected under a descending resistance line. The correction ended right at the 0.618 Fib retracement support level at $9.72 on March 10.
The price has increased since and broke out from the descending resistance line two days later.
It is possible that this is the beginning of a new upward movement that will take the APT price toward a new all-time high. In that case, the price could increase to $26.87, the 1.61 external Fib retracement of the previous decrease.
However, the APT price has yet to break out from the $13.65 resistance area. This would confirm the bullish trend reversal.
If the APT price fall below the $9.72 low (red line), a drop to the next closest support at $7.90 could transpire.
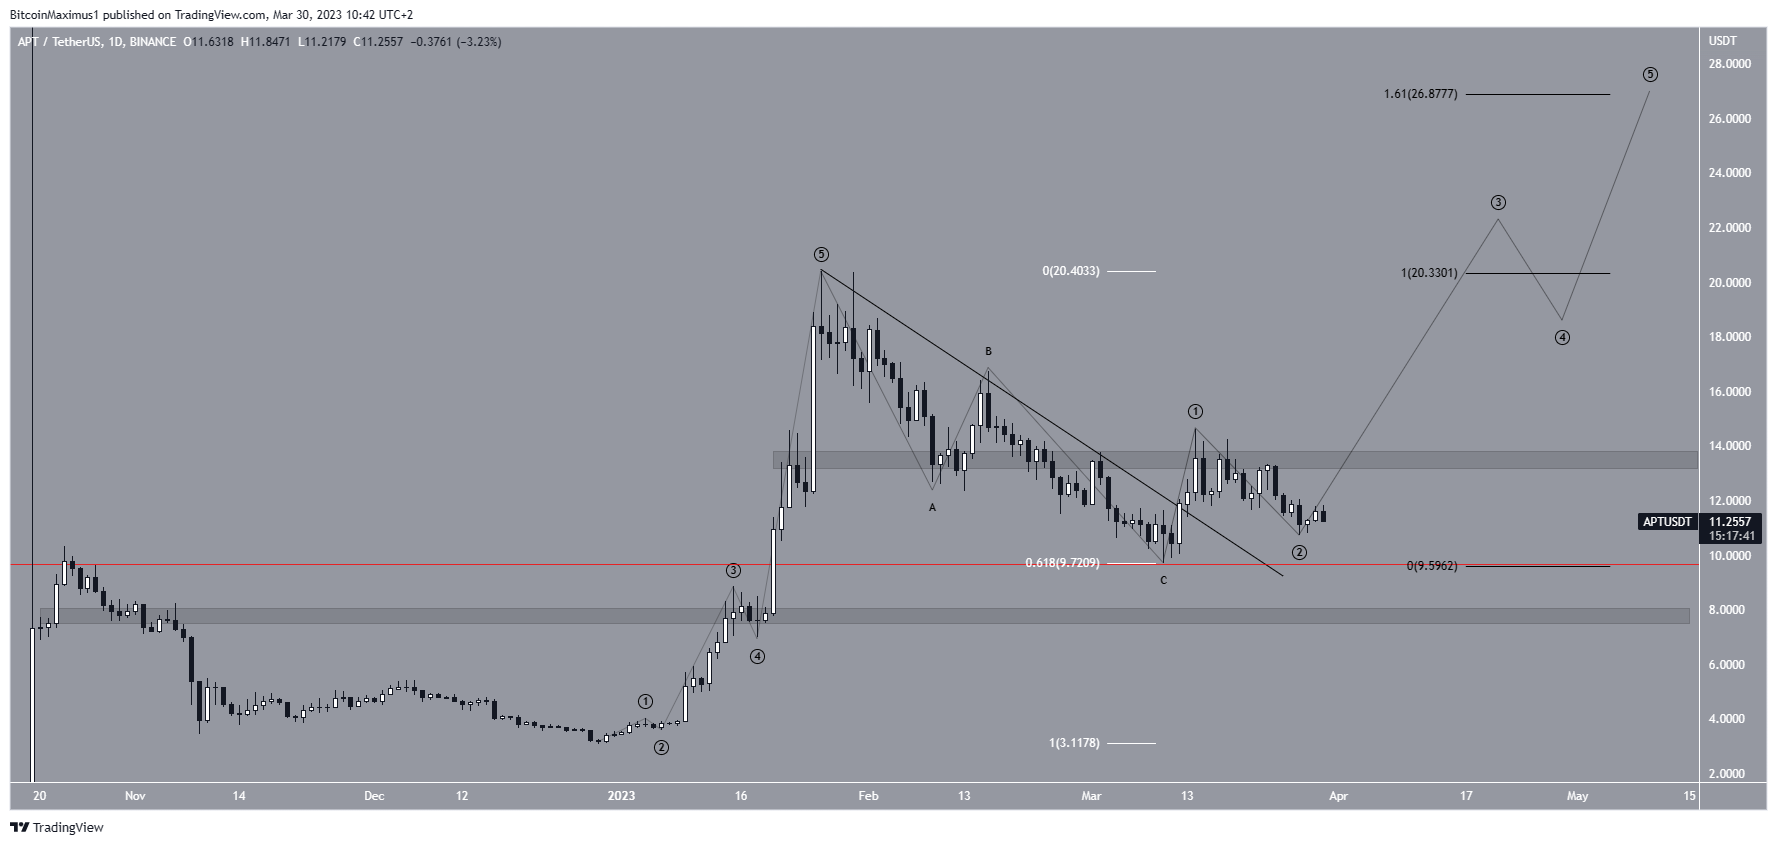
To conclude, the most likely APT price forecast is the acceleration of the increase toward a new all-time high at $26.87. A decrease below $9.72 would invalidate this bullish forecast and could cause a drop to $7.90.
For BeInCrypto’s latest crypto market analysis, click here.
Trusted
Disclaimer
In line with the Trust Project guidelines, this price analysis article is for informational purposes only and should not be considered financial or investment advice. BeInCrypto is committed to accurate, unbiased reporting, but market conditions are subject to change without notice. Always conduct your own research and consult with a professional before making any financial decisions. Please note that our Terms and Conditions, Privacy Policy, and Disclaimers have been updated.
