


The Aptos (APT) price could be in the process of beginning a larger upward movement that takes it toward a new all-time high.
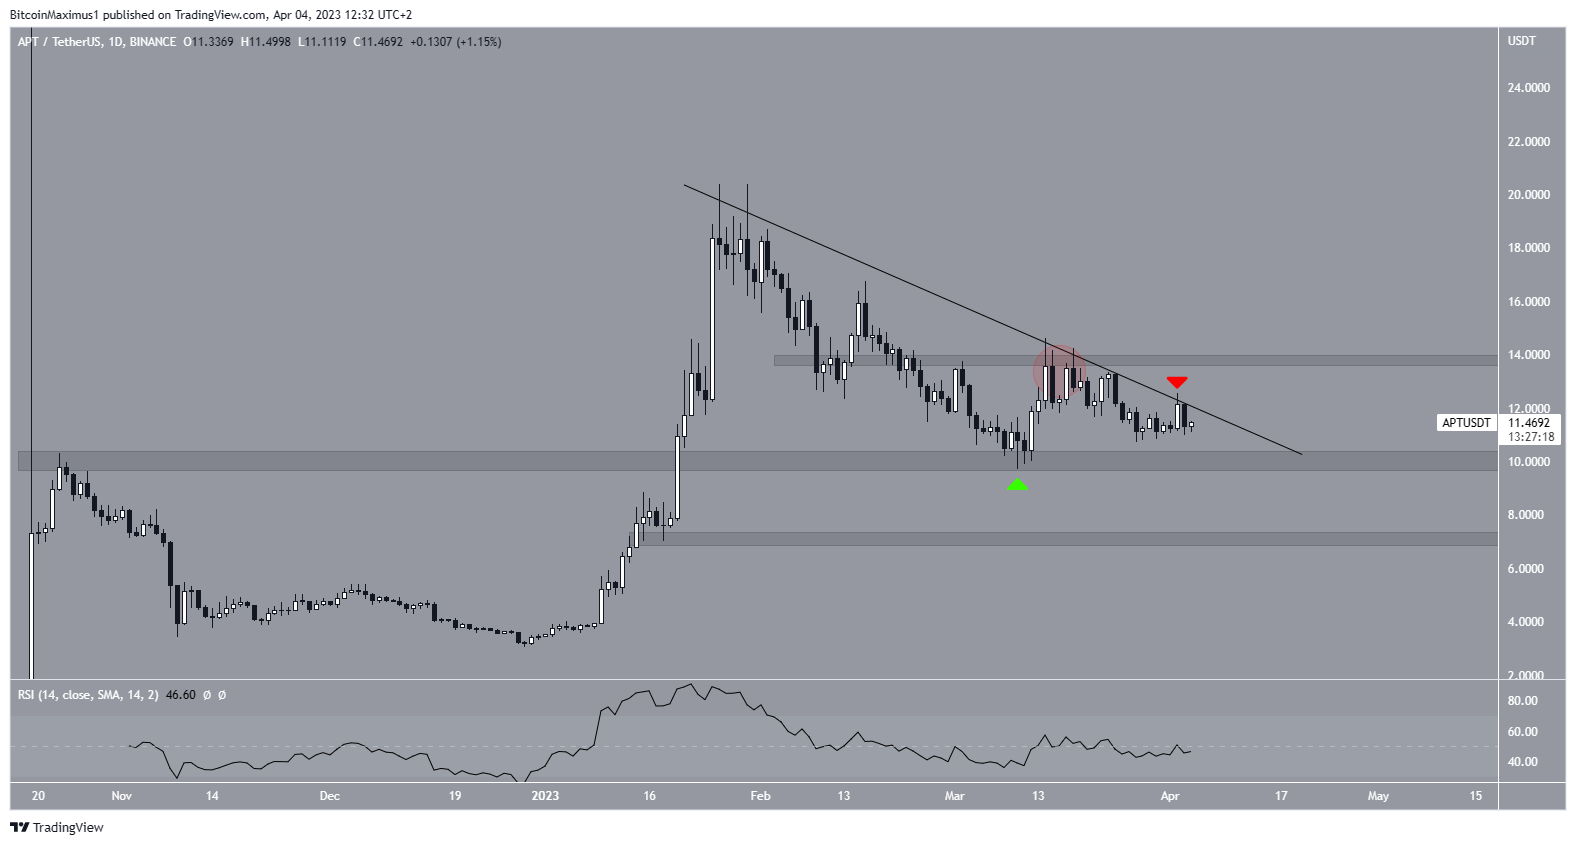
The Aptos price has fallen under a descending resistance line since reaching an all-time high price of $20.40 on Jan. 26. The decrease led to a low of $9.70 on March 10.
While the APT price has increased since it failed to break out from the descending resistance line. Rather, it was initially rejected by the confluence of resistance levels at $13.80 (red circle) before falling alongside the line and suffering another rejection on April 2 (red icon).
The APT price is approaching the convergence between the resistance line and the $10 support area. So, a decisive movement is expected soon. A breakout would take the price to $13.80, while a breakdown could cause a fall to $7.
The daily RSI is at 50, a sign of a neutral trend. Therefore, it fails to indicate whether the APT price will break out or down.
So, a look at a lower timeframe is required to determine if the APT price trend is bullish or bearish.
Aptos (APT) Price Prediction for April: Further Gains Ahead
The technical analysis from the daily time frame provides a decisively bullish Aptos price forecast. The massive upward movement at the beginning of the year was likely wave one of a five-wave upward movement (black). This is supported by the correction ending right at the 0.618 Fib retracement support level (white).
Then, the next increase that caused the aforementioned price breakout is likely the beginning of wave three. The sub-wave count is given in white.
If so, the price can increase toward at least $27, giving waves one and three a 1:1 ratio. In case wave three extends, the next resistance would be at an average price of $37.60, giving waves one and three a 1:1.61 ratio.
On the other hand, a decrease below the wave two low at $9.77 (red line) would invalidate the bullish wave count. In that case, the digital asset could fall to $4.
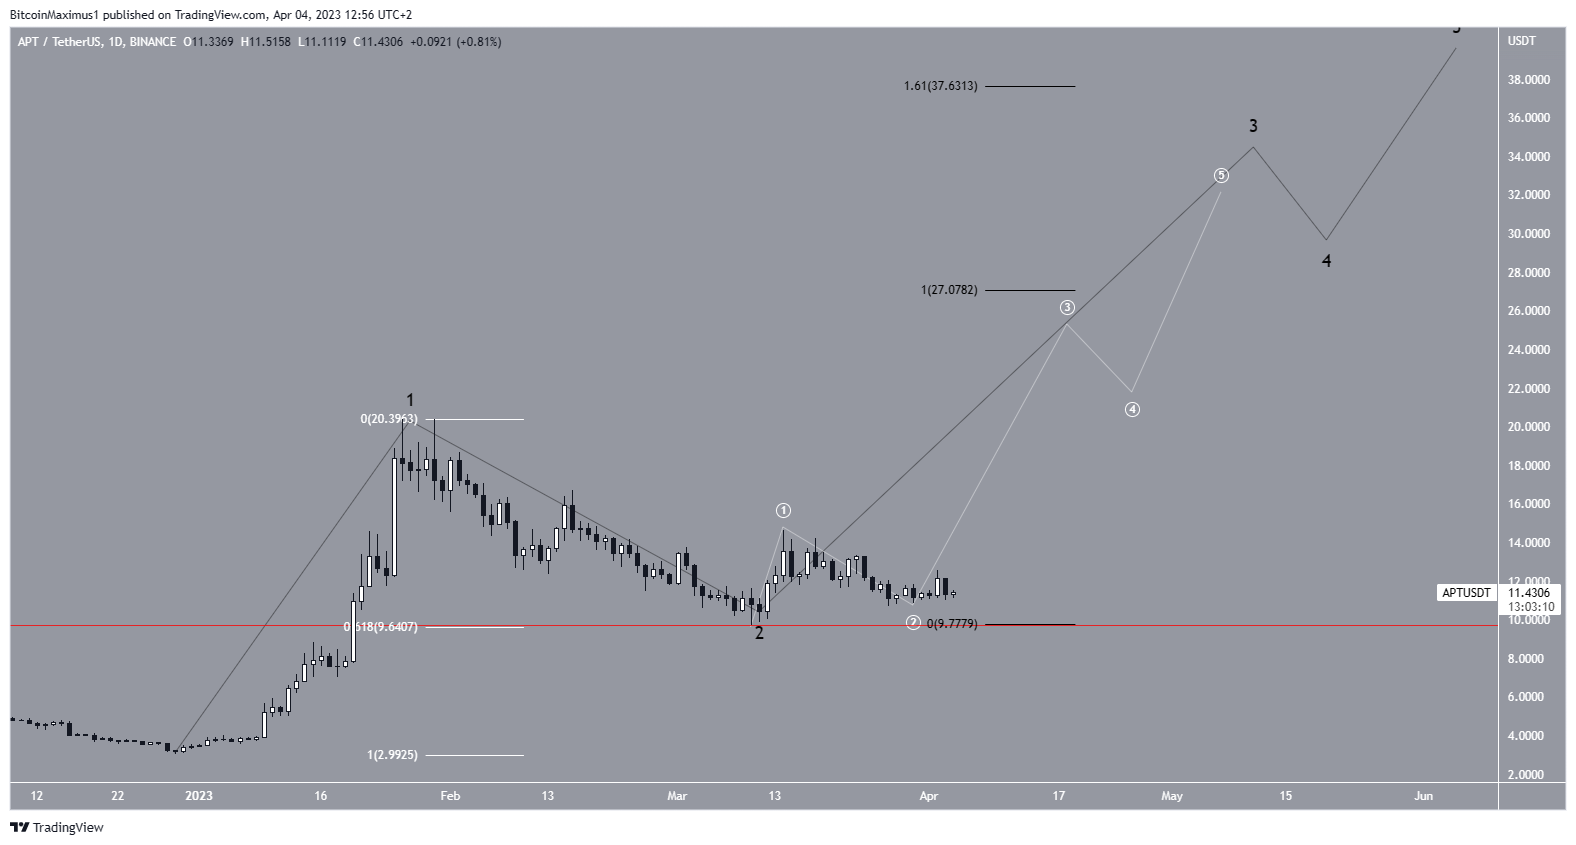
To conclude, the most likely Aptos price prediction for April is an increase toward at least $27 and possibly $37.60. However, a decrease below $9.77 would invalidate this bullish forecast. In that case, the APT price could decrease to $4.
For BeInCrypto’s latest crypto market analysis, click here.


