


Be[In]Crypto takes a look at the five cryptocurrencies that decreased the most last week, more specifically, from Aug 5 to 12.
These cryptocurrencies are:
- ApeCoin (APE) : -8.55%
- Waves (WAVES) : -4.72%
- Kusama (KSM) : -3.90%
- Helium (HNT) : -2.15%
- Synthetix (SNX) : -1.55%
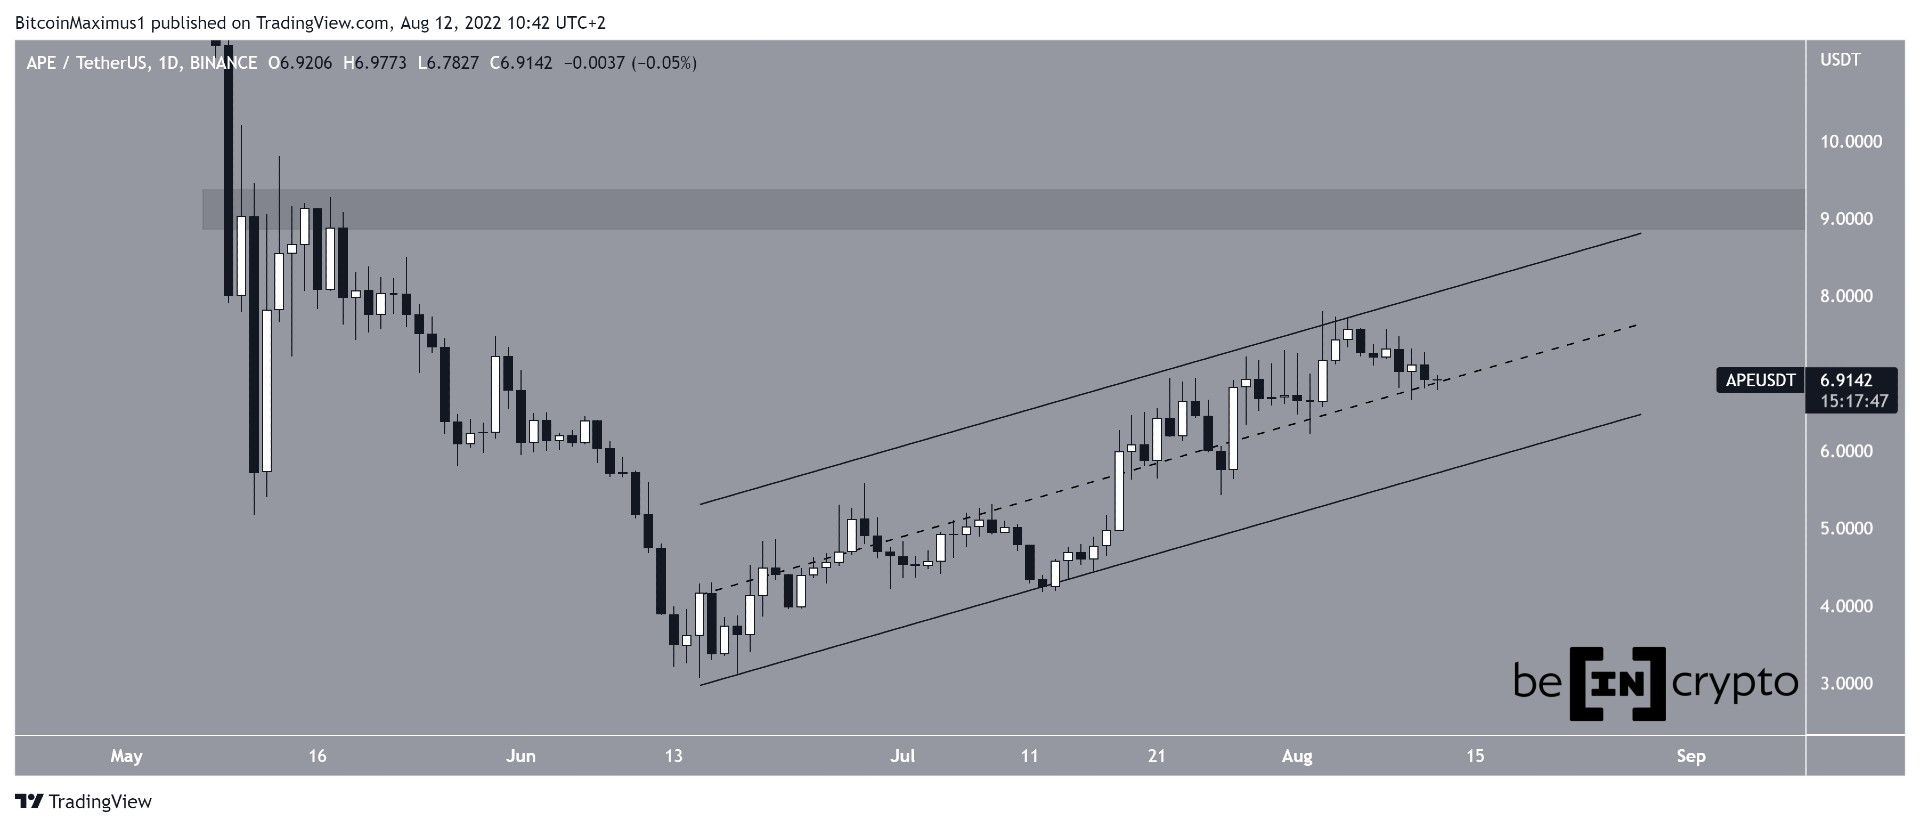
APE
APE has been increasing since reaching a low on June 15. The entire upward movement has been contained inside an ascending parallel channel. Such channels usually contain corrective movements, meaning that an eventual breakdown would be likely.
However, APE is still in the upper portion of this channel, allowing for the possibility of an eventual breakout.
Whether APE breaks down from the middle of the channel or breaks out from its resistance line will likely determine the direction of the future trend.
The closest horizontal resistance area is at $9.10.
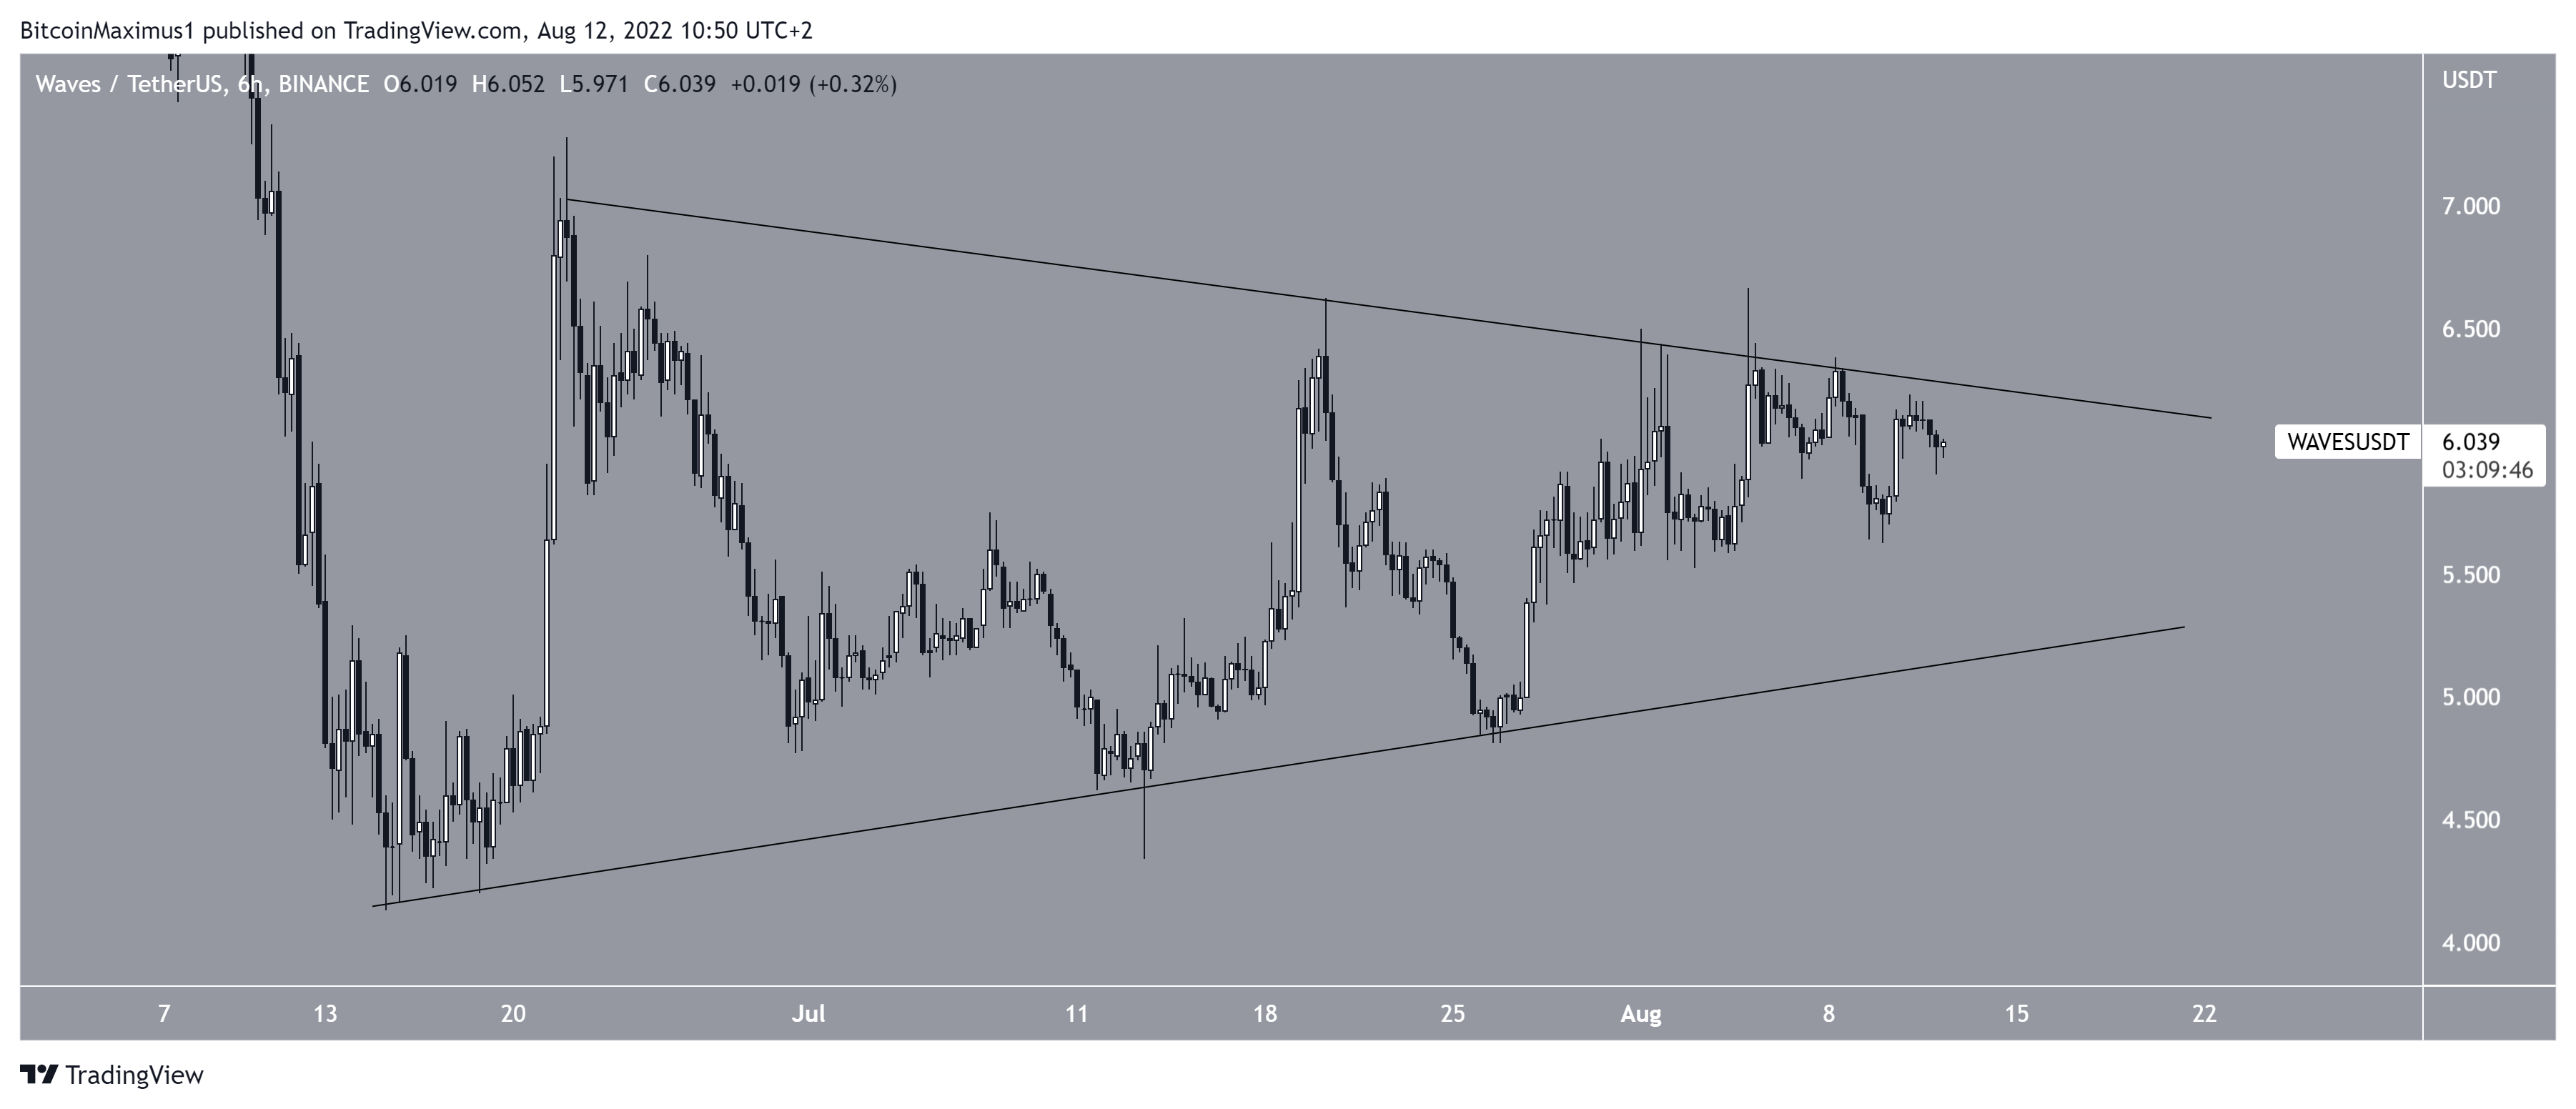
WAVES
WAVES has been increasing since June 15. However, it reached its high on June 22 and has been consolidating since. The entire movement is contained inside a symmetrical triangle, which is considered a neutral pattern.
As a result, both a breakdown and a breakout remain possible.
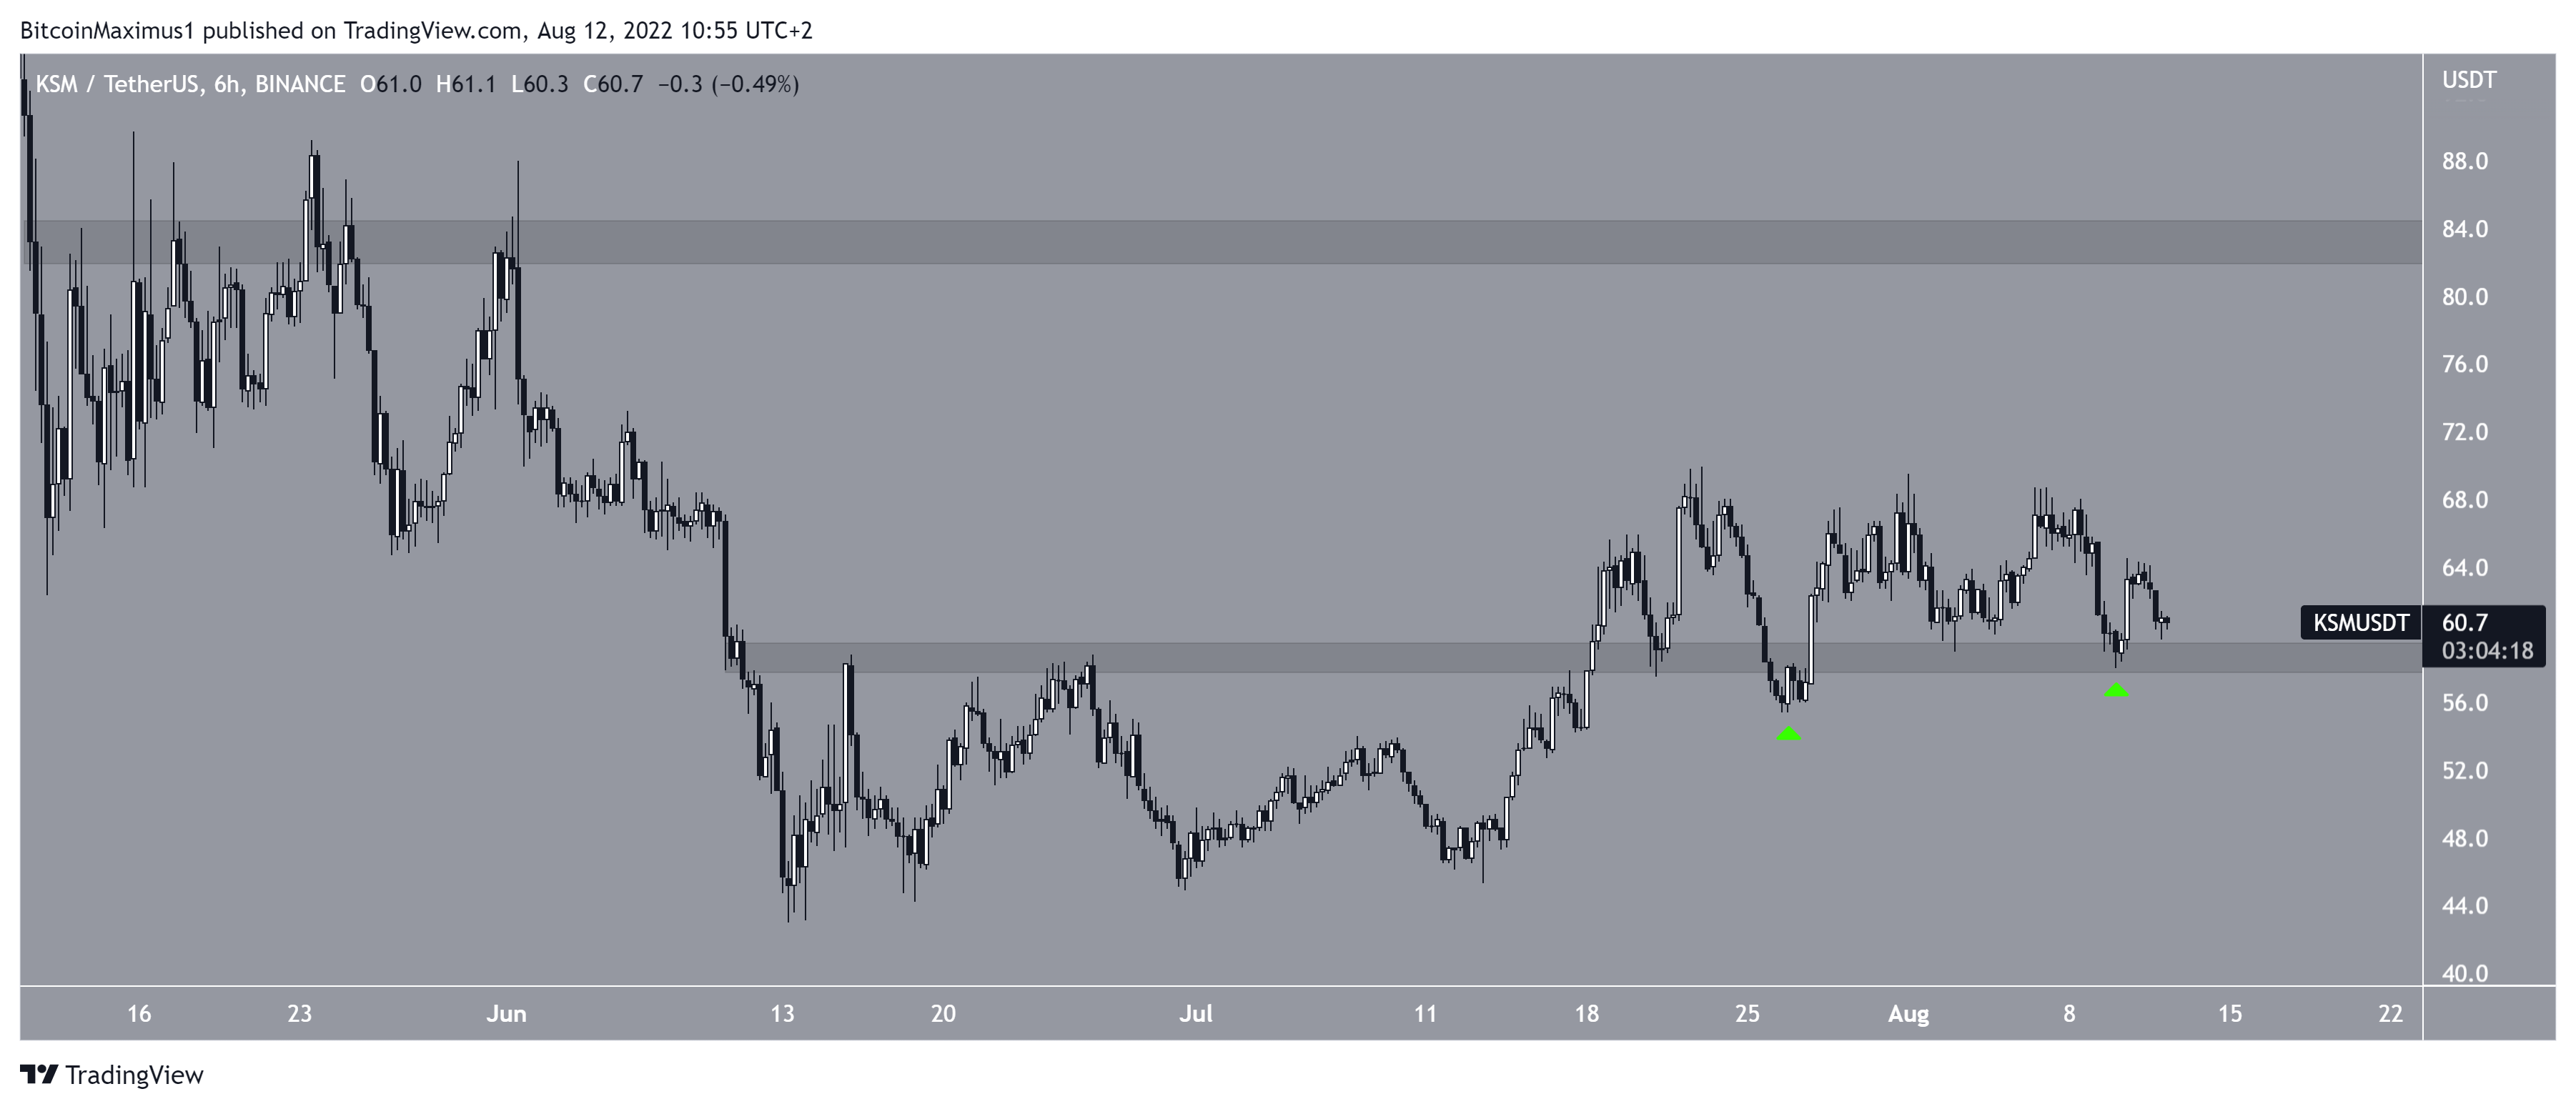
KSM
KSM has been moving upwards since June 13. It created a higher low on July 13 and accelerated its rate of increase afterwards. On July 18, KSM broke out from the $59 area and validated it as support afterwards (green icons).
If KSM continues to increase, the next closest resistance area would be at $83.
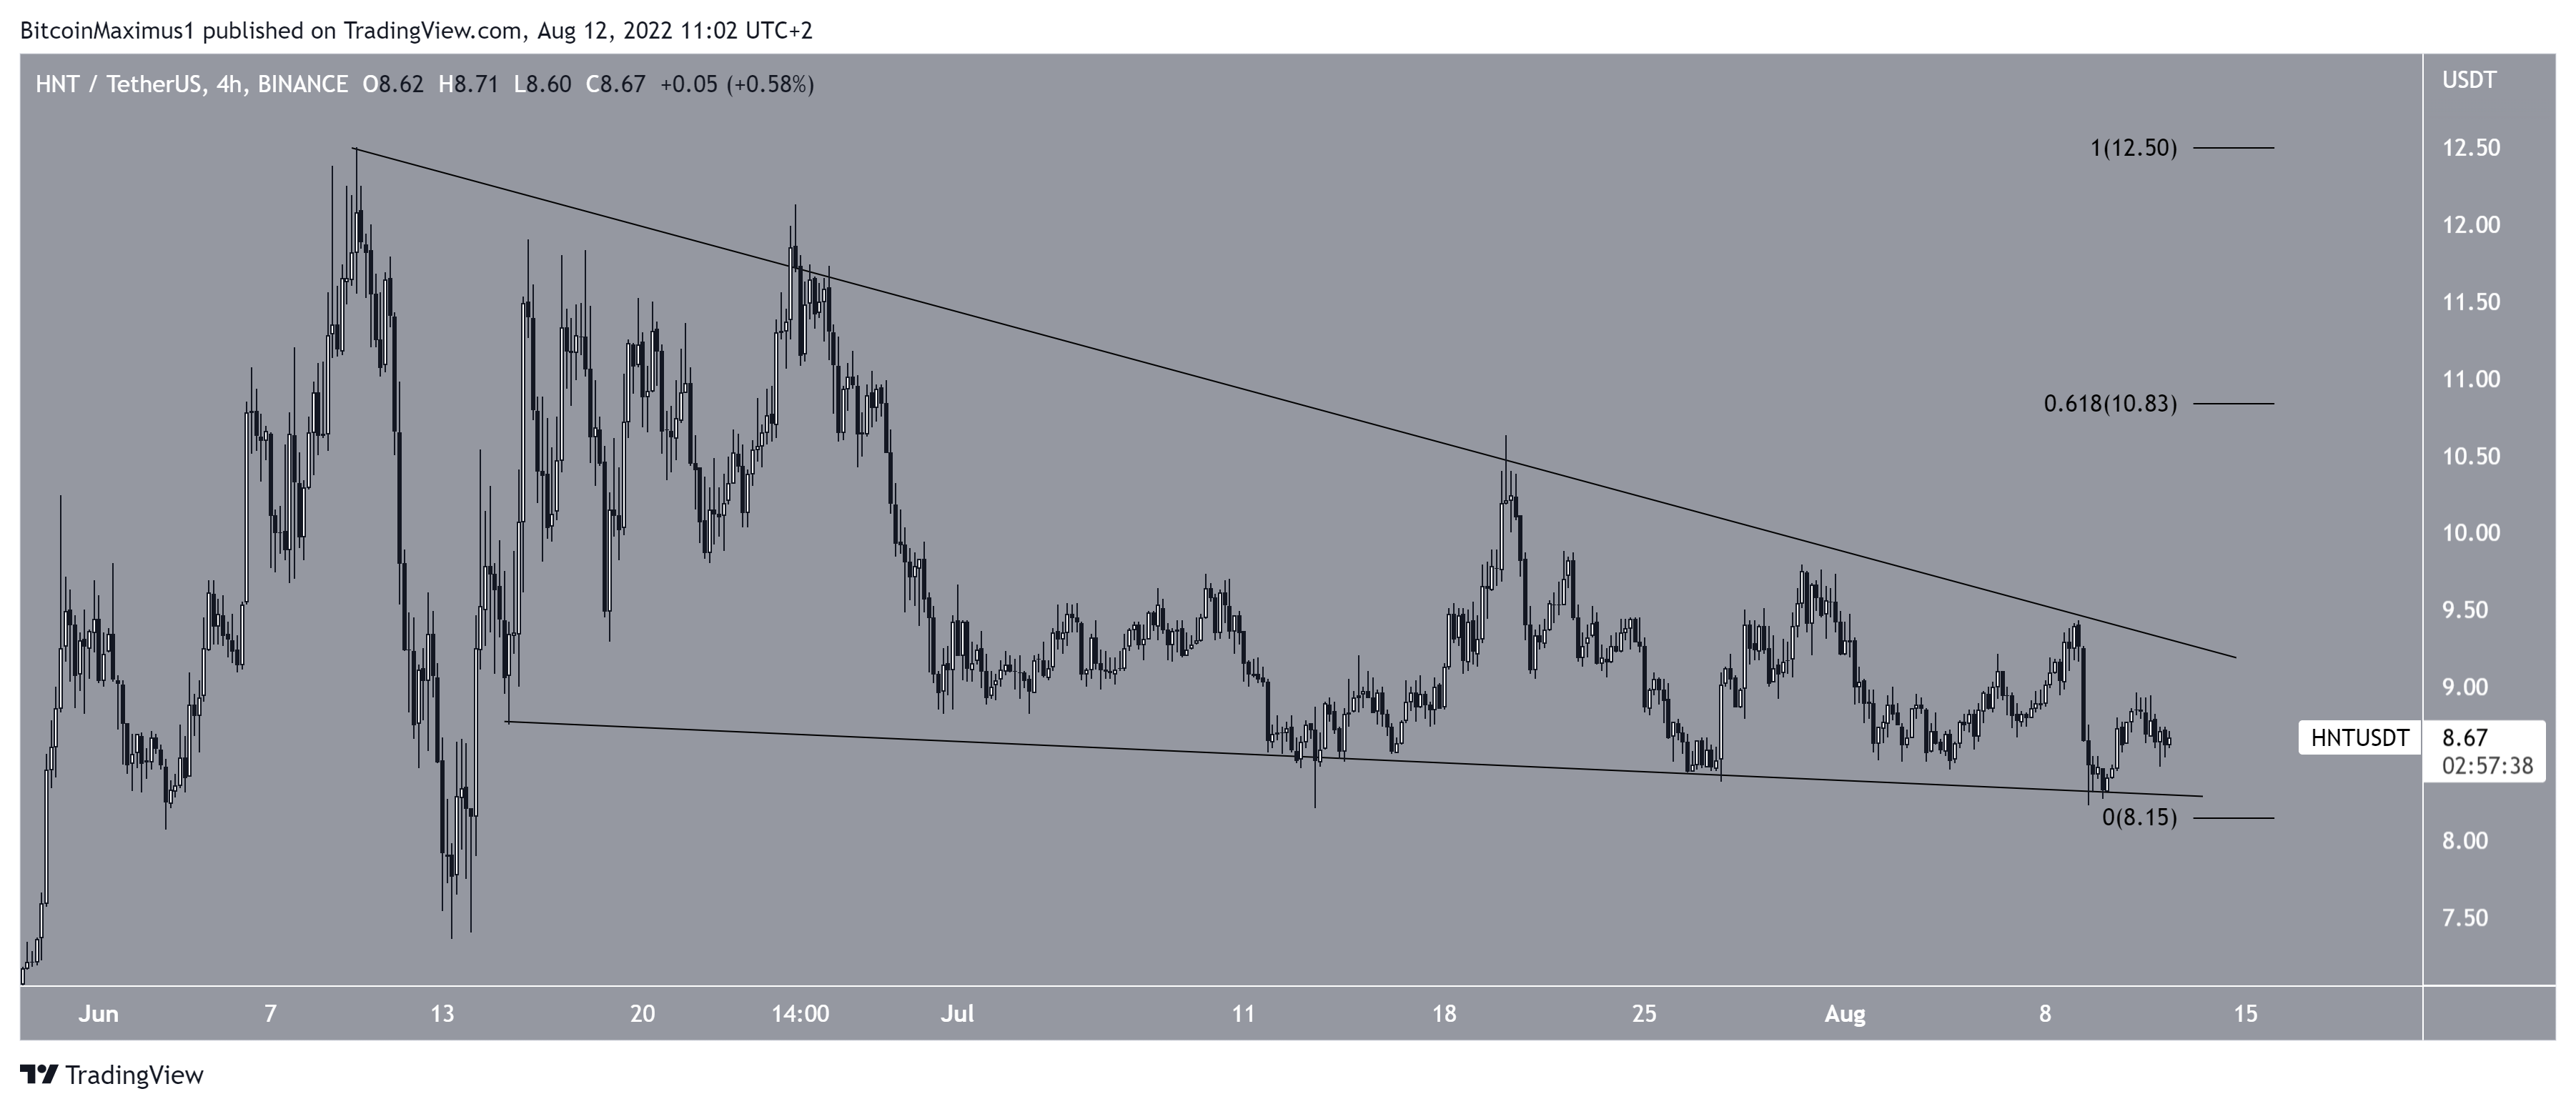
HNT
HNT has been falling inside a descending wedge since June 10. The descending wedge is considered a bullish pattern, meaning that a breakout from it would be the most likely scenario. HNT is rapidly approaching the end of the pattern.
If a breakout occurs, the next closest resistance area would be at $10.85. This is the 0.618 Fib retracement resistance level when measuring the entire downward movement.
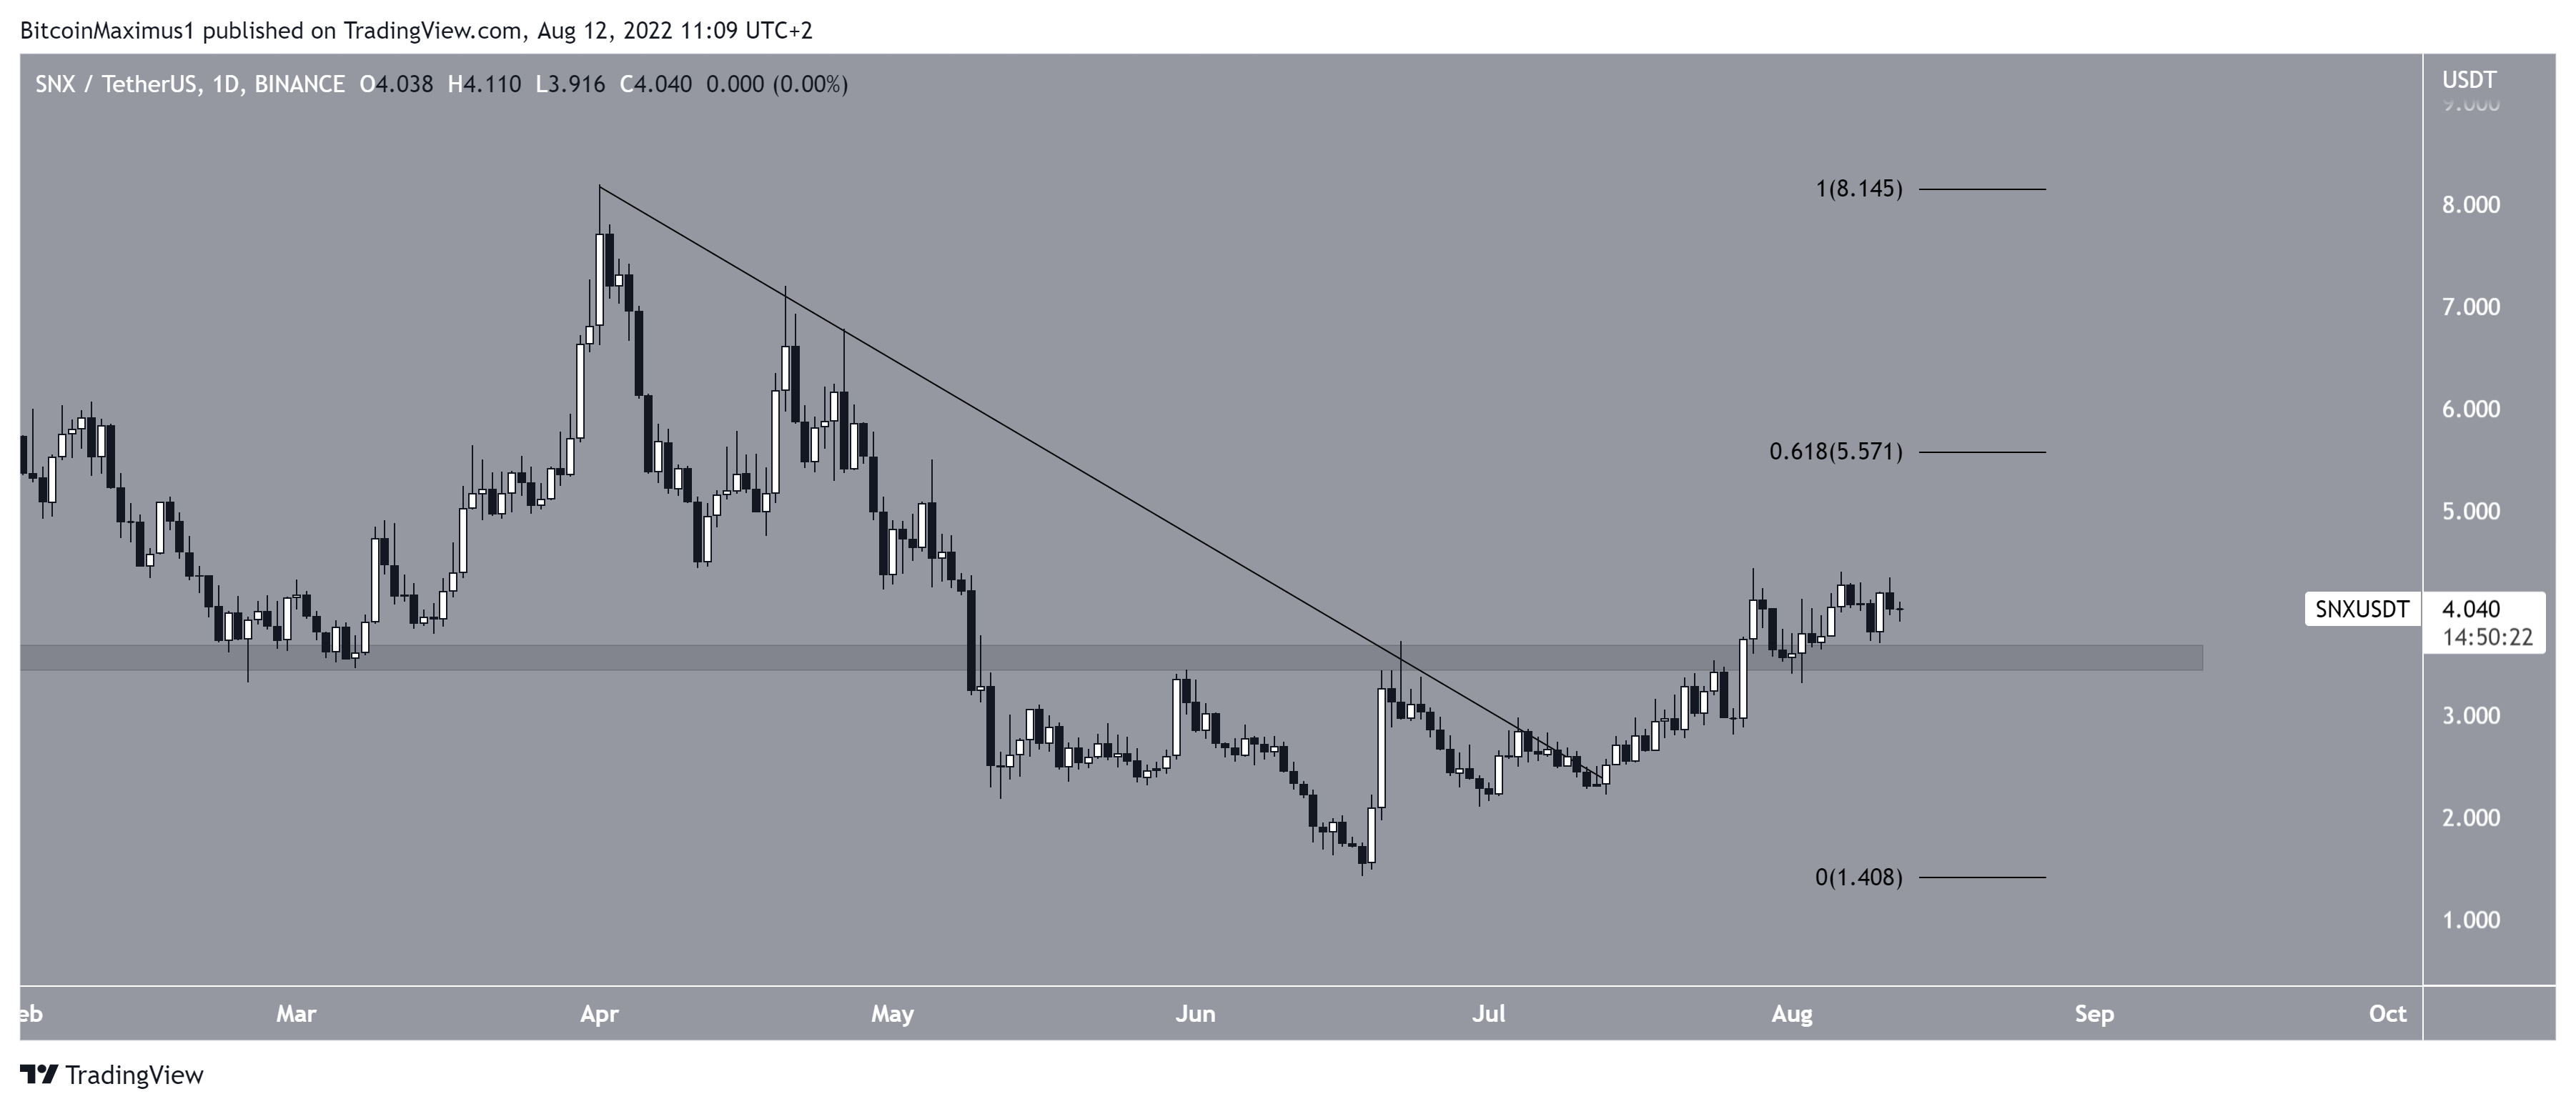
SNX
On July 13, SNX broke out from a descending resistance line that had been in place since the beginning of April. Shortly afterwards, it reclaimed the $3.60 horizontal area, which had been previously acting as resistance.
If the upward movement continues, the closest resistance area would be at $5.57. This is the 0.618 Fib retracement resistance level.
For Be[in]Crypto’s latest Bitcoin (BTC) analysis, click here


